37599 Rambling Rd · White Branch, MO
Flood risk No data
- FEMA flood zone
- —
- Chance of flooding over 30 yrs
- —
- Est. flood insurance / yr
- —
Fire risk No data
- Est. fire insurance / yr
- —
Heat risk No data
- Hot days now (above threshold)
- —
- Hot days in 30 yrs
- —
Wind risk No data
- Chance of severe wind over 30 yrs
- —
Air-quality risk No data
- Unhealthy air days now
- —
- Unhealthy air days in 30 yrs
- —
Risk factors via First Street. Map © Google.
Why this score? — see what drove the D grade
The composite is a weighted blend of 9 inputs, each scored 0–100. Each bar is that input's sub-score; the figure is the points it added to the 100-point composite (weight × sub-score).
- Cash flow +13.2/30.0
- Appreciation +7.7/10.0
- 1% rule +4.1/10.0
- DSCR +3.9/10.0
- Condition / age +3.8/5.0
- Schools +3.0/10.0
- Rent growth +2.5/5.0
- Livability +2.5/5.0
- ARV discount +0.0/15.0
$124,444
🖨 Deal sheet (PDF) 📄 Offer letter ✓ Due diligence
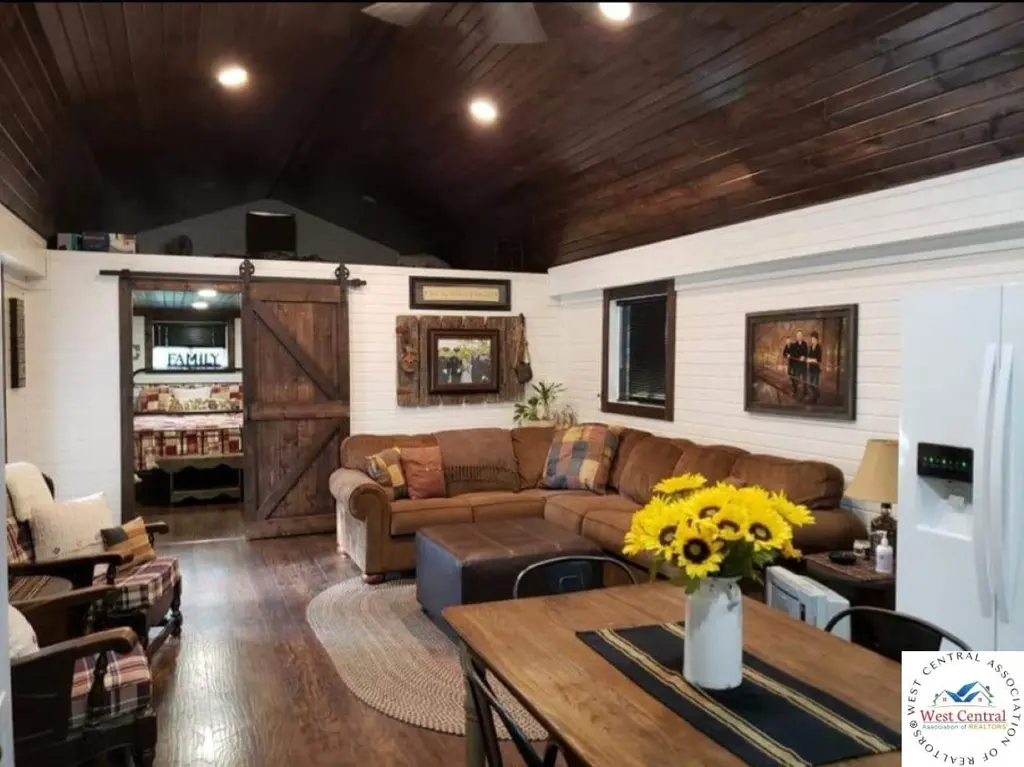
Listing remarks
Enjoy peaceful country living just 10 miles from town with this well-built 2019 home situated on a spacious 1-acre lot off Hwy 83. Located in a gated, family-friendly, and up-and-coming community, this property offers both comfort and opportunity. The home features 1 bedroom plus a generous 16' x 14' sleeping loft—perfect for guests—along with a 5’ cedar-lined walk-in closet. There are 2 bathrooms, including one with a classic clawfoot tub, and the other has a full spacious shower. The kitchen is thoughtfully designed with custom cabinetry, a pot filler over the stove, and all appliances included: refrigerator, stove, dishwasher, microwave, washer, and dryer. Built for eff
Key facts
- Gated community
- Custom cabinetry
- Spacious 1 acre lot
Tags
Property features AI
Finance
- HOA & community: Homeowners association with an annual fee of $410 (about $34.17/month)
Exterior
- Parking: 2 total parking spaces; 2 covered parking spaces; 2-car garage; Carport
- Utilities: Shared well water; 220 volts electrical service
- Home design: Single-family residence; Residential property
- Construction: Metal siding; Metal roof
- Exterior features: Deck; Shed(s); Approximately 1 acre lot; Accessible approach with ramp
Interior
- Kitchen: Electric oven; Electric range; Microwave; Refrigerator; Dishwasher
- Bathrooms: 2 full bathrooms
- Heating & cooling: Propane heating; Ductless heating (mini-split or similar)
- Interior features: Water softener (owned); Accessible entrance with ramp; Crawl space basement
- Laundry & utility: Washer; Dryer; Electric water heater; 220V electrical service (including 220V in laundry)
Neighborhood map
What this means for you Summary
Snapshot
- This is a 1-bed/2.0-bath single-family listed at $124k. Condition is rated good.
Deal economics
- At list price, monthly cash flow is $-3 ($-40/yr) — negative.
- To cash-flow at today's rent, offer at most $124k (0.4% below list).
- To meet the 1% rule (rent ≥ 1% of price), the offer needs to be $113k (9.4% below list).
- Recommended offer: $113k (9.4% below list) — sets the bar for 1% rule.
- Cap rate 6.3% vs local median 3.7% in White Branch — top-decile yield for the area; either an underpriced asset or a hidden risk that comps aren't pricing in. Stress-test before assuming the spread holds.
Location & tenants
- Location reads: area grade D — affects rentability + tenant quality, not the cash-flow math above.
- Warsaw R-IX (rural): math 30% / reading 42% proficiency, ranked #222 of 324 in MO (top 68%) — families likely to look elsewhere, expect single-tenant / working-renter base with shorter leases; 61% free/reduced lunch — lower-income household profile, screen leases tightly.
- Zoned schools: John Boise Middle School (math 37% / reading 40%, grade F, #202 of 391 statewide, top 54%, 278 students, 99% FRL); Warsaw High School (math 27% / reading 52%, grade F, #247 of 521 statewide, top 55%, 403 students, 99% FRL) — zoned schools average 99% FRL vs 61% district-wide (38 pts higher); higher-poverty schools than district average — tighter screening recommended.
- Market conditions: 275 active listings in the ZIP; 9 units permitted in Benton County in 2024 (0 in 5+ unit buildings).
Forward outlook
- In year one you build about $8k of equity ($860 loan paydown + $7k appreciation (5.5% local appreciation)).
- Benton County population projected at -21% by 2050 — secular population decline; favor cash flow + early exit over multi-decade hold.
- At projected returns (5.5% appreciation + 3.0% rent growth), your $35k cash investment doubles in ~5 years — after that, you're playing with house money.
- By year 5, paydown + projected appreciation supports a ~$33k cash-out refi (75% LTV) — recoverable capital for the next deal without selling this one.
Negotiation context
- It's been on market 42 days — a 3% lower offer ($121k) is reasonable based on typical stale-listing flexibility.
Questions for the listing agent
- What do current leases actually rent for vs. the listed asking? Can we see a recent rent roll and the last 12 months of T-12 income?
- It's been on market 42 days. Have you received any prior offers? Is the seller open to a 9% concession, seller financing, or rate buy-down credit?
- What does the HOA fee cover, when was the last increase, and are there any pending special assessments or reserve-fund shortfalls?
- Is there a deadline driving the sale (1031 exchange, divorce, estate, relocation)? That informs how much negotiation room exists.
- The area grade is low — what's the realistic commute time and amenity access for the typical tenant pool here? Any planned neighborhood developments (good or bad) we should know about?
- What's the average days-on-market for RENTAL listings here right now (not sales)? A rising rental-DOM trend means longer vacancies and softer asking-rent achievability than the comps imply.
- What's the recent tenant-quality profile in this submarket — average credit score on applications, eviction rate, late-payment / NSF rate, and stable-employment percentage? A property-management company in the area should have these aggregated.
- How much new for-sale + rental construction is in the pipeline within 1–3 miles? Heavy new supply typically softens prices + rents 12–24 months out; constrained supply supports both.
Investment metrics
- 1% rule
- 0.91% ✗
- Cap rate
- 6.26%
- Cash-on-cash
- -0.11%
- DSCR
- 0.99
- GRM
- 9.2
CMA / ARV
- ARV (median comp)
- $94,989
- List price
- $124,444
- Delta
- 31.01%
- Verdict
- OVERPRICED
- Comps
- 1 within 2.0 mi
Projected returns pro-forma
5.45% appreciation · 3.0% rent growth · sell at horizon
- IRR
- 13.9%
- Equity multiple
- 1.91×
- Total profit
- $31,731
- Equity at exit
- $73,950
- IRR
- 14.5%
- Equity multiple
- 3.72×
- Total profit
- $94,778
- Equity at exit
- $130,557
Cash invested: $34,844 (down + closing). Projections, not guarantees.
Landlord ↔ Tenant lean methodology
- Overall (STATE)
- 81 Strongly Landlord-Friendly
- State Missouri
- 81 Strongly Landlord-Friendly · R+10
- County
- — inherits STATE
- City
- — inherits STATE
ZIP-level market 65355
- Home prices YoY
- 2.4%
- Active inventory
- 275
- Price-to-rent
- 9.2×
Monthly cashflow live
- Estimated rent
- $1,127 medium interval (Pro) →
- Mortgage (P&I)
- −$653
- Tax est. 1.5%
- −$156 /mo · $1,867/yr
- Insurance
- −$52
- HOA
- −$34
- Vacancy / Maint / Mgmt
- −$237
- Net cashflow
- $-3
Break-even live
Sensitivity live
| Price | -10% $83 | -5% $40 | +0% $-3 | +5% $-46 | +10% $-89 |
|---|---|---|---|---|---|
| Rent | -10% $-92 | -5% $-48 | +0% $-3 | +5% $41 | +10% $86 |
| Rate | -1.0pp $59 | -0.5pp $28 | base $-3 | +0.5pp $-36 | +1.0pp $-68 |
UW: 25.0% down · 7.5% · 30yr · 1.5% tax · 5.0% vac · 8.0% maint · 8.0% mgmt
Financing live
Cash to close
- Down payment
- $31,111
- Closing costs
- $3,733
- Reserves months
- —
- Total cash needed
- —
Loan-product check · same deal, 3 products live
Conventional
25% down · 7.5% · 30yr
- Down + closing
- —
- Monthly P&I
- —
- Monthly cashflow
- —
- DSCR
- —
- Eligible?
- —
Personal DTI + credit; lowest rate.
DSCR
20% down · 8.5% · 30yr
- Down + closing
- —
- Monthly P&I
- —
- Monthly cashflow
- —
- DSCR
- —
- Eligible?
- —
No personal income docs; deal must DSCR.
Hard money
10% down · 12.0% · 12mo
- Down + closing
- —
- Monthly P&I
- —
- Monthly cashflow
- —
- DSCR
- —
- Eligible?
- —
Short-term bridge; refi at stabilization.
HOA detail
- Monthly dues
- $34 · $408/yr
- Likely covers
- security
Listing history 11 events
-
2026-06-12statusdays on market $124,444 Pending 42 DOM
-
2026-06-09days on market $124,444 Active 40 DOM
-
2026-06-08days on market $124,444 Active 39 DOM
-
2026-06-07days on market $124,444 Active 38 DOM
-
2026-06-07days on market $124,444 Active 37 DOM
-
2026-06-04days on market $124,444 Active 34 DOM
-
2026-06-02days on market $124,444 Active 33 DOM
-
2026-06-01days on market $124,444 Active 32 DOM
-
2026-05-31days on market $124,444 Active 31 DOM
-
2026-05-31days on market $124,444 Active 30 DOM
-
2026-04-30$127,500 Active 2345-char remark
ⓘ Source: listings_history table (triggers on properties + properties_extension) + one-shot
backfill from property_details.listing_events for pre-trigger history.
Nearby sold comps map
Loading sold comps map…
Walkable amenities ~0.75 mi
Loading nearby amenities…
Taxation est. · year 1
- Rental income
- $13,529
- − Mortgage interest
- −$6,971
- − Property taxes
- −$1,867
- − Insurance
- −$622
- − Repairs & maintenance
- −$1,082
- − Management
- −$1,082
- − HOA
- −$408
- − Depreciation
- −$3,620
- Taxable loss
- −$2,123
- Est. tax savings @ 24.0%
- +$510
- After-tax cash flow
- $470/yr
For passive investors: Depreciation is non-cash, so a rental often shows a tax loss while cash-flowing — sheltering income. Rental losses are passive: they offset passive income freely, and up to $25,000/yr can offset ordinary (W-2) income if you actively participate and your MAGI is under $100k (phasing out to $0 by $150k); unused losses carry forward. On sale, claimed depreciation is recaptured at up to 25%, and gains may owe capital-gains tax (a 1031 exchange can defer both). Figures are a year-1 estimate at your 24.0% rate — not tax advice; consult a CPA.
Condition & rehab AI · 13 photos
This 2019 single-family home on a 1-acre lot offers a good condition with a well-maintained exterior and interior. It has a good potential for value increase with minor improvements in landscaping, painting, and kitchen appliances.
Value-add opportunities
- Both Landscaping and curb appeal improvements — Enhances curb appeal and could attract more buyers
- Both Painting exterior and interior walls — Fresh paint can make the home look more inviting and maintain its value
- Both Upgrading kitchen appliances — Modern appliances can increase both resale and rental value
Renovation cost estimate screening
Value-add ROI direction
- Both Landscaping and curb appeal improvements — Enhances curb appeal and could attract more buyers ↑
- Both Painting exterior and interior walls — Fresh paint can make the home look more inviting and maintain its value ↑
- Both Upgrading kitchen appliances — Modern appliances can increase both resale and rental value ↑
ⓘ Cost ranges are severity-bucket heuristics (US national rule-of-thumb). Get contractor quotes + a written scope before underwriting a rehab budget.
Schools (NCES district)
- District
- Warsaw R-IX
- NCES district ID
- 2931070
- Math proficiency
- 30% ▬ 0.00%
- Reading proficiency
- 42% ▲ 4.00%
- Median HH income
- $33,160
- Composite
- 29.53/100
- National rank
- #6495
- State rank
- #222 of 324 in MO
Livability — White Branch
No livability data for this city. (Only ~50 U.S. cities are tracked.)
Census & demographics
- Population (ZIP)
- 11,029
Population outlook (Benton County) Hauer SSP2
- Today (2025)
- 17,355 people
- By 2030
- 16,513 · -4.9%
- By 2040
- 14,898 · -14.2%
- By 2050
- 13,662 · -21.3%
- By 2075
- 11,308 · -34.8%
- By 2100
- 8,755 · -49.6%
Race, ethnicity, and origin ACS 2023
- Neighborhood character
- Predominantly White (92%)
- Race & ethnicity
- White 92% Two or more races 6% Hispanic / Latino 2% Native American 1%
- Common ancestry
- Slovak 3% Italian 2% Iranian 2%
- Foreign-born
- 1% · Canada
Political lean MEDSL · Benton
- 2024 margin
- Solid R (+59.1) · D 20.1% · R 79.2%
- 2008→2024 swing
- -36.8pp toward R · 2008: -22.3pp · 2024: -59.1pp
- All cycles
- 2024: R+59.1 2020: R+56.6 2016: R+54.1 2012: R+34.3 2008: R+22.3
Not yet ingested
- Civics
- —
Market trends
- HPI YoY
- ▲ 5.45%
- Current HPI
- 232.6924
- Rent YoY
- —
- Metro
- —
- State GDP YoY
- ▲ 1.84%
- F500 in state
- 20
Industry mix (Fortune 500 HQ in MO)
| Industry | F500 HQs | Revenue |
|---|---|---|
| Healthcare | 1 | $163B |
|
||
| Insurance | 1 | $21B |
|
||
| Industrial Technology | 1 | $17B |
|
||
| Retail | 1 | $16B |
|
||
| Industrial Distribution | 1 | $10B |
|
||
| Utilities | 1 | $9B |
|
||
Price history
-2.4% since first listed3 events — show timeline
- 2026-06-11 Pending — WCAR
- 2026-05-27 Price Changed $124,444 WCAR
- 2026-04-30 Listed $127,500 WCAR
Cash-flow waterfall
monthlySold comps — $/sqft
last 12 mo · ≤1 miLoading sold comps…