 Multi-family
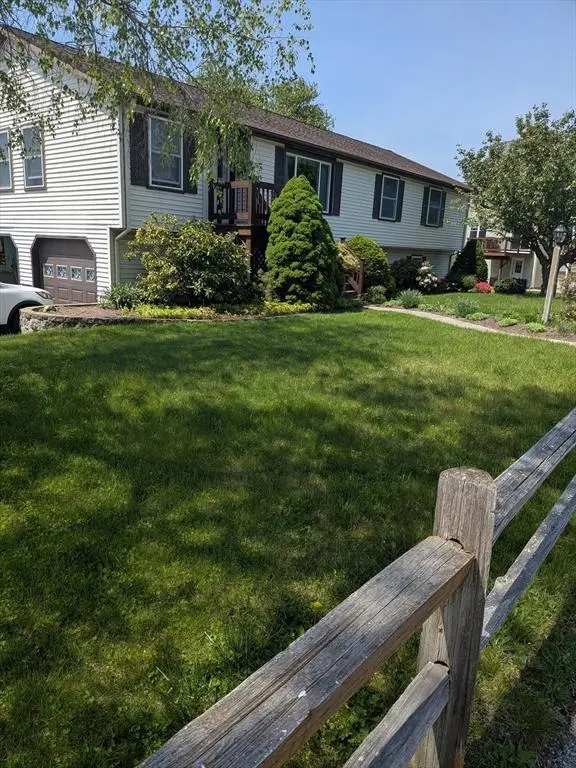
4 Eastern Ave · Webster, MA
Flood risk 1/10 · Minimal
- FEMA flood zone
- X (unshaded)
- Chance of flooding over 30 yrs
- 0.0%
- Est. flood insurance / yr
- $473 – $860
Fire risk 3/10 · Minor
- Est. fire insurance / yr
- $915 – $1,699
Heat risk 4/10 · Minor
- Hot days now (above 94°F)
- 7 days/yr
- Hot days in 30 yrs
- 15 days/yr
Wind risk 6/10 · Moderate
- Chance of severe wind over 30 yrs
- 51.0%
Air-quality risk 2/10 · Minimal
- Unhealthy air days now
- 2 days/yr
- Unhealthy air days in 30 yrs
- 2 days/yr
Risk factors via First Street. Map © Google.
Why this score? — see what drove the F grade
The composite is a weighted blend of 9 inputs, each scored 0–100. Each bar is that input's sub-score; the figure is the points it added to the 100-point composite (weight × sub-score).
- Appreciation +10.0/10.0
- Cash flow +8.1/30.0
- Livability +3.2/5.0
- Rent growth +2.5/5.0
- Condition / age +2.5/5.0
- DSCR +2.1/10.0
- Schools +1.9/10.0
- 1% rule +1.6/10.0
- ARV discount +0.0/15.0
$569,900
🖨 Deal sheet 📄 Offer letter ✓ Due diligence
Multi-family units
County records classify this as Multi-Family (2-4 Unit). Listing-text estimate: 1 unit. estimate disagrees with records
Listing remarks
First Time Offered!! Beautifully maintained one owner Raised ranch. Home has been lovingly cared for! Newer kitchen, windows, roof, water heater. Welcome to the sun filled 3 season porch , such a pleasure to relax on any type of day. Over sized living room light and bright! Dinning room boasts a picture window and yes it is new!! Off the hall you will find the first recently remodeled full bath, 3 spacious bedrooms, primary bedroom with full bath! Landscaped beautifully, paved drive leading to your 2 car garage. A bonus includes a lower level walkout 1 bedroom unit that is rented for extra income.
Key facts
- Newer kitchen
- New water heater
- New roof
Tags
Property features AI
Finance
- Other: Property is listed as multi-family; Above-grade finished area and below-grade finished area present
- HOA & community: Community features include shopping, tennis courts, stables, golf, medical facility, laundromat, highway access, house of worship, marina, private and public schools, sidewalks; Not a senior community
Exterior
- Parking: 2-car garage; 2 covered parking spaces; 6 open parking spaces; Total of 8 parking spaces; Off-street paved parking
- Utilities: Public water; Public sewer; 100 amp electric service; Electric range hookup
- Home design: Multi-family house; 2 stories; Beige exterior; Modular/frame construction
- Construction: Built (per public records); Concrete perimeter foundation
- Exterior features: Shingle roof; Paved road frontage; Publicly maintained road; Lake/pond nearby; 1–2 miles to beach; Public beach access; Paved driveway and paved parking areas; Public utilities (water and sewer)
Interior
- Flooring: Carpet; Laminate
- Bathrooms: 3 full bathrooms
- Interior features: Living room; Insulated windows; Total of 10 rooms
- Laundry & utility: Washer hookup; Electric dryer hookup
Neighborhood map
What this means for you Summary
Snapshot
- This is a 4-bed/3.0-bath multifamily listed at $570k.
Deal economics
- At list price, monthly cash flow is $-563 ($-7k/yr) — negative.
- To cash-flow at today's rent, offer at most $470k (17.5% below list).
- To meet the 1% rule (rent ≥ 1% of price), the offer needs to be $377k (33.9% below list).
- Recommended offer: $377k (33.9% below list) — sets the bar for 1% rule.
- Cap rate 5.1% vs local median 3.2% in Webster — top-decile yield for the area; either an underpriced asset or a hidden risk that comps aren't pricing in. Stress-test before assuming the spread holds.
Location & tenants
- Location reads 65/100 on livability (#183 in MA) — a middle-class / working-renter tenant base. Strengths: health & safety A+, housing A; Watch: schools D-, crime D-, amenities F.
- Webster (suburban): math 15% / reading 28% proficiency, ranked #286 of 302 in MA (top 95%) — low school quality limits family demand, transient renter base, plan for 1-2y turnover.
- Market conditions: 40 active listings in the ZIP; 1 comparable units currently listed for rent nearby; 2,293 units permitted in Worcester County in 2024 (1,205 in 5+ unit buildings).
- At $3,769/mo this rent would consume 62% of the median local household income ($73k/yr) (locally 690% of renters already pay >50% of income on rent) — very limited rent-growth headroom before tenants either downsize or default.
Forward outlook
- In year one you build about $61k of equity ($4k loan paydown + $57k appreciation (10.0% local appreciation)).
- By year 2, paydown + projected appreciation supports a ~$98k cash-out refi (75% LTV) — recoverable capital for the next deal without selling this one.
Negotiation context
- Only 11 days on market — expect competitive offers; lowballing is unlikely to land.
Risks & watch-outs
- Climate carrying-cost: major wind risk, 51% chance of damaging wind over 30y — expect insurance premiums to compound above CPI over the hold.
Questions for the listing agent
- What do current leases actually rent for vs. the listed asking? Can we see a recent rent roll and the last 12 months of T-12 income?
- Is there a deadline driving the sale (1031 exchange, divorce, estate, relocation)? That informs how much negotiation room exists.
- Schools are D-rated, which usually means shorter tenancies and higher turnover. Who's the typical renter profile here, and what's been the actual vacancy rate?
- Crime grade is D in this area — have there been break-ins, vandalism, or insurance claims at this property in the last 3 years? What carrier currently insures it and at what premium?
- The area grade is low — what's the realistic commute time and amenity access for the typical tenant pool here? Any planned neighborhood developments (good or bad) we should know about?
- What's the average days-on-market for RENTAL listings here right now (not sales)? A rising rental-DOM trend means longer vacancies and softer asking-rent achievability than the comps imply.
- What's the recent tenant-quality profile in this submarket — average credit score on applications, eviction rate, late-payment / NSF rate, and stable-employment percentage? A property-management company in the area should have these aggregated.
- How much new apartment / multifamily construction is in the pipeline within 1–3 miles? Heavy new supply (>2% of stock underway) typically softens rents 12–24 months out; light construction supports rent growth.
Investment metrics
- 1% rule
- 0.66% ✗
- Cap rate
- 5.11%
- Cash-on-cash
- -4.24%
- DSCR
- 0.81
- GRM
- 12.6
CMA / ARV
- ARV (on-the-fly)
- $457,024
- Comps found
- 12
Show comp detail 12 sales within ~0.75 mi
| Address | Dist | Beds/Ba | Sqft | Sold | Price | $/sf | Match |
|---|---|---|---|---|---|---|---|
| 95 Lake St | 0.17mi | 5/2.0 (+1) | 2,480 (+5%) | 4mo | $500,000 | $202 | 72 |
| 8 Emerald Ave | 0.07mi | 4/2.0 | 2,272 (-4%) | 17mo | $385,000 | $169 | 72 |
| 48 Ray St | 0.32mi | 4/3.0 | 2,096 (-12%) | 6mo | $512,100 | $244 | 61 |
| 17 Granite St | 0.54mi | 5/3.0 (+1) | 2,418 (+2%) | 9mo | $465,000 | $192 | 59 |
| 38 Harris St | 0.40mi | 5/2.0 (+1) | 2,240 (-5%) | 15mo | $311,000 | $139 | 50 |
| 31 Whitcomb St | 0.52mi | 4/2.0 | 2,112 (-11%) | 5mo | $455,000 | $215 | 49 |
| 13 Park Ave | 0.67mi | 5/2.0 (+1) | 2,480 (+5%) | 6mo | $475,000 | $192 | 47 |
| 2-A Nelson St | 0.51mi | 4/2.0 | 2,554 (+8%) | 19mo | $475,000 | $186 | 43 |
| 10 New St | 0.30mi | 4/2.0 | 2,688 (+14%) | 21mo | $520,000 | $193 | 42 |
| 28 E Main St | 0.68mi | 5/3.0 (+1) | 2,547 (+8%) | 12mo | $495,000 | $194 | 41 |
| 21 Granite | 0.56mi | 4/2.0 | 2,040 (-14%) | 9mo | $379,900 | $186 | 39 |
| 6-8 Brook St | 0.64mi | 4/2.0 | 2,028 (-14%) | 10mo | $540,000 | $266 | 33 |
Match score weights: distance 35% · size 25% · config 20% · recency 20%. Top-matched comps best support the ARV.
Projected returns pro-forma
10.0% appreciation · 3.0% rent growth · sell at horizon
- IRR
- 21.3%
- Equity multiple
- 2.72×
- Total profit
- $274,312
- Equity at exit
- $513,411
- IRR
- 19.2%
- Equity multiple
- 6.24×
- Total profit
- $835,649
- Equity at exit
- $1,107,190
Cash invested: $159,572 (down + closing). Projections, not guarantees.
Landlord ↔ Tenant lean methodology
- Overall (STATE)
- 20 Strongly Tenant-Friendly
- State Massachusetts
- 20 Strongly Tenant-Friendly · D+15
- County
- — inherits STATE
- City
- — inherits STATE
ZIP-level market 01570
- Home prices YoY
- 20.5%
- Active inventory
- 40
- Price-to-rent
- 25.2×
Monthly cashflow live
- Estimated rent
- $3,769 high interval (Pro) →
- Mortgage (P&I)
- −$2,989
- Tax from tax record
- −$315 /mo · $3,778/yr
- Insurance
- −$237
- HOA
- −$0
- Vacancy / Maint / Mgmt
- −$791
- Net cashflow
- $-563
Break-even live
2-unit breakdown (identical units grouped — click to expand)
| Units | Beds | Baths | Est. rent |
|---|---|---|---|
| 2× units | 3 | 1.5 | $3,770 |
| #1 | 3 | 1.5 | $1,885 |
| #2 | 3 | 1.5 | $1,885 |
| Total (2 units) | $3,769 | ||
UW: 25.0% down · 7.5% · 30yr · 1.5% tax · 5.0% vac · 8.0% maint · 8.0% mgmt
Financing live
Cash to close
- Down payment
- $142,475
- Closing costs
- $17,097
- Reserves months
- —
- Total cash needed
- —
Loan-product check · same deal, 3 products live
Conventional
25% down · 7.5% · 30yr
- Down + closing
- —
- Monthly P&I
- —
- Monthly cashflow
- —
- DSCR
- —
- Eligible?
- —
Personal DTI + credit; lowest rate.
DSCR
20% down · 8.5% · 30yr
- Down + closing
- —
- Monthly P&I
- —
- Monthly cashflow
- —
- DSCR
- —
- Eligible?
- —
No personal income docs; deal must DSCR.
Hard money
10% down · 12.0% · 12mo
- Down + closing
- —
- Monthly P&I
- —
- Monthly cashflow
- —
- DSCR
- —
- Eligible?
- —
Short-term bridge; refi at stabilization.
Rent comps 1 comps
| Address | Beds | Baths | Sqft | Rent | $/sqft | DOM | Units | Dist |
|---|---|---|---|---|---|---|---|---|
| 23 Brandon Rd Unit 3 Dudley, MA | 3.0 | 1.0 | 1680 | $2,000 | $1.19 | 43d | 1 | 1.25mi |
Listing history 9 events
-
2026-06-18days on market $569,900 Active 11 DOM
-
2026-06-17days on market $569,900 Active 10 DOM
-
2026-06-16days on market $569,900 Active 9 DOM
-
2026-06-15days on market $569,900 Active 8 DOM
-
2026-06-14statusdays on market $569,900 Active 6 DOM
-
2026-06-10days on market $569,900 New 3 DOM
-
2026-06-09days on market $569,900 New 2 DOM
-
2026-06-07remarks 605-char remark
-
2026-06-07$569,900 New 1 DOM
ⓘ Source: listings_history table (triggers on properties + properties_extension) + one-shot
backfill from property_details.listing_events for pre-trigger history.
Tax reassessment forecast MA · Partial reset (capped growth)
- Current annual tax
- $3,778 · $315/mo
- Projected year-2 tax
- $5,394 · $449/mo
- Expected delta
- +$1,616/yr (+$135/mo · 42.8%)
ⓘ Screening estimate from a state-policy table — verify with the county assessor before closing.
Climate risk First Street
- Flood 1/10 Low FEMA zone X (unshaded) · 0% chance over 30 yrs
- Wildfire 3/10 Moderate
- Heat 4/10 Moderate 7 d/yr ≥94°F today · 15 d/yr by 30 yrs out
- Wind 6/10 Major 51% chance of damaging wind over 30 yrs
- Air quality 2/10 Low 2 unhealthy d/yr today · 2 by 30 yrs out
Nearby sold comps map
Loading sold comps map…
Walkable amenities ~0.75 mi
Loading nearby amenities…
Taxation est. · year 1
- Rental income
- $45,228
- − Mortgage interest
- −$31,923
- − Property taxes
- −$3,778
- − Insurance
- −$2,850
- − Repairs & maintenance
- −$3,618
- − Management
- −$3,618
- − Depreciation
- −$16,579
- Taxable loss
- −$17,138
- Est. tax savings @ 24.0%
- +$4,113
- After-tax cash flow
- $-2,648/yr
For passive investors: Depreciation is non-cash, so a rental often shows a tax loss while cash-flowing — sheltering income. Rental losses are passive: they offset passive income freely, and up to $25,000/yr can offset ordinary (W-2) income if you actively participate and your MAGI is under $100k (phasing out to $0 by $150k); unused losses carry forward. On sale, claimed depreciation is recaptured at up to 25%, and gains may owe capital-gains tax (a 1031 exchange can defer both). Figures are a year-1 estimate at your 24.0% rate — not tax advice; consult a CPA.
Schools (NCES district)
- District
- Webster
- NCES district ID
- 2512240
- Math proficiency
- 15% ▼ -10.00%
- Reading proficiency
- 28% ▼ -3.00%
- Median HH income
- $49,939
- Composite
- 19.1/100
- National rank
- #8837
- State rank
- #286 of 302 in MA
Livability — Webster
- Score
- 65/100
- State rank
- #183
- US rank
- #13047
Category grades
Schools grade is shown separately in the Schools card above.
Census & demographics
- Census place
- Webster, MA
- County
- Worcester County · 487,911 people
- City population
- 17,748
- Metro
- Worcester, MA-CT
- Population (ZIP)
- 17,748
- Household income
- $72,895
- Rent vs Own
- Severe rent burden
- 690.0
Population outlook (Worcester County) Hauer SSP2
- Today (2025)
- 850,858 people
- By 2030
- 860,403 · +1.1%
- By 2040
- 869,902 · +2.2%
- By 2050
- 869,110 · +2.1%
- By 2075
- 870,120 · +2.3%
- By 2100
- 829,703 · -2.5%
Race, ethnicity, and origin ACS 2023
- Neighborhood character
- Predominantly White (71%)
- Race & ethnicity
- White 71% Hispanic / Latino 19% Two or more races 9% Black 5% Asian 2%
- Hispanic origin (detail)
- Puerto Rican 13% Cuban 1% Dominican 2%
- Common ancestry
- Romanian 14% Lithuanian 12% Slovak 2%
- Foreign-born
- 10% · Canada, China, Vietnam
- Languages at home
- 80% English-only · Spanish 13% Russian/Polish/Slavic 3% Other Indo-European 1%
Political lean MEDSL · Worcester
- 2024 margin
- D (+10.0) · D 53.9% · R 43.9% · Other 2.2%
- 2008→2024 swing
- -3.8pp toward R · 2008: 13.8pp · 2024: 10.0pp
- All cycles
- 2024: D+10.0 2020: D+17.8 2016: D+10.5 2012: D+9.2 2008: D+13.8
Not yet ingested
- Civics
- —
Market trends
- HPI YoY
- ▲ 101.75%
- Current HPI
- 598.587
- Rent YoY
- —
- Metro
- Worcester, MA-CT
- State GDP YoY
- ▲ 2.28%
- F500 in state
- 38
Industry mix (Fortune 500 HQ in MA)
| Industry | F500 HQs | Revenue |
|---|---|---|
| Technology | 3 | $17B |
|
||
| Insurance | 2 | $84B |
|
||
| Retail | 2 | $76B |
|
||
| Life Sciences | 1 | $43B |
|
||
| Energy Technology | 1 | $31B |
|
||
| Aerospace / Defense | 1 | $18B |
|
||
Price history
1 event — show timeline
- 2026-06-07 Listed $569,900 MLS PIN
Property tax history
+4.6%/yrLatest (2023): $3,778 · +2.4% YoY. Source: county tax records.
Cash-flow waterfall
monthlySold comps — $/sqft
last 12 mo · ≤1 miLoading sold comps…