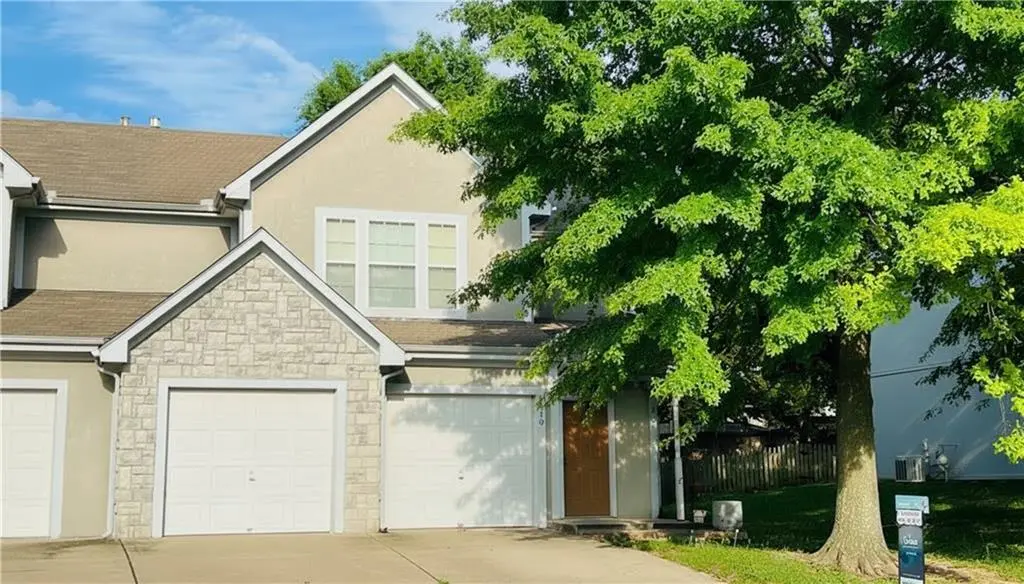
7515 Anderson St · Shawnee, KS
Flood risk 1/10 · Minimal
- FEMA flood zone
- X (unshaded)
- Chance of flooding over 30 yrs
- 0.0%
- Est. flood insurance / yr
- $507 – $1,088
Fire risk 4/10 · Minor
- Est. fire insurance / yr
- $1,154 – $2,142
Heat risk 4/10 · Minor
- Hot days now (above 107°F)
- 7 days/yr
- Hot days in 30 yrs
- 17 days/yr
Wind risk 2/10 · Minimal
- Chance of severe wind over 30 yrs
- —
Air-quality risk 2/10 · Minimal
- Unhealthy air days now
- 2 days/yr
- Unhealthy air days in 30 yrs
- 2 days/yr
Risk factors via First Street. Map © Google.
Why this score? — see what drove the D grade
The composite is a weighted blend of 9 inputs, each scored 0–100. Each bar is that input's sub-score; the figure is the points it added to the 100-point composite (weight × sub-score).
- Cash flow +11.5/30.0
- ARV discount +9.8/15.0
- Schools +4.8/10.0
- Livability +4.4/5.0
- DSCR +3.4/10.0
- 1% rule +3.0/10.0
- Rent growth +2.5/5.0
- Condition / age +2.5/5.0
- Appreciation +0.0/10.0
$339,950
🖨 Deal sheet 📄 Offer letter ✓ Due diligence
Listing remarks MLS
Over 1700 sq. ft. of living space. 3 Bedrooms, 2 1/2 Baths, 2 car garage, G E appliances (including Washer, Dryer, Refrigerator w/ icemaker), Soaker Tub & 4ft. Shower in Master Bath, Enameled Trim. Immediate occupancy. TOUR
Key facts
- $13 HOA
- 2 garage spots
- Built 2002
Property features AI
Finance
- HOA & community: Suttle Downs Home Association; Annual HOA fee of $150; Community play area
Exterior
- Parking: Attached garage with garage door opener and front-facing garage; 2 garage spaces
- Security: Smoke detector(s)
- Utilities: Public water
- Home design: Residential townhouse; Attached property; 2 stories; Above-grade finished living area (public records)
- Construction: Board & batten siding; Composition roof; Built approximately 21–30 years ago
- Exterior features: Patio; Paved road with public maintenance; Not in a flood plain
Interior
- Kitchen: Refrigerator; Electric range; Microwave; Dishwasher; Disposal; Exhaust fan; Solid surface countertops
- Bedrooms: 3 bedrooms (all on the second floor); Primary suite with separate shower and tub and walk-in closet
- Flooring: Luxury vinyl; Tile
- Bathrooms: 2 full bathrooms; 1 half bathroom
- Heating & cooling: Natural gas heating; Electric cooling
- Interior features: Thermal windows; Kit/Dining combo; Slab foundation; Gas zero-clearance fireplace (1)
- Laundry & utility: Laundry on main level
Neighborhood map
What this means for you Summary
Snapshot
- This is a 3-bed/2.5-bath townhouse listed at $340k.
Deal economics
- At list price, monthly cash flow is $-113 ($-1k/yr) — negative.
- To cash-flow at today's rent, offer at most $320k (5.9% below list).
- To meet the 1% rule (rent ≥ 1% of price), the offer needs to be $273k (19.7% below list).
- Recommended offer: $273k (19.7% below list) — sets the bar for 1% rule.
- Cap rate 5.9% vs local median 3.2% in Shawnee — top-decile yield for the area; either an underpriced asset or a hidden risk that comps aren't pricing in. Stress-test before assuming the spread holds.
Location & tenants
- Location reads 87/100 on livability (#2 in KS, #276 nationally) — a professional / high-income tenant draw. Strengths: commute A+, employment A+, housing A+.
- De Soto (suburban): math 49% / reading 53% proficiency, ranked #3 of 169 in KS (top 2%) — acceptable for families but not a draw, mixed tenant base, ~2y average lease; only 10% free/reduced lunch — higher-income household profile.
- Zoned schools: Horizon Elementary (math 62% / reading 72%, grade B+, #31 of 684 statewide, top 6%, 372 students, 13% FRL); Mill Valley High School (math 41% / reading 40%, grade F, #19 of 327 statewide, top 6%, 1,355 students, 7% FRL) — zoned schools at 10% FRL track the district average.
- Market conditions: 103 active listings in the ZIP; 2 comparable units currently listed for rent nearby; high-income renter base; 2,969 units permitted in Johnson County in 2024 (1,066 in 5+ unit buildings).
Forward outlook
- Local home prices are declining (-3.0%/yr); year-one equity from $2k of loan paydown is wiped out by about $10k of value loss. Plan a longer hold.
- Johnson County population projected at +27% by 2050 — long-run rental-demand tailwind backs the buy-and-hold thesis.
Negotiation context
- Only 11 days on market — expect competitive offers; lowballing is unlikely to land.
Questions for the listing agent
- What do current leases actually rent for vs. the listed asking? Can we see a recent rent roll and the last 12 months of T-12 income?
- What does the HOA fee cover, when was the last increase, and are there any pending special assessments or reserve-fund shortfalls?
- Is there a deadline driving the sale (1031 exchange, divorce, estate, relocation)? That informs how much negotiation room exists.
- Schools are B-rated — typically a magnet for longer-tenancy family renters. What's the average tenant stay here, and is there a school-zone premium baked into asking?
- The area grade is low — what's the realistic commute time and amenity access for the typical tenant pool here? Any planned neighborhood developments (good or bad) we should know about?
- What's the average days-on-market for RENTAL listings here right now (not sales)? A rising rental-DOM trend means longer vacancies and softer asking-rent achievability than the comps imply.
- What's the recent tenant-quality profile in this submarket — average credit score on applications, eviction rate, late-payment / NSF rate, and stable-employment percentage? A property-management company in the area should have these aggregated.
- How much new for-sale + rental construction is in the pipeline within 1–3 miles? Heavy new supply typically softens prices + rents 12–24 months out; constrained supply supports both.
Investment metrics
- 1% rule
- 0.80% ✗
- Cap rate
- 5.90%
- Cash-on-cash
- -1.42%
- DSCR
- 0.94
- GRM
- 10.4
CMA / ARV
- ARV (on-the-fly)
- $358,146
- Comps found
- 12
Show comp detail 12 sales within ~0.75 mi
| Address | Dist | Beds/Ba | Sqft | Sold | Price | $/sf | Match |
|---|---|---|---|---|---|---|---|
| 7529 Mccoy St | 0.08mi | 3/2.5 | 1,758 (-1%) | 3mo | $349,000 | $199 | 93 |
| 7537 Mccoy St | 0.09mi | 3/2.0 | 1,855 (+5%) | 0mo | $345,000 | $186 | 86 |
| 7512 Mccoy St | 0.03mi | 3/2.5 | 1,662 (-6%) | 7mo | $335,000 | $202 | 82 |
| 22404 W 76th St | 0.16mi | 3/2.5 | 1,820 (+3%) | 7mo | $399,900 | $220 | 82 |
| 22402 W 76th St | 0.17mi | 3/2.5 | 1,655 (-7%) | 1mo | $399,000 | $241 | 80 |
| 22707 W 73rd St St | 0.29mi | 2/2.5 (-1) | 1,747 (-2%) | 3mo | $315,000 | $180 | 76 |
| 7342 Mccoy St | 0.21mi | 3/2.5 | 1,660 (-6%) | 6mo | $315,000 | $190 | 75 |
| 7620 Mccoy St | 0.15mi | 3/2.0 | 1,607 (-9%) | 8mo | $315,000 | $196 | 69 |
| 22705 W 72nd Ter | 0.35mi | 3/2.5 | 1,928 (+9%) | 3mo | $299,000 | $155 | 66 |
| 7135 Meadow View St | 0.60mi | 3/2.0 | 1,736 (-2%) | 3mo | $410,000 | $236 | 64 |
| 9313 Aminda St | 0.42mi | 3/2.5 | 2,012 (+14%) | 1mo | $639,000 | $318 | 57 |
| 22309 W 76th St | 0.22mi | 4/3.0 (+1) | 2,021 (+14%) | 8mo | $438,200 | $217 | 52 |
Match score weights: distance 35% · size 25% · config 20% · recency 20%. Top-matched comps best support the ARV.
Projected returns pro-forma
-3.0% appreciation · 3.0% rent growth · sell at horizon
- IRR
- -18.6%
- Equity multiple
- 0.35×
- Total profit
- $-62,266
- Equity at exit
- $50,688
- IRR
- -11.1%
- Equity multiple
- 0.33×
- Total profit
- $-63,487
- Equity at exit
- $29,393
Cash invested: $95,186 (down + closing). Projections, not guarantees.
Landlord ↔ Tenant lean methodology
- Overall (STATE)
- 83 Strongly Landlord-Friendly
- State Kansas
- 83 Strongly Landlord-Friendly · R+10
- County
- — inherits STATE
- City
- — inherits STATE
ZIP-level market 66227
- Home prices YoY
- -25.7%
- Active inventory
- 103
- Price-to-rent
- 10.4×
Monthly cashflow live
- Estimated rent
- $2,730 medium interval (Pro) →
- Mortgage (P&I)
- −$1,783
- Tax from tax record
- −$332 /mo · $3,979/yr
- Insurance
- −$142
- HOA
- −$13
- Vacancy / Maint / Mgmt
- −$573
- Net cashflow
- $-113
Break-even live
UW: 25.0% down · 7.5% · 30yr · 1.5% tax · 5.0% vac · 8.0% maint · 8.0% mgmt
Financing live
Cash to close
- Down payment
- $84,988
- Closing costs
- $10,198
- Reserves months
- —
- Total cash needed
- —
Loan-product check · same deal, 3 products live
Conventional
25% down · 7.5% · 30yr
- Down + closing
- —
- Monthly P&I
- —
- Monthly cashflow
- —
- DSCR
- —
- Eligible?
- —
Personal DTI + credit; lowest rate.
DSCR
20% down · 8.5% · 30yr
- Down + closing
- —
- Monthly P&I
- —
- Monthly cashflow
- —
- DSCR
- —
- Eligible?
- —
No personal income docs; deal must DSCR.
Hard money
10% down · 12.0% · 12mo
- Down + closing
- —
- Monthly P&I
- —
- Monthly cashflow
- —
- DSCR
- —
- Eligible?
- —
Short-term bridge; refi at stabilization.
Rent comps 2 comps
| Address | Beds | Baths | Sqft | Rent | $/sqft | DOM | Units | Dist |
|---|---|---|---|---|---|---|---|---|
| 22907 W 72nd Ter Shawnee, KS | 4.0 | 4.0 | 2200 | $2,695 | $1.23 | 23d | 1 | 0.40mi |
| 6522 Noble St Shawnee, KS | 3.0–4.0 | 2.5 | 1689 | $2,200 | $1.30 | 1d | 1 | 1.40mi |
HOA detail
- Monthly dues
- $13 · $156/yr
Listing history 12 events
-
2026-06-18days on market $339,950 Active 11 DOM
-
2026-06-17days on market $339,950 Active 10 DOM
-
2026-06-16days on market $339,950 Active 9 DOM
-
2026-06-15days on market $339,950 Active 8 DOM
-
2026-06-13days on market $339,950 Active 6 DOM
-
2026-06-13days on market $339,950 Active 5 DOM
-
2026-06-09days on market $339,950 Active 2 DOM
-
2026-06-08statusdays on market $339,950 Active 1 DOM
-
2026-06-07days on market $339,950 Coming Soon 11 DOM
-
2026-06-03days on market $339,950 Coming Soon 7 DOM
-
2026-06-02remarks 245-char remark
-
2026-06-02$339,950 Coming Soon 6 DOM
ⓘ Source: listings_history table (triggers on properties + properties_extension) + one-shot
backfill from property_details.listing_events for pre-trigger history.
Tax reassessment forecast KS · Resets to sale price
- Current annual tax
- $3,979 · $332/mo
- Projected year-2 tax
- $4,793 · $399/mo
- Expected delta
- +$814/yr (+$68/mo · 20.5%)
ⓘ Screening estimate from a state-policy table — verify with the county assessor before closing.
Climate risk First Street
- Flood 1/10 Low FEMA zone X (unshaded) · 0% chance over 30 yrs
- Wildfire 4/10 Moderate
- Heat 4/10 Moderate 7 d/yr ≥107°F today · 17 d/yr by 30 yrs out
- Wind 2/10 Low
- Air quality 2/10 Low 2 unhealthy d/yr today · 2 by 30 yrs out
Nearby sold comps map
Loading sold comps map…
Walkable amenities ~0.75 mi
Loading nearby amenities…
Taxation est. · year 1
- Rental income
- $32,755
- − Mortgage interest
- −$19,042
- − Property taxes
- −$3,979
- − Insurance
- −$1,700
- − Repairs & maintenance
- −$2,620
- − Management
- −$2,620
- − HOA
- −$156
- − Depreciation
- −$9,889
- Taxable loss
- −$7,253
- Est. tax savings @ 24.0%
- +$1,741
- After-tax cash flow
- $389/yr
For passive investors: Depreciation is non-cash, so a rental often shows a tax loss while cash-flowing — sheltering income. Rental losses are passive: they offset passive income freely, and up to $25,000/yr can offset ordinary (W-2) income if you actively participate and your MAGI is under $100k (phasing out to $0 by $150k); unused losses carry forward. On sale, claimed depreciation is recaptured at up to 25%, and gains may owe capital-gains tax (a 1031 exchange can defer both). Figures are a year-1 estimate at your 24.0% rate — not tax advice; consult a CPA.
Schools (NCES district)
- District
- De Soto
- NCES district ID
- 2005490
- Math proficiency
- 49% ▼ -1.00%
- Reading proficiency
- 53% ▼ -1.00%
- Median HH income
- $96,361
- Composite
- 48.04/100
- National rank
- #2192
- State rank
- #3 of 169 in KS
Livability — Shawnee
- Score
- 87/100
- State rank
- #2
- US rank
- #276
Category grades
Schools grade is shown separately in the Schools card above.
Census & demographics
- Census place
- Shawnee, KS
- County
- Johnson County · 574,662 people
- City population
- 60,541
- Metro
- Kansas City, MO-KS
- Population (ZIP)
- 9,595
- Household income
- $139,883
- Rent vs Own
- Severe rent burden
- 14.0
Population outlook (Johnson County) Hauer SSP2
- Today (2025)
- 663,396 people
- By 2030
- 702,585 · +5.9%
- By 2040
- 775,386 · +16.9%
- By 2050
- 841,772 · +26.9%
- By 2075
- 994,137 · +49.9%
- By 2100
- 1,073,036 · +61.7%
Race, ethnicity, and origin ACS 2023
- Neighborhood character
- Predominantly White (85%)
- Race & ethnicity
- White 85% Two or more races 6% Black 5% Hispanic / Latino 4% Asian 2%
- Common ancestry
- Romanian 4% English 4% Italian 3%
- Foreign-born
- 4% · Canada, China
- Languages at home
- 94% English-only · Spanish 4% German/W. Germanic 1% Tagalog/Filipino 1%
Political lean MEDSL · Johnson
- 2024 margin
- Lean D (+8.5) · D 53.4% · R 44.9% · Other 1.8%
- 2008→2024 swing
- +17.5pp toward D · 2008: -9.0pp · 2024: 8.5pp
- All cycles
- 2024: D+8.5 2020: D+8.2 2016: R+2.7 2012: R+17.8 2008: R+9.0
Not yet ingested
- Civics
- —
Market trends
- HPI YoY
- ▼ -87.02%
- Current HPI
- 251.8801
- Rent YoY
- —
- Metro
- Kansas City, MO-KS
- State GDP YoY
- —
- F500 in state
- 0
Price history
+139.5% since first listed4 events — show timeline
- 2026-05-28 Coming Soon $339,950 Heartland MLS as Distributed by MLS Grid
- 2003-04-23 Sold (Public Records) — Public Records
- 2003-04-22 Sold (MLS) — Heartland MLS as Distributed by MLS Grid
- 2002-06-03 Listed $141,950 Heartland MLS as Distributed by MLS Grid
Property tax history
+4.5%/yrLatest (2025): $3,979 · +18.9% YoY. Source: county tax records.
Cash-flow waterfall
monthlySold comps — $/sqft
last 12 mo · ≤1 miLoading sold comps…