 7-Plex
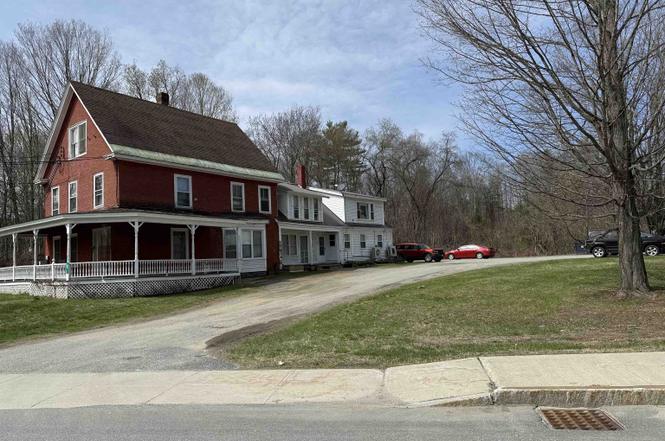
65 Giddings St · North Springfield, VT
Flood risk 5/10 · Moderate
- FEMA flood zone
- X (unshaded)
- Chance of flooding over 30 yrs
- 0.47%
- Est. flood insurance / yr
- $507 – $1,088
Fire risk 1/10 · Minimal
- Est. fire insurance / yr
- $480 – $892
Heat risk 3/10 · Minor
- Hot days now (above 93°F)
- 7 days/yr
- Hot days in 30 yrs
- 17 days/yr
Wind risk 3/10 · Minor
- Chance of severe wind over 30 yrs
- 6.0%
Air-quality risk 1/10 · Minimal
- Unhealthy air days now
- 0 days/yr
- Unhealthy air days in 30 yrs
- 0 days/yr
Risk factors via First Street. Map © Google.
Why this score? — see what drove the B+ grade
The composite is a weighted blend of 9 inputs, each scored 0–100. Each bar is that input's sub-score; the figure is the points it added to the 100-point composite (weight × sub-score).
- Cash flow +30.0/30.0
- DSCR +10.0/10.0
- 1% rule +7.5/10.0
- ARV discount +7.5/15.0
- Appreciation +7.3/10.0
- Schools +5.0/10.0
- Livability +3.3/5.0
- Rent growth +2.5/5.0
- Condition / age +2.5/5.0
$789,000
🖨 Deal sheet 📄 Offer letter ✓ Due diligence
Multi-family units
County records classify this as Multi-Family (5+ Unit). Listing-text estimate: 7 units. confirmed
5+ unit building — per-unit beds/baths from public records are typically unavailable; the breakdown below (if shown) is an estimate from the listing text.
Listing remarks MLS
A good investment property and priced to sell! Good location. More than ample parking for tenants and guests. Additional barn building for storage. Sufficient land for gardens. Short drive to downtown Springfield.
Key facts
- Fully rented multi
- 7 unit property
- 1.2 acre lot
Tags
Property features AI
Exterior
- Parking: Common/shared driveway
- Utilities: Public water; Public sewer; Electric service with circuit breakers; Gas supplied by LP/bottle; No internet service listed
- Home design: Multi-family building; Existing construction; Red exterior color
- Construction: Built in 1840; Wood frame construction with brick and wood exterior; Metal and shingle roof; Foundation information not provided
- Exterior features: Level lot; Common/shared gravel driveway; Dumpster for trash
Interior
- Bedrooms: Six 1-bedroom units; One 2-bedroom unit
- Bathrooms: Seven full bathrooms (one per unit)
- Heating & cooling: Electric heating; Hot air heating; No central cooling
- Interior features: Walkout basement with bulkhead and exterior access (no tenant access); Seven total units
Neighborhood map
What this means for you Summary
Snapshot
- This is a 6×1bd/1.0ba + 1×2bd/1.0ba units multifamily listed at $789k.
Deal economics
- At list price, monthly cash flow is $3k ($38k/yr) — positive. Per door: $447/mo.
- The deal already cash-flows at list — no discount required.
- Meets the 1% rule at list price ($10k rent vs $789k).
- Recommended offer: $742k (6.0% below list) — sets the bar for market timing.
Location & tenants
- Location reads 66/100 on livability (#46 in VT) — a middle-class / working-renter tenant base. Strengths: cost of living A+, housing A+, employment A-; Watch: crime C-, health & safety D, schools F.
- Market conditions: 5 active listings in the ZIP; 339 units permitted in Windsor County in 2024 (240 in 5+ unit buildings).
Forward outlook
- In year one you build about $42k of equity ($5k loan paydown + $37k appreciation (4.6% local appreciation)).
- Windsor County population projected at -21% by 2050 — secular population decline; favor cash flow + early exit over multi-decade hold.
- At projected returns (4.6% appreciation + 3.0% rent growth), your $221k cash investment doubles in ~3 years — after that, you're playing with house money.
- By year 2, paydown + projected appreciation supports a ~$67k cash-out refi (75% LTV) — recoverable capital for the next deal without selling this one.
Negotiation context
- It's been on market 66 days — a 6% lower offer ($742k) is reasonable based on typical stale-listing flexibility.
- 4 sale attempts since 11y ago with the ask held roughly flat each time — persistent listings suggest the price (not the market) is what's stuck; bring a comps-based counter.
- Current owner paid $133k; list at $789k implies a 493% gain — meaningful room to come down on a strong offer.
Risks & watch-outs
- Watch-outs: built in 1840 — expect roof / HVAC / electrical / plumbing capex.
- Climate carrying-cost: moderate flood risk — expect insurance premiums to compound above CPI over the hold.
Questions for the listing agent
- It's been on market 66 days. Have you received any prior offers? Is the seller open to a 6% concession, seller financing, or rate buy-down credit?
- Can we see the unit-by-unit rent roll, current vacancy, and any below-market leases? What's the average tenancy length?
- What capital expenditures (roof, boiler, parking lot, exteriors) have been made in the last 5 years, and what's planned in the next 2?
- Built in 1840 — when were the roof, HVAC, electrical panel, plumbing, and water heater last replaced?
- Why hasn't it sold? Are there any deal-killer items the seller is aware of (foundation, flood, title, zoning, code violations)?
- Is there a deadline driving the sale (1031 exchange, divorce, estate, relocation)? That informs how much negotiation room exists.
- Schools are F-rated, which usually means shorter tenancies and higher turnover. Who's the typical renter profile here, and what's been the actual vacancy rate?
- What's the average days-on-market for RENTAL listings here right now (not sales)? A rising rental-DOM trend means longer vacancies and softer asking-rent achievability than the comps imply.
- What's the recent tenant-quality profile in this submarket — average credit score on applications, eviction rate, late-payment / NSF rate, and stable-employment percentage? A property-management company in the area should have these aggregated.
- How much new apartment / multifamily construction is in the pipeline within 1–3 miles? Heavy new supply (>2% of stock underway) typically softens rents 12–24 months out; light construction supports rent growth.
Investment metrics
- 1% rule
- 1.25% ✓
- Cap rate
- 11.05%
- Cash-on-cash
- 17.01%
- DSCR
- 1.76
- GRM
- 6.7
CMA / ARV
No comps found within radius.
Projected returns pro-forma
4.63% appreciation · 3.0% rent growth · sell at horizon
- IRR
- 26.8%
- Equity multiple
- 2.65×
- Total profit
- $364,442
- Equity at exit
- $429,593
- IRR
- 26.1%
- Equity multiple
- 5.24×
- Total profit
- $936,965
- Equity at exit
- $727,320
Cash invested: $220,920 (down + closing). Projections, not guarantees.
Landlord ↔ Tenant lean methodology
- Overall (STATE)
- 41 Moderately Tenant-Leaning
- State Vermont
- 41 Moderately Tenant-Leaning · D+15
- County
- — inherits STATE
- City
- — inherits STATE
ZIP-level market 05150
- Home prices YoY
- 2.9%
- Active inventory
- 5
- Price-to-rent
- 48.7×
Monthly cashflow live
- Estimated rent
- $9,875 medium interval (Pro) →
- Mortgage (P&I)
- −$4,138
- Tax from tax record
- −$204 /mo · $2,451/yr
- Insurance
- −$329
- HOA
- −$0
- Vacancy / Maint / Mgmt
- −$2,074
- Net cashflow
- $3,131
Break-even live
7-unit breakdown (identical units grouped — click to expand)
| Units | Beds | Baths | Est. rent |
|---|---|---|---|
| 6× units | 1 | 1 | $8,100 |
| #1 | 1 | 1 | $1,350 |
| #2 | 1 | 1 | $1,350 |
| #3 | 1 | 1 | $1,350 |
| #4 | 1 | 1 | $1,350 |
| #5 | 1 | 1 | $1,350 |
| #6 | 1 | 1 | $1,350 |
| 1× unit | 2 | 1 | $1,775 |
| Total (7 units) | $9,875 | ||
UW: 25.0% down · 7.5% · 30yr · 1.5% tax · 5.0% vac · 8.0% maint · 8.0% mgmt
Financing live
Cash to close
- Down payment
- $197,250
- Closing costs
- $23,670
- Reserves months
- —
- Total cash needed
- —
Loan-product check · same deal, 3 products live
Conventional
25% down · 7.5% · 30yr
- Down + closing
- —
- Monthly P&I
- —
- Monthly cashflow
- —
- DSCR
- —
- Eligible?
- —
Personal DTI + credit; lowest rate.
DSCR
20% down · 8.5% · 30yr
- Down + closing
- —
- Monthly P&I
- —
- Monthly cashflow
- —
- DSCR
- —
- Eligible?
- —
No personal income docs; deal must DSCR.
Hard money
10% down · 12.0% · 12mo
- Down + closing
- —
- Monthly P&I
- —
- Monthly cashflow
- —
- DSCR
- —
- Eligible?
- —
Short-term bridge; refi at stabilization.
Listing history 13 events
-
2026-04-27status Pending
-
2026-03-24price $789,000
-
2026-02-20$799,000 Active
-
2022-04-07price $950
-
2019-11-26soldstatus $133,000 Closed 213-char remark
Show marketing remark (213 chars)
A good investment property and priced to sell! Good location. More than ample parking for tenants and guests. Additional barn building for storage. Sufficient land for gardens. Short drive to downtown Springfield.
-
2019-11-26soldstatus $133,000
Show marketing remark (213 chars)
A good investment property and priced to sell! Good location. More than ample parking for tenants and guests. Additional barn building for storage. Sufficient land for gardens. Short drive to downtown Springfield.
-
2019-10-04historical Active with Contract 213-char remark
Show marketing remark (213 chars)
A good investment property and priced to sell! Good location. More than ample parking for tenants and guests. Additional barn building for storage. Sufficient land for gardens. Short drive to downtown Springfield.
-
2019-08-23$175,800 Active 213-char remark
Show marketing remark (213 chars)
A good investment property and priced to sell! Good location. More than ample parking for tenants and guests. Additional barn building for storage. Sufficient land for gardens. Short drive to downtown Springfield.
-
2015-10-16soldstatus $149,900
-
2015-09-25soldstatus $149,900 Closed 72-char remark
Show marketing remark (72 chars)
GREAT LOCATION - 7 UNITS - EXCELLENT NET BEFORE DEBTLOTS OF NEW UPGRADES
-
2015-07-01historical Active with Contract 72-char remark
Show marketing remark (72 chars)
GREAT LOCATION - 7 UNITS - EXCELLENT NET BEFORE DEBTLOTS OF NEW UPGRADES
-
2015-02-24status Active 72-char remark
Show marketing remark (72 chars)
GREAT LOCATION - 7 UNITS - EXCELLENT NET BEFORE DEBTLOTS OF NEW UPGRADES
-
2015-02-03Active with Contract 72-char remark
Show marketing remark (72 chars)
GREAT LOCATION - 7 UNITS - EXCELLENT NET BEFORE DEBTLOTS OF NEW UPGRADES
ⓘ Source: listings_history table (triggers on properties + properties_extension) + one-shot
backfill from property_details.listing_events for pre-trigger history.
Tax reassessment forecast VT · Partial reset (capped growth)
- Current annual tax
- $2,451 · $204/mo
- Projected year-2 tax
- $8,721 · $727/mo
- Expected delta
- +$6,270/yr (+$522/mo · 255.8%)
ⓘ Screening estimate from a state-policy table — verify with the county assessor before closing.
Climate risk First Street
- Flood 5/10 Major FEMA zone X (unshaded) · 47% chance over 30 yrs
- Wildfire 1/10 Low
- Heat 3/10 Moderate 7 d/yr ≥93°F today · 17 d/yr by 30 yrs out
- Wind 3/10 Moderate 6% chance of damaging wind over 30 yrs
- Air quality 1/10 Low 0 unhealthy d/yr today · 0 by 30 yrs out
Nearby sold comps map
Loading sold comps map…
Walkable amenities ~0.75 mi
Loading nearby amenities…
Taxation est. · year 1
- Rental income
- $118,500
- − Mortgage interest
- −$44,196
- − Property taxes
- −$2,451
- − Insurance
- −$3,945
- − Repairs & maintenance
- −$9,480
- − Management
- −$9,480
- − Depreciation
- −$22,953
- Taxable income
- $25,995
- Est. tax owed @ 24.0%
- −$6,239
- After-tax cash flow
- $31,329/yr
For passive investors: Depreciation is non-cash, so a rental often shows a tax loss while cash-flowing — sheltering income. Rental losses are passive: they offset passive income freely, and up to $25,000/yr can offset ordinary (W-2) income if you actively participate and your MAGI is under $100k (phasing out to $0 by $150k); unused losses carry forward. On sale, claimed depreciation is recaptured at up to 25%, and gains may owe capital-gains tax (a 1031 exchange can defer both). Figures are a year-1 estimate at your 24.0% rate — not tax advice; consult a CPA.
Schools (NCES district)
No district data.
Livability — North Springfield
- Score
- 66/100
- State rank
- #46
- US rank
- #11418
Category grades
Schools grade is shown separately in the Schools card above.
Census & demographics
- Census place
- North Springfield, VT
- City population
- 418
- Population (ZIP)
- 418
Population outlook (Windsor County) Hauer SSP2
- Today (2025)
- 53,235 people
- By 2030
- 51,269 · -3.7%
- By 2040
- 46,517 · -12.6%
- By 2050
- 41,859 · -21.4%
- By 2075
- 33,298 · -37.5%
- By 2100
- 24,523 · -53.9%
Race, ethnicity, and origin ACS 2023
- Neighborhood character
- Predominantly White (100%)
- Race & ethnicity
- White 100%
- Common ancestry
- Lithuanian 6% Serbian 5%
Political lean MEDSL · Windsor
- 2024 margin
- Solid D (+35.6) · D 66.3% · R 30.7% · Other 2.9%
- 2008→2024 swing
- -4.1pp toward R · 2008: 39.7pp · 2024: 35.6pp
- All cycles
- 2024: D+35.6 2020: D+38.9 2016: D+32.1 2012: D+38.1 2008: D+39.7
Not yet ingested
- Civics
- —
Market trends
- HPI YoY
- ▲ 4.63%
- Current HPI
- 165.6781
- Rent YoY
- —
- Metro
- —
- State GDP YoY
- —
- F500 in state
- 0
Price history
+426.4% since first listed13 events — show timeline
- 2026-04-27 Pending — PrimeMLS
- 2026-03-24 Price Changed $789,000 PrimeMLS
- 2026-02-20 Listed $799,000 PrimeMLS
- 2022-04-07 Price Changed $950 RENT.
- 2019-11-26 Sold (Public Records) $133,000 Public Records
- 2019-11-26 Sold (MLS) $133,000 PrimeMLS
- 2019-10-04 Contingent — PrimeMLS
- 2019-08-23 Listed $175,800 PrimeMLS
- 2015-10-16 Sold (Public Records) $149,900 Public Records
- 2015-09-25 Sold (MLS) $149,900 PrimeMLS
- 2015-07-01 Contingent — PrimeMLS
- 2015-02-24 Relisted — PrimeMLS
- 2015-02-03 Listed — PrimeMLS
Property tax history
-11.8%/yrLatest (2024): $2,451 · +10.5% YoY. Source: county tax records.
Cash-flow waterfall
monthlySold comps — $/sqft
last 12 mo · ≤1 miLoading sold comps…