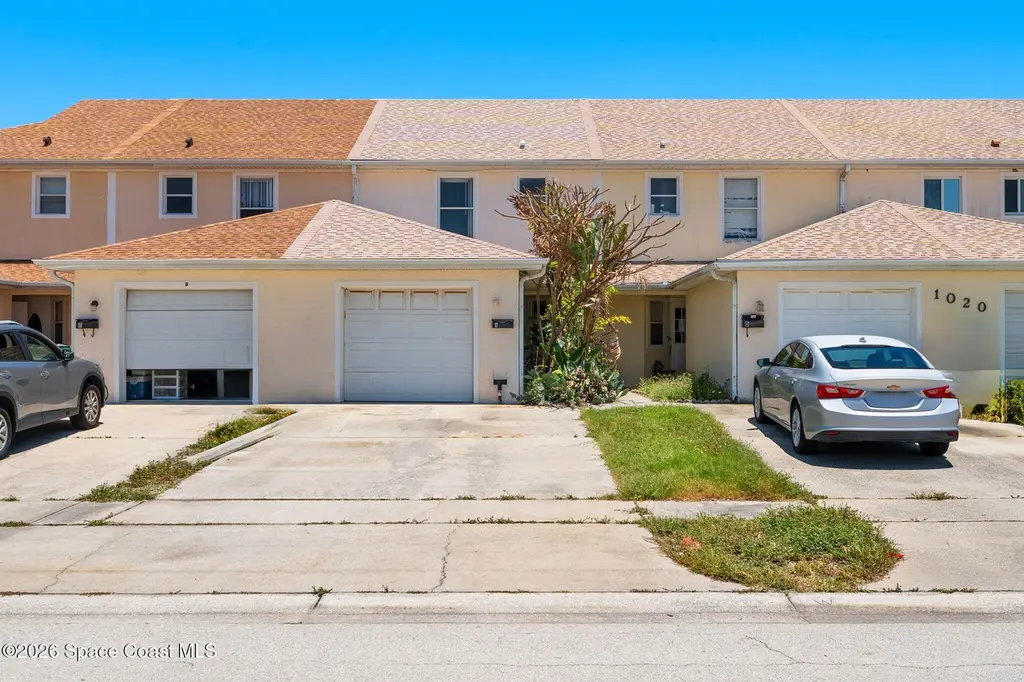
1020 Park Dr Unit C · Indian Harbour Beach, FL
Flood risk 4/10 · Minor
- FEMA flood zone
- X (unshaded)
- Chance of flooding over 30 yrs
- 0.21%
- Est. flood insurance / yr
- $507 – $1,088
Fire risk 1/10 · Minimal
- Est. fire insurance / yr
- $947 – $1,759
Heat risk 10/10 · Severe
- Hot days now (above 103°F)
- 7 days/yr
- Hot days in 30 yrs
- 23 days/yr
Wind risk 10/10 · Severe
- Chance of severe wind over 30 yrs
- 99.0%
Air-quality risk 1/10 · Minimal
- Unhealthy air days now
- 0 days/yr
- Unhealthy air days in 30 yrs
- 0 days/yr
Risk factors via First Street. Map © Google.
Why this score? — see what drove the B grade
The composite is a weighted blend of 9 inputs, each scored 0–100. Each bar is that input's sub-score; the figure is the points it added to the 100-point composite (weight × sub-score).
- Cash flow +30.0/30.0
- DSCR +10.0/10.0
- 1% rule +9.2/10.0
- ARV discount +7.5/15.0
- Schools +4.7/10.0
- Livability +4.2/5.0
- Rent growth +2.9/5.0
- Condition / age +2.5/5.0
- Appreciation +0.0/10.0
$200,000
🖨 Deal sheet 📄 Offer letter ✓ Due diligence
Listing remarks MLS
Really nice, newer 3 Bedroom, 3 Bath beachside townhome. Great location, close to schools, restaurants, and steps to the beach. Appliances included. Neutral tile thru-out, except carpet in bedrooms. New carpet and paint in unit c.
Key facts
- 2025 roof
- Close to the beach
- Solid foundation
Tags
Property features AI
Exterior
- Parking: Attached garage; 1-car garage
- Utilities: Public sewer; Cable available; Electricity connected; Sewer connected; Water connected
- Home design: Townhouse; South-facing; Entry level: 1; Attached property
- Construction: Block and concrete construction; Shingle roof; Pets allowed
- Exterior features: Wood fencing; County road frontage; Asphalt road surface; Lot described as 'Other'
Interior
- Kitchen: Dishwasher; Electric cooktop; Electric oven; Microwave; Refrigerator; Ice maker; Eat-in kitchen
- Bedrooms: 3 bedrooms
- Flooring: Carpet; Tile
- Bathrooms: 2 full bathrooms; 1 half bathroom
- Heating & cooling: Electric heating; Electric cooling
- Interior features: Ceiling fans; Eat-in kitchen; Open floorplan; Split-bedroom layout
- Laundry & utility: Washer; Dryer
Neighborhood map
What this means for you Summary
Snapshot
- This is a 3-bed/3.0-bath townhouse listed at $200k.
Deal economics
- At list price, monthly cash flow is $784 ($9k/yr) — positive.
- The deal already cash-flows at list — no discount required.
- Meets the 1% rule at list price ($3k rent vs $200k).
Location & tenants
- Location reads 84/100 on livability (#37 in FL, #722 nationally) — a professional / high-income tenant draw. Strengths: crime A+, housing A+, health & safety A+; Watch: cost of living C-, amenities F.
- Brevard (suburban): math 53% / reading 57% proficiency, ranked #19 of 73 in FL (top 26%) — acceptable for families but not a draw, mixed tenant base, ~2y average lease.
- Zoned schools: Ocean Breeze Elementary School (math 73% / reading 77%, grade A, #218 of 2,144 statewide, top 11%, 554 students, 25% FRL); Herbert C. Hoover Middle School (math 67% / reading 64%, grade A-, #95 of 571 statewide, top 17%, 506 students, 38% FRL); Satellite Senior High School (math 65% / reading 71%, grade B, #66 of 667 statewide, top 10%, 1,517 students, 20% FRL).
- Zoned-school proficiency averages 70% at this address vs 55% district-wide (+14 pts) — the actual schools serving this property are materially stronger than the Brevard average implies; a family-tenant draw the district grade alone would hide.
- Market conditions: Rents rising (+1.6%/yr); 312 active listings in the ZIP; 40 comparable units currently listed for rent nearby; rentals at typical pace (median 23d on market — plan ~3-4 weeks tenant-placement turnaround); solid renter incomes; 4,602 units permitted in Brevard County in 2024 (702 in 5+ unit buildings).
- This rent runs 34% of the median local income ($101k/yr) — at the standard rent-burdened threshold; future hikes will face affordability resistance.
Forward outlook
- Local home prices are declining (-3.0%/yr); year-one equity from $1k of loan paydown is wiped out by about $6k of value loss. Plan a longer hold.
- Brevard County population projected at +15% by 2050 — modest demand growth; plan on rents tracking national, not racing it.
- At projected returns (-3.0% appreciation + 1.6% rent growth), your $56k cash investment doubles in ~9 years — after that, you're playing with house money.
Negotiation context
- Only 2 days on market — expect competitive offers; lowballing is unlikely to land.
- 2 sale attempts since 17y ago with the ask held roughly flat each time — persistent listings suggest the price (not the market) is what's stuck; bring a comps-based counter.
- Current owner paid $118k; list at $200k implies a 69% gain — meaningful room to come down on a strong offer.
Risks & watch-outs
- Climate carrying-cost: severe wind risk, 99% chance of damaging wind over 30y; extreme-heat days projected 7→23/yr by 2055 (HVAC capex compounding) — expect insurance premiums to compound above CPI over the hold.
Questions for the listing agent
- Is there a deadline driving the sale (1031 exchange, divorce, estate, relocation)? That informs how much negotiation room exists.
- Schools are A-rated — typically a magnet for longer-tenancy family renters. What's the average tenant stay here, and is there a school-zone premium baked into asking?
- What's the average days-on-market for RENTAL listings here right now (not sales)? A rising rental-DOM trend means longer vacancies and softer asking-rent achievability than the comps imply.
- What's the recent tenant-quality profile in this submarket — average credit score on applications, eviction rate, late-payment / NSF rate, and stable-employment percentage? A property-management company in the area should have these aggregated.
- How much new for-sale + rental construction is in the pipeline within 1–3 miles? Heavy new supply typically softens prices + rents 12–24 months out; constrained supply supports both.
Investment metrics
- 1% rule
- 1.42% ✓
- Cap rate
- 10.99%
- Cash-on-cash
- 16.79%
- DSCR
- 1.75
- GRM
- 5.8
CMA / ARV
No comps found within radius.
Projected returns pro-forma
-3.0% appreciation · 1.55% rent growth · sell at horizon
- IRR
- 6.3%
- Equity multiple
- 1.24×
- Total profit
- $13,491
- Equity at exit
- $29,821
- IRR
- 14.3%
- Equity multiple
- 2.07×
- Total profit
- $60,060
- Equity at exit
- $17,292
Cash invested: $56,000 (down + closing). Projections, not guarantees.
Landlord ↔ Tenant lean methodology
- Overall (STATE)
- 87 Strongly Landlord-Friendly
- State Florida
- 87 Strongly Landlord-Friendly · R+3
- County
- — inherits STATE
- City
- — inherits STATE
ZIP-level market 32937
- Rents YoY
- 1.6%
- Active inventory
- 312
- Price-to-rent
- 5.8×
Monthly cashflow live
- Estimated rent
- $2,849 high interval (Pro) →
- Mortgage (P&I)
- −$1,049
- Tax from tax record
- −$335 /mo · $4,023/yr
- Insurance
- −$83
- HOA
- −$0
- Vacancy / Maint / Mgmt
- −$598
- Net cashflow
- $784
Break-even live
UW: 25.0% down · 7.5% · 30yr · 1.5% tax · 5.0% vac · 8.0% maint · 8.0% mgmt
Financing live
Cash to close
- Down payment
- $50,000
- Closing costs
- $6,000
- Reserves months
- —
- Total cash needed
- —
Loan-product check · same deal, 3 products live
Conventional
25% down · 7.5% · 30yr
- Down + closing
- —
- Monthly P&I
- —
- Monthly cashflow
- —
- DSCR
- —
- Eligible?
- —
Personal DTI + credit; lowest rate.
DSCR
20% down · 8.5% · 30yr
- Down + closing
- —
- Monthly P&I
- —
- Monthly cashflow
- —
- DSCR
- —
- Eligible?
- —
No personal income docs; deal must DSCR.
Hard money
10% down · 12.0% · 12mo
- Down + closing
- —
- Monthly P&I
- —
- Monthly cashflow
- —
- DSCR
- —
- Eligible?
- —
Short-term bridge; refi at stabilization.
Rent comps 40 comps
| Address | Beds | Baths | Sqft | Rent | $/sqft | DOM | Units | Dist |
|---|---|---|---|---|---|---|---|---|
| 1020 Pinetree Dr #8 Indian Harbour Beach, FL | 2.0 | 1.5 | 1180 | $1,700 | $1.44 | 23d | 1 | 0.11mi |
| 1034 Park Dr Unit 4 Indian Harbour Beach, FL | 2.0 | 1.0 | 1000 | $1,500 | $1.50 | 14d | 1 | 0.11mi |
| 1811 Highway A1A #2104 Indian Harbour Beach, FL | 3.0 | 2.0 | 1720 | $3,200 | $1.86 | 23d | 1 | 0.27mi |
| 1791 Jimmy Buffett Memorial Hwy Unit 1103 Indian Harbour Beach, FL | 3.0 | 2.0 | 1720 | $4,400 | $2.56 | 23d | 1 | 0.28mi |
| 500 Palm Springs Blvd #403 Indian Harbour Beach, FL | 2.0 | 2.0 | 1055 | $2,200 | $2.09 | 21d | 1 | 0.28mi |
| 500 Palm Springs Blvd #407 Indian Harbour Beach, FL | 2.0 | 1.5 | 1055 | $1,800 | $1.71 | 23d | 1 | 0.28mi |
| 500 Palm Springs Blvd #110 Indian Harbour Beach, FL | 2.0 | 2.0 | 1100 | $1,600 | $1.45 | 23d | 1 | 0.28mi |
| 799 Shell St Satellite Beach, FL | 3.0 | 2.5 | 1248 | $3,950 | $3.17 | 23d | 1 | 0.31mi |
| 1109 Seminole Dr Unit 1464868P Satellite Beach, FL | 4.0 | 2.0 | 1872 | $6,688 | $3.57 | 14d | 1 | 0.41mi |
| 120 E Colonial Ct #47 Indian Harbour Beach, FL | 2.0 | 1.5 | 960 | $1,700 | $1.77 | 13d | 1 | 0.48mi |
| 926 Jamestown Ave #93 Indian Harbour Beach, FL | 2.0 | 1.5 | 1088 | $1,700 | $1.56 | 23d | 1 | 0.50mi |
| 911 S Colonial Ct Unit C Indian Harbour Beach, FL | 2.0 | 1.0 | 900 | $1,600 | $1.78 | 23d | 1 | 0.54mi |
| 658 Atlantic Dr Satellite Beach, FL | 2.0 | 2.5 | 1470 | $2,200 | $1.50 | 23d | 1 | 0.58mi |
| 265 Marion St Indian Harbour Beach, FL | 4.0 | 2.0 | 1724 | $5,500 | $3.19 | 23d | 1 | 0.69mi |
| 128 Martin St Unit 1250956P Satellite Beach, FL | 3.0 | 2.0 | 1453 | $5,409 | $3.72 | 18d | 1 | 0.69mi |
| 157 Kristi Dr Indian Harbour Beach, FL | 2.0 | 2.5 | 1296 | $2,500 | $1.93 | 23d | 1 | 0.69mi |
| 1175 Bay Dr E Indian Harbour Beach, FL | 4.0 | 2.0 | 1650 | $3,700 | $2.24 | 23d | 1 | 0.70mi |
| 231 Shore Ln Indian Harbour Beach, FL | 3.0 | 2.0 | 1640 | $3,200 | $1.95 | 23d | 1 | 0.71mi |
| 39 Anchor Dr Indian Harbour Beach, FL | 2.0 | 2.0 | 1304 | $2,395 | $1.84 | 23d | 1 | 0.72mi |
| 2186 Jimmy Buffett Memorial Hwy Unit B7 Indian Harbour Beach, FL | 2.0 | 2.0 | 1188 | $1,900 | $1.60 | 14d | 1 | 0.82mi |
| 2186 Highway A1A Unit A7 Indian Harbour Beach, FL | 2.0 | 2.0 | 1002 | $1,600 | $1.60 | 21d | 1 | 0.82mi |
| 115 Hogan Rd Indian Harbour Beach, FL | 2.0 | 1.0–2.0 | 705 | $1,850 | $2.62 | 23d | 12 | 0.90mi |
| 360 Desoto Pkwy Satellite Beach, FL | 3.0 | 2.0 | 1679 | $3,200 | $1.91 | 23d | 1 | 0.94mi |
| 2225 Highway A1A #311 Indian Harbour Beach, FL | 2.0 | 2.0 | 1361 | $3,800 | $2.79 | 23d | 1 | 0.95mi |
| 2225 Highway A1A Indian Harbour Beach, FL | 2.0 | 1.0–2.0 | 1187 | $3,400 | $2.86 | 23d | 2 | 0.95mi |
| 201 Harbor City Pkwy Indian Harbour Beach, FL | 1.0–3.0 | 1.0–2.0 | 918 | $2,199 | $2.39 | 23d | 18 | 1.00mi |
| 100 Bel Aire Dr Indian Harbour Beach, FL | 4.0 | 2.0 | 1634 | $4,500 | $2.75 | 23d | 1 | 1.01mi |
| 1874 Brittany Dr Melbourne, FL | 2.0–3.0 | 1.0–2.0 | 1286 | $1,990 | $1.55 | 14d | 12 | 1.14mi |
| 1465 Jimmy Buffett Memorial Hwy Unit 506 Satellite Beach, FL | 2.0 | 2.0 | 1155 | $4,400 | $3.81 | 18d | 1 | 1.14mi |
| 1850 Charlesmont Dr #113 Indialantic, FL | 2.0 | 2.0 | 900 | $1,800 | $2.00 | 23d | 1 | 1.17mi |
| 1850 Charlesmont Dr #113 Indialantic, FL | 2.0 | 2.0 | 900 | $1,700 | $1.89 | 14d | 1 | 1.17mi |
| 1841 Island Club Dr Unit 4-72 Indialantic, FL | 2.0 | 2.0 | 900 | $3,000 | $3.33 | 23d | 1 | 1.22mi |
| 1800 Charlesmont Dr #98 Indialantic, FL | 2.0 | 2.0 | 900 | $2,200 | $2.44 | 23d | 1 | 1.23mi |
| 125 Kings Way Satellite Beach, FL | 2.0 | 2.5 | 1530 | $2,500 | $1.63 | 23d | 1 | 1.23mi |
| 159 Queens Ct Satellite Beach, FL | 2.0 | 2.0 | 1450 | $2,850 | $1.97 | 23d | 1 | 1.25mi |
| 408 Hawthorne Ct Indian Harbour Beach, FL | 3.0 | 2.0 | 1367 | $2,295 | $1.68 | 23d | 1 | 1.28mi |
| 265 Kings Way Satellite Beach, FL | 2.0 | 2.5 | 1530 | $2,395 | $1.57 | 23d | 1 | 1.29mi |
| 301 Markley Ct Unit 1545698P Indian Harbour Beach, FL | 3.0 | 2.0 | 1194 | $3,226 | $2.70 | 13d | 1 | 1.30mi |
| 145 Cinnamon Dr Melbourne, FL | 1.0–3.0 | 1.0–2.0 | 1536 | $2,079 | $1.35 | 13d | 18 | 1.32mi |
| 440 Hawthorne Ct Indian Harbour Beach, FL | 2.0 | 2.0 | 1300 | $2,299 | $1.77 | 23d | 1 | 1.37mi |
Listing history 8 events
-
2026-05-26$200,000 Active
-
2010-03-10soldstatus $118,000
-
2010-03-09soldstatus $118,000 230-char remark
Show marketing remark (230 chars)
Really nice, newer 3 Bedroom, 3 Bath beachside townhome. Great location, close to schools, restaurants, and steps to the beach. Appliances included. Neutral tile thru-out, except carpet in bedrooms. New carpet and paint in unit c.
-
2009-10-27soldstatus $548,000
-
2009-10-02$119,900 230-char remark
Show marketing remark (230 chars)
Really nice, newer 3 Bedroom, 3 Bath beachside townhome. Great location, close to schools, restaurants, and steps to the beach. Appliances included. Neutral tile thru-out, except carpet in bedrooms. New carpet and paint in unit c.
-
2005-05-19soldstatus $200,000
-
2003-04-17soldstatus $745,000
-
2001-01-05soldstatus $95,200
ⓘ Source: listings_history table (triggers on properties + properties_extension) + one-shot
backfill from property_details.listing_events for pre-trigger history.
Tax reassessment forecast FL · Resets to sale price
- Current annual tax
- $4,023 · $335/mo
- Projected year-2 tax
- $4,023 · $335/mo
- Expected delta
- $0/yr ($0/mo · 0.0%)
ⓘ Screening estimate from a state-policy table — verify with the county assessor before closing.
Climate risk First Street
- Flood 4/10 Moderate FEMA zone X (unshaded) · 21% chance over 30 yrs
- Wildfire 1/10 Low
- Heat 10/10 Extreme 7 d/yr ≥103°F today · 23 d/yr by 30 yrs out
- Wind 10/10 Extreme 99% chance of damaging wind over 30 yrs
- Air quality 1/10 Low 0 unhealthy d/yr today · 0 by 30 yrs out
Nearby sold comps map
Loading sold comps map…
Walkable amenities ~0.75 mi
Loading nearby amenities…
Taxation est. · year 1
- Rental income
- $34,191
- − Mortgage interest
- −$11,203
- − Property taxes
- −$4,023
- − Insurance
- −$1,000
- − Repairs & maintenance
- −$2,735
- − Management
- −$2,735
- − Depreciation
- −$5,818
- Taxable income
- $6,676
- Est. tax owed @ 24.0%
- −$1,602
- After-tax cash flow
- $7,800/yr
For passive investors: Depreciation is non-cash, so a rental often shows a tax loss while cash-flowing — sheltering income. Rental losses are passive: they offset passive income freely, and up to $25,000/yr can offset ordinary (W-2) income if you actively participate and your MAGI is under $100k (phasing out to $0 by $150k); unused losses carry forward. On sale, claimed depreciation is recaptured at up to 25%, and gains may owe capital-gains tax (a 1031 exchange can defer both). Figures are a year-1 estimate at your 24.0% rate — not tax advice; consult a CPA.
Schools (NCES district)
- District
- Brevard
- NCES district ID
- 1200150
- Math proficiency
- 53% ▼ -9.00%
- Reading proficiency
- 57% ▼ -4.00%
- Median HH income
- $49,426
- Composite
- 46.86/100
- National rank
- #2370
- State rank
- #19 of 73 in FL
Livability — Indian Harbour Beach
- Score
- 84/100
- State rank
- #37
- US rank
- #722
Category grades
Schools grade is shown separately in the Schools card above.
Census & demographics
- Census place
- Indian Harbour Beach, FL
- County
- Brevard County · 602,871 people
- Metro
- Palm Bay-Melbourne-Titusville, FL
- Population (ZIP)
- 27,836
- Household income
- $101,184
- Rent vs Own
- Severe rent burden
- 534.0
Population outlook (Brevard County) Hauer SSP2
- Today (2025)
- 623,254 people
- By 2030
- 648,420 · +4.0%
- By 2040
- 690,009 · +10.7%
- By 2050
- 715,669 · +14.8%
- By 2075
- 775,744 · +24.5%
- By 2100
- 776,687 · +24.6%
Race, ethnicity, and origin ACS 2023
- Neighborhood character
- Predominantly White (82%)
- Race & ethnicity
- White 82% Hispanic / Latino 9% Two or more races 7% Asian 2% Black 1%
- Hispanic origin (detail)
- Mexican 1% Puerto Rican 2%
- Common ancestry
- Romanian 3% Lithuanian 3% Italian 2%
- Foreign-born
- 4% · Canada
- Languages at home
- 95% English-only · Spanish 3% Other Indo-European 1%
Political lean MEDSL · Brevard
- 2024 margin
- Strong R (+20.8) · D 39.1% · R 59.9% · Other 1.0%
- 2008→2024 swing
- -10.4pp toward R · 2008: -10.4pp · 2024: -20.8pp
- All cycles
- 2024: R+20.8 2020: R+16.4 2016: R+19.8 2012: R+12.7 2008: R+10.4
Not yet ingested
- Civics
- —
Market trends
- HPI YoY
- ▼ -336.76%
- Current HPI
- 361.3801
- Rent YoY
- ▲ 1.55%
- Metro
- Palm Bay-Melbourne-Titusville, FL
- State GDP YoY
- ▲ 3.28%
- F500 in state
- 36
Industry mix (Fortune 500 HQ in FL)
| Industry | F500 HQs | Revenue |
|---|---|---|
| Industrial Technology | 2 | $29B |
|
||
| Insurance | 2 | $17B |
|
||
| Retail | 1 | $60B |
|
||
| Technology Distribution | 1 | $58B |
|
||
| Homebuilding | 1 | $35B |
|
||
| Technology Manufacturing | 1 | $35B |
|
||
Price history
+110.1% since first listed8 events — show timeline
- 2026-05-26 Listed $200,000 SCMLS
- 2010-03-10 Sold (Public Records) $118,000 Public Records
- 2010-03-09 Sold (MLS) $118,000 SCMLS
- 2009-10-27 Sold (Public Records) $548,000 Public Records
- 2009-10-02 Listed $119,900 SCMLS
- 2005-05-19 Sold (Public Records) $200,000 Public Records
- 2003-04-17 Sold (Public Records) $745,000 Public Records
- 2001-01-05 Sold (Public Records) $95,200 Public Records
Property tax history
+7.4%/yrLatest (2025): $4,023 · +3.3% YoY. Source: county tax records.
Cash-flow waterfall
monthlySold comps — $/sqft
last 12 mo · ≤1 miLoading sold comps…