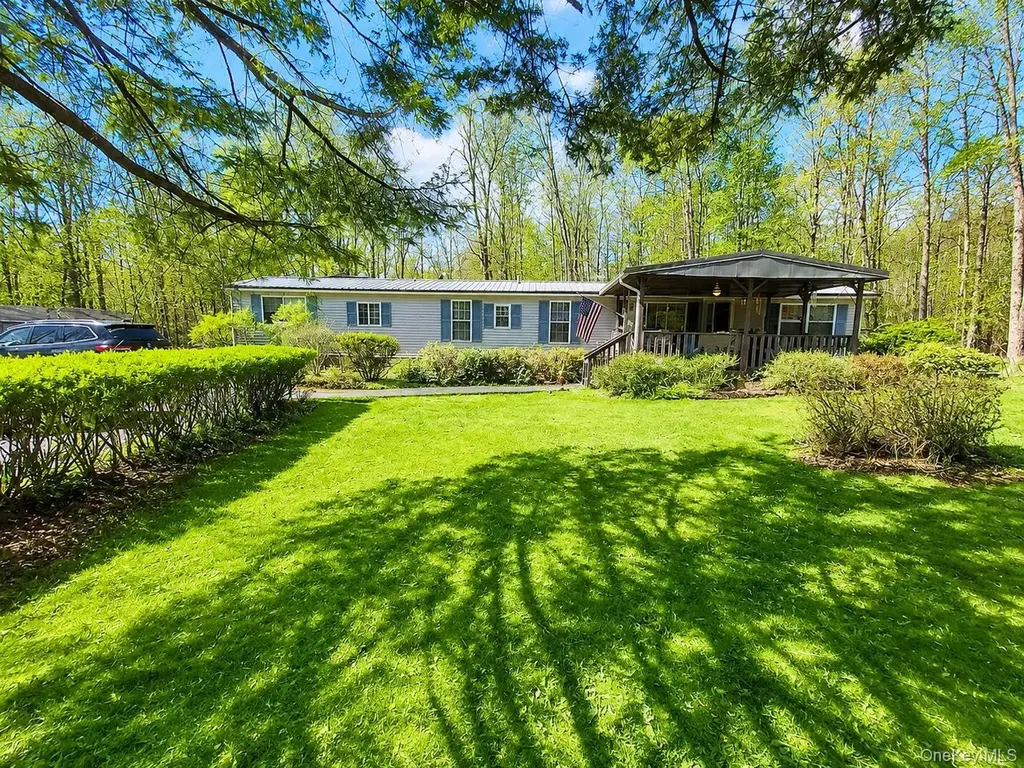
702 Budd Rd · Woodbourne, NY
Flood risk 1/10 · Minimal
- FEMA flood zone
- X (unshaded)
- Chance of flooding over 30 yrs
- 0.0%
- Est. flood insurance / yr
- $507 – $1,088
Fire risk 3/10 · Minor
- Est. fire insurance / yr
- $691 – $1,283
Heat risk 2/10 · Minimal
- Hot days now (above 94°F)
- 7 days/yr
- Hot days in 30 yrs
- 15 days/yr
Wind risk 3/10 · Minor
- Chance of severe wind over 30 yrs
- 4.0%
Air-quality risk 2/10 · Minimal
- Unhealthy air days now
- 0 days/yr
- Unhealthy air days in 30 yrs
- 1 days/yr
Risk factors via First Street. Map © Google.
Why this score? — see what drove the C- grade
The composite is a weighted blend of 9 inputs, each scored 0–100. Each bar is that input's sub-score; the figure is the points it added to the 100-point composite (weight × sub-score).
- ARV discount +15.0/15.0
- Cash flow +11.6/30.0
- Appreciation +10.0/10.0
- 1% rule +3.4/10.0
- DSCR +3.4/10.0
- Rent growth +2.5/5.0
- Livability +2.5/5.0
- Condition / age +2.5/5.0
- Schools +2.4/10.0
$209,000
🖨 Deal sheet (PDF) 📄 Offer letter ✓ Due diligence
Listing remarks
Private Woodland Retreat: Meticulously Maintained Home on 3 Acres! Escape to your own private sanctuary with this beautifully updated and expanded home, perfectly situated on 3 sprawling acres. Combining the ease of single-level living with significant custom additions, this residence offers a much more spacious and versatile layout than your standard floor plan. Home Highlights & Recent Upgrades This property has been lovingly cared for, featuring key mechanical and structural updates for total peace of mind: Durability: New metal roof and updated windows throughout. Efficiency: Brand-new furnace and updated skirting. Comfort: A meticulously updated main bathroom featuring an oversiz
Key facts
- Covered front porch
- Spacious back deck
- 3 acre lot
Tags
Property features AI
Exterior
- Parking: Driveway
- Utilities: Central Hudson electric service; Septic tank; Water available and connected; Sewer available and connected; Electricity available and connected; Cable available; Trash collection (private and public options)
- Home design: Manufactured house; Single-level entry
- Construction: Manufactured construction
- Exterior features: Double wide home; Manufactured on land; No waterfront
Interior
- Kitchen: Gas cooktop; Oven; Microwave; Dishwasher; Refrigerator; Stainless steel appliances; Pantry
- Bedrooms: Includes a bedroom on the first floor
- Flooring: Carpet; Vinyl
- Bathrooms: 2 full bathrooms
- Heating & cooling: Forced air heating (propane); Wall/window air conditioning units
- Interior features: First-floor bedroom; First-floor full bathroom; Built-in features; High-speed internet available; Pantry; Covered porch; Deck
- Laundry & utility: Laundry room with washer and electric dryer hookups; Electric water heater
Neighborhood map
What this means for you Summary
Snapshot
- This is a 3-bed/2.0-bath manufactured listed at $209k.
Deal economics
- At list price, monthly cash flow is $-67 ($-800/yr) — negative.
- To cash-flow at today's rent, offer at most $197k (5.6% below list).
- To meet the 1% rule (rent ≥ 1% of price), the offer needs to be $175k (16.5% below list).
- Recommended offer: $175k (16.5% below list) — sets the bar for 1% rule.
Location & tenants
- Location reads: area grade C — affects rentability + tenant quality, not the cash-flow math above.
- Fallsburg Central School District (town): math 29% / reading 27% proficiency, ranked #583 of 590 in NY (top 99%) — low school quality limits family demand, transient renter base, plan for 1-2y turnover.
- Zoned schools: Benjamin Cosor Elementary School (math 8% / reading 22%, grade F, #2,024 of 2,108 statewide, top 97%, 810 students, 72% FRL); Fallsburg Junior Senior High School (math 52% / reading 32%, grade F, #1,046 of 1,100 statewide, top 96%, 684 students, 64% FRL).
- Market conditions: 28 active listings in the ZIP; 739 units permitted in Sullivan County in 2024 (5 in 5+ unit buildings).
Forward outlook
- In year one you build about $22k of equity ($1k loan paydown + $21k appreciation (10.0% local appreciation)).
- Sullivan County population projected at -24% by 2050 — secular population decline; favor cash flow + early exit over multi-decade hold.
- At projected returns (10.0% appreciation + 3.0% rent growth), your $59k cash investment doubles in ~3 years — after that, you're playing with house money.
- By year 2, paydown + projected appreciation supports a ~$36k cash-out refi (75% LTV) — recoverable capital for the next deal without selling this one.
Negotiation context
- It's been on market 32 days — a 3% lower offer ($203k) is reasonable based on typical stale-listing flexibility.
- 2 sale attempts with the ask held roughly flat each time — persistent listings suggest the price (not the market) is what's stuck; bring a comps-based counter.
Questions for the listing agent
- What do current leases actually rent for vs. the listed asking? Can we see a recent rent roll and the last 12 months of T-12 income?
- It's been on market 32 days. Have you received any prior offers? Is the seller open to a 16% concession, seller financing, or rate buy-down credit?
- Is there a deadline driving the sale (1031 exchange, divorce, estate, relocation)? That informs how much negotiation room exists.
- What's the average days-on-market for RENTAL listings here right now (not sales)? A rising rental-DOM trend means longer vacancies and softer asking-rent achievability than the comps imply.
- What's the recent tenant-quality profile in this submarket — average credit score on applications, eviction rate, late-payment / NSF rate, and stable-employment percentage? A property-management company in the area should have these aggregated.
- How much new for-sale + rental construction is in the pipeline within 1–3 miles? Heavy new supply typically softens prices + rents 12–24 months out; constrained supply supports both.
Investment metrics
- 1% rule
- 0.84% ✗
- Cap rate
- 5.91%
- Cash-on-cash
- -1.37%
- DSCR
- 0.94
- GRM
- 10.0
CMA / ARV
- ARV (median comp)
- $265,000
- List price
- $209,000
- Delta
- -21.13%
- Verdict
- UNDERPRICED
- Comps
- 1 within 2.0 mi
Projected returns pro-forma
10.0% appreciation · 3.0% rent growth · sell at horizon
- IRR
- 23.3%
- Equity multiple
- 2.87×
- Total profit
- $109,608
- Equity at exit
- $188,284
- IRR
- 20.8%
- Equity multiple
- 6.57×
- Total profit
- $326,170
- Equity at exit
- $406,041
Cash invested: $58,520 (down + closing). Projections, not guarantees.
Landlord ↔ Tenant lean methodology
- Overall (STATE)
- 15 Strongly Tenant-Friendly
- State New York
- 15 Strongly Tenant-Friendly · D+10
- County
- — inherits STATE
- City
- — inherits STATE
ZIP-level market 12788
- Home prices YoY
- 2.4%
- Active inventory
- 28
- Price-to-rent
- 10.0×
Monthly cashflow live
- Estimated rent
- $1,746 medium interval (Pro) →
- Mortgage (P&I)
- −$1,096
- Tax from tax record
- −$263 /mo · $3,151/yr
- Insurance
- −$87
- HOA
- −$0
- Vacancy / Maint / Mgmt
- −$367
- Net cashflow
- $-67
Break-even live
Sensitivity live
| Price | -10% $52 | -5% $-8 | +0% $-67 | +5% $-126 | +10% $-185 |
|---|---|---|---|---|---|
| Rent | -10% $-205 | -5% $-136 | +0% $-67 | +5% $2 | +10% $71 |
| Rate | -1.0pp $39 | -0.5pp $-14 | base $-67 | +0.5pp $-121 | +1.0pp $-176 |
UW: 25.0% down · 7.5% · 30yr · 1.5% tax · 5.0% vac · 8.0% maint · 8.0% mgmt
Financing live
Cash to close
- Down payment
- $52,250
- Closing costs
- $6,270
- Reserves months
- —
- Total cash needed
- —
Loan-product check · same deal, 3 products live
Conventional
25% down · 7.5% · 30yr
- Down + closing
- —
- Monthly P&I
- —
- Monthly cashflow
- —
- DSCR
- —
- Eligible?
- —
Personal DTI + credit; lowest rate.
DSCR
20% down · 8.5% · 30yr
- Down + closing
- —
- Monthly P&I
- —
- Monthly cashflow
- —
- DSCR
- —
- Eligible?
- —
No personal income docs; deal must DSCR.
Hard money
10% down · 12.0% · 12mo
- Down + closing
- —
- Monthly P&I
- —
- Monthly cashflow
- —
- DSCR
- —
- Eligible?
- —
Short-term bridge; refi at stabilization.
Listing history 17 events
-
2026-06-15status $209,000 Pending 32 DOM
-
2026-06-15days on market $209,000 Active 32 DOM
-
2026-06-14days on market $209,000 Active 30 DOM
-
2026-06-13days on market $209,000 Active 29 DOM
-
2026-06-10days on market $209,000 Active 27 DOM
-
2026-06-09days on market $209,000 Active 26 DOM
-
2026-06-08days on market $209,000 Active 25 DOM
-
2026-06-07days on market $209,000 Active 24 DOM
-
2026-06-03days on market $209,000 Active 20 DOM
-
2026-06-02days on market $209,000 Active 19 DOM
-
2026-06-01days on market $209,000 Active 18 DOM
-
2026-05-31days on market $209,000 Active 17 DOM
-
2026-05-31days on market $209,000 Active 16 DOM
-
2026-05-14$209,000 Active 2030-char remark
-
2025-10-02status Pending
-
2025-10-02historical
-
2025-05-02$205,000 Active
ⓘ Source: listings_history table (triggers on properties + properties_extension) + one-shot
backfill from property_details.listing_events for pre-trigger history.
Tax reassessment forecast NY · Partial reset (capped growth)
- Current annual tax
- $3,151 · $263/mo
- Projected year-2 tax
- $3,342 · $278/mo
- Expected delta
- +$190/yr (+$16/mo · 6.0%)
ⓘ Screening estimate from a state-policy table — verify with the county assessor before closing.
Climate risk First Street
- Flood 1/10 Low FEMA zone X (unshaded) · 0% chance over 30 yrs
- Wildfire 3/10 Moderate
- Heat 2/10 Low 7 d/yr ≥94°F today · 15 d/yr by 30 yrs out
- Wind 3/10 Moderate 4% chance of damaging wind over 30 yrs
- Air quality 2/10 Low 0 unhealthy d/yr today · 1 by 30 yrs out
Nearby sold comps map
Loading sold comps map…
Walkable amenities ~0.75 mi
Loading nearby amenities…
Taxation est. · year 1
- Rental income
- $20,947
- − Mortgage interest
- −$11,707
- − Property taxes
- −$3,151
- − Insurance
- −$1,045
- − Repairs & maintenance
- −$1,676
- − Management
- −$1,676
- − Depreciation
- −$6,080
- Taxable loss
- −$4,388
- Est. tax savings @ 24.0%
- +$1,053
- After-tax cash flow
- $253/yr
For passive investors: Depreciation is non-cash, so a rental often shows a tax loss while cash-flowing — sheltering income. Rental losses are passive: they offset passive income freely, and up to $25,000/yr can offset ordinary (W-2) income if you actively participate and your MAGI is under $100k (phasing out to $0 by $150k); unused losses carry forward. On sale, claimed depreciation is recaptured at up to 25%, and gains may owe capital-gains tax (a 1031 exchange can defer both). Figures are a year-1 estimate at your 24.0% rate — not tax advice; consult a CPA.
Schools (NCES district)
- District
- Fallsburg Central School District
- NCES district ID
- 3610950
- Math proficiency
- 29% ▼ -3.00%
- Reading proficiency
- 27% ▬ 0.00%
- Median HH income
- $42,513
- Composite
- 23.84/100
- National rank
- #7805
- State rank
- #583 of 590 in NY
Livability — Woodbourne
No livability data for this city. (Only ~50 U.S. cities are tracked.)
Census & demographics
- Population (ZIP)
- 3,122
Population outlook (Sullivan County) Hauer SSP2
- Today (2025)
- 68,974 people
- By 2030
- 65,609 · -4.9%
- By 2040
- 58,878 · -14.6%
- By 2050
- 52,500 · -23.9%
- By 2075
- 39,941 · -42.1%
- By 2100
- 28,880 · -58.1%
Race, ethnicity, and origin ACS 2023
- Neighborhood character
- Diverse neighborhood (Simpson 0.60)
- Race & ethnicity
- White 57% Hispanic / Latino 22% Black 16% Two or more races 12%
- Hispanic origin (detail)
- Mexican 6% Puerto Rican 5% Dominican 5%
- Common ancestry
- Romanian 5% Scotch-Irish 4% Iranian 4%
- Foreign-born
- 12% · Canada, Jamaica
- Languages at home
- 89% English-only · Spanish 9% Russian/Polish/Slavic 1% Other Indo-European 1%
Political lean MEDSL · Sullivan
- 2024 margin
- R (+16.7) · D 41.6% · R 58.4%
- 2008→2024 swing
- -26.2pp toward R · 2008: 9.5pp · 2024: -16.7pp
- All cycles
- 2024: R+16.7 2020: R+9.2 2016: R+13.7 2012: D+10.4 2008: D+9.5
Not yet ingested
- Civics
- —
Market trends
- HPI YoY
- ▲ 10.93%
- Current HPI
- 472.8635
- Rent YoY
- —
- Metro
- —
- State GDP YoY
- ▲ 2.60%
- F500 in state
- 92
Industry mix (Fortune 500 HQ in NY)
| Industry | F500 HQs | Revenue |
|---|---|---|
| Financial Services | 10 | $950B |
|
||
| Consumer Goods | 9 | $162B |
|
||
| Insurance | 4 | $225B |
|
||
| Telecommunications | 2 | $144B |
|
||
| Pharmaceuticals | 2 | $112B |
|
||
| Media / Entertainment | 2 | $69B |
|
||
Price history
+2.0% since first listed5 events — show timeline
- 2026-06-15 Pending — OneKey® MLS as Distributed by MLS Grid
- 2026-05-14 Listed $209,000 OneKey® MLS as Distributed by MLS Grid
- 2025-10-02 Pending — OneKey® MLS as Distributed by MLS Grid
- 2025-10-02 Listing Removed — OneKey® MLS as Distributed by MLS Grid
- 2025-05-02 Listed $205,000 OneKey® MLS as Distributed by MLS Grid
Property tax history
+10.2%/yrLatest (2025): $3,151 · -4.6% YoY. Source: county tax records.
Cash-flow waterfall
monthlySold comps — $/sqft
last 12 mo · ≤1 miLoading sold comps…