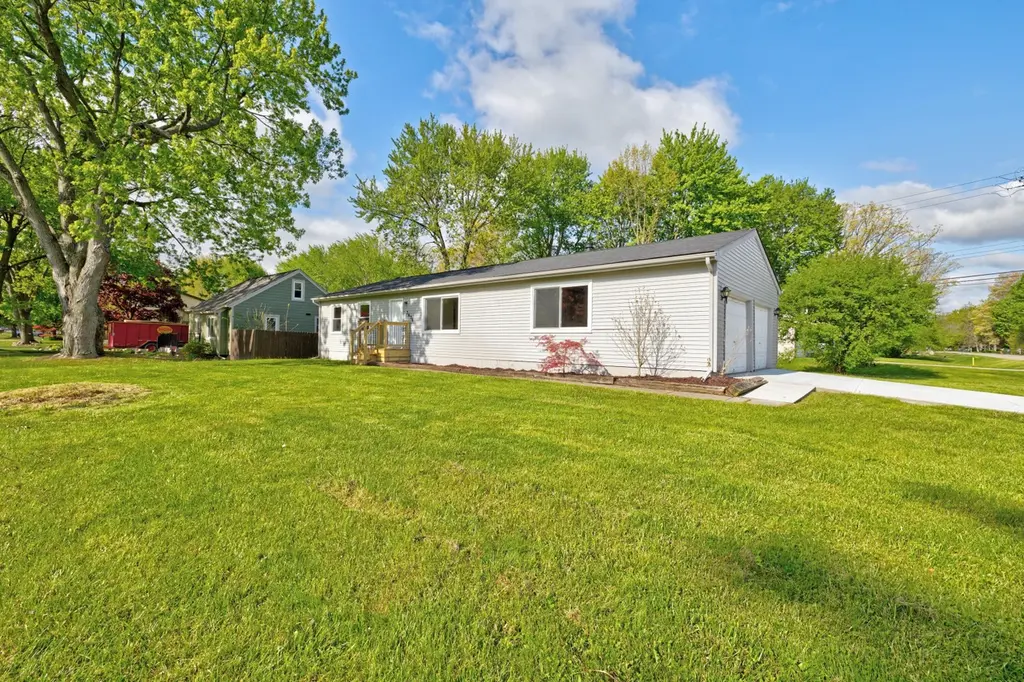
3636 Alida Ave · Rochester Hills, MI
Flood risk 1/10 · Minimal
- FEMA flood zone
- X (unshaded)
- Chance of flooding over 30 yrs
- 0.0%
- Est. flood insurance / yr
- $473 – $860
Fire risk 1/10 · Minimal
- Est. fire insurance / yr
- $784 – $1,456
Heat risk 2/10 · Minimal
- Hot days now (above 97°F)
- 7 days/yr
- Hot days in 30 yrs
- 15 days/yr
Wind risk 2/10 · Minimal
- Chance of severe wind over 30 yrs
- —
Air-quality risk 3/10 · Minor
- Unhealthy air days now
- 2 days/yr
- Unhealthy air days in 30 yrs
- 5 days/yr
Risk factors via First Street. Map © Google.
Why this score? — see what drove the D grade
The composite is a weighted blend of 9 inputs, each scored 0–100. Each bar is that input's sub-score; the figure is the points it added to the 100-point composite (weight × sub-score).
- Cash flow +18.6/30.0
- DSCR +5.9/10.0
- 1% rule +4.3/10.0
- Livability +3.9/5.0
- Schools +3.7/10.0
- Rent growth +2.5/5.0
- Condition / age +2.5/5.0
- ARV discount +1.9/15.0
- Appreciation +0.0/10.0
$324,900
🖨 Deal sheet (PDF) 📄 Offer letter ✓ Due diligence
Listing remarks MLS
Hard to find fully renovated Rochester Hills ranch is move in ready. Large corner interior sub lot with side entry 2 car attached garage and new roof 2026. New front porch and concrete drive. Home has been freshly painted including the full basement with new flooring, windows, and light fixtures throughout. The updated kitchen with new cabinets, quartz countertops and subway backsplash is the perfect focal point and gathering room for your new residence. Bathroom fully remodeled with modern ceramic, vanity, lighting, and flooring. this is the home you have been searching for
Key facts
- Fully renovated
- Quartz countertops
- New front porch
Tags
Property features AI
Exterior
- Parking: Attached 2-car garage
- Utilities: Public water; Natural gas connected; Natural gas water heater; Public sewer
- Home design: Ranch-style single-family home; One story
- Construction: Built in 1982; Aluminum siding; Asphalt roof; Full basement foundation
- Exterior features: Corner lot; Paved road access
Interior
- Kitchen: Dishwasher; Disposal; Microwave
- Bedrooms: Primary bedroom (15 x 10) carpeted; Bedroom 2 (14 x 10) carpeted; Bedroom 3 (9 x 9) carpeted
- Flooring: Carpet in living areas and bedrooms; LVP flooring in dining area; Ceramic in bathroom
- Bathrooms: 1 full bathroom with ceramic flooring
- Heating & cooling: Forced air heating; Has cooling
- Interior features: Pantry; Replacement insulated windows
- Laundry & utility: Full basement
Neighborhood map
What this means for you Summary
Snapshot
- This is a 3-bed/1.0-bath single-family listed at $325k.
Deal economics
- At list price, monthly cash flow is $318 ($4k/yr) — positive.
- The deal already cash-flows at list — no discount required.
- To meet the 1% rule (rent ≥ 1% of price), the offer needs to be $301k (7.5% below list).
- Recommended offer: $301k (7.5% below list) — sets the bar for 1% rule.
- Cap rate 7.5% vs local median 2.8% in Rochester Hills — top-decile yield for the area; either an underpriced asset or a hidden risk that comps aren't pricing in. Stress-test before assuming the spread holds.
Location & tenants
- Location reads 77/100 on livability (#127 in MI, #3,163 nationally) — a middle-class / working-renter tenant base. Strengths: crime A+, employment A+, housing A+; Watch: health & safety D, amenities F, commute F.
- Avondale School District (suburban): math 34% / reading 48% proficiency, ranked #162 of 540 in MI (top 30%) — families likely to look elsewhere, expect single-tenant / working-renter base with shorter leases.
- Zoned schools: Deerfield Elementary School (math 42% / reading 57%, grade D, #382 of 1,397 statewide, top 30%, 330 students, 41% FRL); Avondale Middle School (math 30% / reading 43%, grade F, #264 of 493 statewide, top 54%, 630 students, 58% FRL); Avondale High School (math 37% / reading 67%, grade D+, #128 of 713 statewide, top 19%, 1,004 students, 48% FRL) — zoned schools average 49% FRL vs 28% district-wide (21 pts higher); higher-poverty schools than district average — tighter screening recommended.
- Market conditions: 155 active listings in the ZIP; 4 comparable units currently listed for rent nearby; rentals leasing fast (median 5d on market — plan ~1-2 weeks tenant-placement turnaround); 2,614 units permitted in Oakland County in 2024 (721 in 5+ unit buildings).
Forward outlook
- Local home prices are declining (-3.0%/yr); year-one equity from $2k of loan paydown is wiped out by about $10k of value loss. Plan a longer hold.
- Oakland County population projected at +10% by 2050 — modest demand growth; plan on rents tracking national, not racing it.
Negotiation context
- Only 10 days on market — expect competitive offers; lowballing is unlikely to land.
- 5 sale attempts with the ask held roughly flat each time — persistent listings suggest the price (not the market) is what's stuck; bring a comps-based counter.
Questions for the listing agent
- Is there a deadline driving the sale (1031 exchange, divorce, estate, relocation)? That informs how much negotiation room exists.
- Schools are A-rated — typically a magnet for longer-tenancy family renters. What's the average tenant stay here, and is there a school-zone premium baked into asking?
- The area grade is low — what's the realistic commute time and amenity access for the typical tenant pool here? Any planned neighborhood developments (good or bad) we should know about?
- What's the average days-on-market for RENTAL listings here right now (not sales)? A rising rental-DOM trend means longer vacancies and softer asking-rent achievability than the comps imply.
- What's the recent tenant-quality profile in this submarket — average credit score on applications, eviction rate, late-payment / NSF rate, and stable-employment percentage? A property-management company in the area should have these aggregated.
- How much new for-sale + rental construction is in the pipeline within 1–3 miles? Heavy new supply typically softens prices + rents 12–24 months out; constrained supply supports both.
Investment metrics
- 1% rule
- 0.93% ✗
- Cap rate
- 7.47%
- Cash-on-cash
- 4.20%
- DSCR
- 1.19
- GRM
- 9.0
CMA / ARV
- ARV (median comp)
- $288,796
- List price
- $324,900
- Delta
- 12.50%
- Verdict
- OVERPRICED
- Comps
- 20 within 1.0 mi
Show comp detail 9 sales within ~0.75 mi
| Address | Dist | Beds/Ba | Sqft | Sold | Price | $/sf | Match |
|---|---|---|---|---|---|---|---|
| 3636 Alida Ave | 0.00mi | 3/1.0 | 1,040 (0%) | 0mo | $310,000 | $298 | 100 |
| 3636 Alida Ave | 0.00mi | 3/1.0 | 1,040 (0%) | 14mo | $216,000 | $208 | 89 |
| 1734 Tamm Ave | 0.39mi | 2/1.0 (-1) | 992 (-5%) | 3mo | $265,000 | $267 | 66 |
| 3628 Cone Ave | 0.19mi | 3/2.0 | 1,096 (+5%) | 21mo | $267,000 | $244 | 60 |
| 1901 Tamm Ave | 0.41mi | 3/1.0 | 1,100 (+6%) | 14mo | $235,000 | $214 | 60 |
| 3225 Donley Ave | 0.52mi | 3/1.0 | 1,151 (+11%) | 8mo | $275,000 | $239 | 52 |
| 3115 Crooks Rd | 0.52mi | 3/1.0 | 1,104 (+6%) | 22mo | $185,500 | $168 | 47 |
| 3416 Cone Ave | 0.23mi | 3/2.0 | 1,162 (+12%) | 23mo | $265,000 | $228 | 47 |
| 3744 Donley Ave | 0.47mi | 3/2.0 | 1,192 (+15%) | 23mo | $330,000 | $277 | 31 |
Match score weights: distance 35% · size 25% · config 20% · recency 20%. Top-matched comps best support the ARV.
Projected returns pro-forma
-3.0% appreciation · 3.0% rent growth · sell at horizon
- IRR
- -9.8%
- Equity multiple
- 0.64×
- Total profit
- $-32,463
- Equity at exit
- $48,444
- IRR
- -0.4%
- Equity multiple
- 0.97×
- Total profit
- $-2,472
- Equity at exit
- $28,091
Cash invested: $90,972 (down + closing). Projections, not guarantees.
Landlord ↔ Tenant lean methodology
- Overall (STATE)
- 62 Landlord-Friendly
- State Michigan
- 62 Landlord-Friendly · EVEN
- County
- — inherits STATE
- City
- — inherits STATE
ZIP-level market 48309
- Active inventory
- 155
- Price-to-rent
- 9.0×
Monthly cashflow live
- Estimated rent
- $3,006 medium interval (Pro) →
- Mortgage (P&I)
- −$1,704
- Tax from tax record
- −$218 /mo · $2,613/yr
- Insurance
- −$135
- HOA
- −$0
- Vacancy / Maint / Mgmt
- −$631
- Net cashflow
- $318
Break-even live
Sensitivity live
| Price | -10% $502 | -5% $410 | +0% $318 | +5% $226 | +10% $134 |
|---|---|---|---|---|---|
| Rent | -10% $81 | -5% $199 | +0% $318 | +5% $437 | +10% $556 |
| Rate | -1.0pp $482 | -0.5pp $401 | base $318 | +0.5pp $234 | +1.0pp $148 |
UW: 25.0% down · 7.5% · 30yr · 1.5% tax · 5.0% vac · 8.0% maint · 8.0% mgmt
Financing live
Cash to close
- Down payment
- $81,225
- Closing costs
- $9,747
- Reserves months
- —
- Total cash needed
- —
Loan-product check · same deal, 3 products live
Conventional
25% down · 7.5% · 30yr
- Down + closing
- —
- Monthly P&I
- —
- Monthly cashflow
- —
- DSCR
- —
- Eligible?
- —
Personal DTI + credit; lowest rate.
DSCR
20% down · 8.5% · 30yr
- Down + closing
- —
- Monthly P&I
- —
- Monthly cashflow
- —
- DSCR
- —
- Eligible?
- —
No personal income docs; deal must DSCR.
Hard money
10% down · 12.0% · 12mo
- Down + closing
- —
- Monthly P&I
- —
- Monthly cashflow
- —
- DSCR
- —
- Eligible?
- —
Short-term bridge; refi at stabilization.
Rent comps 4 comps
| Address | Beds | Baths | Sqft | Rent | $/sqft | DOM | Units | Dist |
|---|---|---|---|---|---|---|---|---|
| 2800 Overlook Dr Rochester Hills, MI | 1.0–2.0 | 1.0–2.0 | 853 | $1,833 | $2.15 | 1d | 12 | 1.03mi |
| 2740 Upper Ridge Dr Rochester Hills, MI | 2.0 | 2.0 | 1093 | $3,480 | $3.18 | 5d | 1 | 1.10mi |
| 3465 Hazelton Ave Rochester Hills, MI | 3.0 | 1.5 | 1240 | $3,690 | $2.98 | 5d | 1 | 1.10mi |
| 2600 W Auburn Rd Rochester Hills, MI | 2.0–3.0 | 2.0 | 1264 | $1,759 | $1.39 | 7d | 1 | 1.23mi |
Listing history 12 events
-
2026-05-14$324,900 Active 581-char remark
Show marketing remark (581 chars)
Hard to find fully renovated Rochester Hills ranch is move in ready. Large corner interior sub lot with side entry 2 car attached garage and new roof 2026. New front porch and concrete drive. Home has been freshly painted including the full basement with new flooring, windows, and light fixtures throughout. The updated kitchen with new cabinets, quartz countertops and subway backsplash is the perfect focal point and gathering room for your new residence. Bathroom fully remodeled with modern ceramic, vanity, lighting, and flooring. this is the home you have been searching for
-
2026-05-14$324,900 Active
Show marketing remark (581 chars)
Hard to find fully renovated Rochester Hills ranch is move in ready. Large corner interior sub lot with side entry 2 car attached garage and new roof 2026. New front porch and concrete drive. Home has been freshly painted including the full basement with new flooring, windows, and light fixtures throughout. The updated kitchen with new cabinets, quartz countertops and subway backsplash is the perfect focal point and gathering room for your new residence. Bathroom fully remodeled with modern ceramic, vanity, lighting, and flooring. this is the home you have been searching for
-
2025-05-01soldstatus $216,000 Closed
-
2025-05-01soldstatus $216,000 Closed
-
2025-05-01soldstatus $216,000
-
2025-04-10status Pending
-
2025-04-10status Pending
-
2025-04-07$180,000 Active
-
2025-04-07$180,000 Active
-
1988-10-01soldstatus $79,000
-
1982-08-01soldstatus $45,000
ⓘ Source: listings_history table (triggers on properties + properties_extension) + one-shot
backfill from property_details.listing_events for pre-trigger history.
Tax reassessment forecast MI · Partial reset (capped growth)
- Current annual tax
- $2,613 · $218/mo
- Projected year-2 tax
- $3,808 · $317/mo
- Expected delta
- +$1,195/yr (+$100/mo · 45.7%)
ⓘ Screening estimate from a state-policy table — verify with the county assessor before closing.
Climate risk First Street
- Flood 1/10 Low FEMA zone X (unshaded) · 0% chance over 30 yrs
- Wildfire 1/10 Low
- Heat 2/10 Low 7 d/yr ≥97°F today · 15 d/yr by 30 yrs out
- Wind 2/10 Low
- Air quality 3/10 Moderate 2 unhealthy d/yr today · 5 by 30 yrs out
Nearby sold comps map
Loading sold comps map…
Walkable amenities ~0.75 mi
Loading nearby amenities…
Taxation est. · year 1
- Rental income
- $36,075
- − Mortgage interest
- −$18,199
- − Property taxes
- −$2,613
- − Insurance
- −$1,624
- − Repairs & maintenance
- −$2,886
- − Management
- −$2,886
- − Depreciation
- −$9,452
- Taxable loss
- −$1,585
- Est. tax savings @ 24.0%
- +$380
- After-tax cash flow
- $4,197/yr
For passive investors: Depreciation is non-cash, so a rental often shows a tax loss while cash-flowing — sheltering income. Rental losses are passive: they offset passive income freely, and up to $25,000/yr can offset ordinary (W-2) income if you actively participate and your MAGI is under $100k (phasing out to $0 by $150k); unused losses carry forward. On sale, claimed depreciation is recaptured at up to 25%, and gains may owe capital-gains tax (a 1031 exchange can defer both). Figures are a year-1 estimate at your 24.0% rate — not tax advice; consult a CPA.
Schools (NCES district)
- District
- Avondale School District
- NCES district ID
- 2603690
- Math proficiency
- 34% ▼ -8.00%
- Reading proficiency
- 48% ▼ -4.00%
- Median HH income
- $71,549
- Composite
- 37.33/100
- National rank
- #4442
- State rank
- #162 of 540 in MI
Livability — Rochester Hills
- Score
- 77/100
- State rank
- #127
- US rank
- #3163
Category grades
Schools grade is shown separately in the Schools card above.
Census & demographics
- Census place
- Rochester Hills, MI
- City population
- 44,714
- Population (ZIP)
- 30,254
Population outlook (Oakland County) Hauer SSP2
- Today (2025)
- 1,335,747 people
- By 2030
- 1,375,100 · +2.9%
- By 2040
- 1,435,385 · +7.5%
- By 2050
- 1,469,250 · +10.0%
- By 2075
- 1,531,946 · +14.7%
- By 2100
- 1,450,485 · +8.6%
Race, ethnicity, and origin ACS 2023
- Neighborhood character
- Predominantly White (75%)
- Race & ethnicity
- White 75% Asian 12% Two or more races 6% Hispanic / Latino 4% Black 4%
- Common ancestry
- Romanian 10% Lithuanian 3% Slovak 3%
- Foreign-born
- 19% · Canada, China, South Korea
- Languages at home
- 80% English-only · Other Indo-European 6% Chinese 3% Russian/Polish/Slavic 2%
Political lean MEDSL · Oakland
- 2024 margin
- D (+10.6) · D 54.4% · R 43.8% · Other 1.9%
- 2008→2024 swing
- -3.9pp toward R · 2008: 14.5pp · 2024: 10.6pp
- All cycles
- 2024: D+10.6 2020: D+14.1 2016: D+8.1 2012: D+8.1 2008: D+14.5
Not yet ingested
- Civics
- —
Market trends
- HPI YoY
- ▼ -136.99%
- Current HPI
- 201.9197
- Rent YoY
- —
- Metro
- —
- State GDP YoY
- ▲ 1.37%
- F500 in state
- 28
Industry mix (Fortune 500 HQ in MI)
| Industry | F500 HQs | Revenue |
|---|---|---|
| Automotive Parts | 3 | $48B |
|
||
| Automotive | 2 | $372B |
|
||
| Chemicals | 1 | $45B |
|
||
| Automotive Retail | 1 | $29B |
|
||
| Healthcare / Medical Devices | 1 | $23B |
|
||
| Automotive Technology | 1 | $20B |
|
||
Price history
+588.9% since first listed21 events — show timeline
- 2026-06-08 Sold (MLS) $310,000 REALCOMP
- 2026-06-08 Sold (MLS) $310,000 SW Michigan MLS
- 2026-06-08 Sold (MLS) $310,000 MiRealSource-MiMLS
- 2026-05-24 Pending — REALCOMP
- 2026-05-24 Pending — MiRealSource-MiMLS
- 2026-05-24 Pending — SW Michigan MLS
- 2026-05-19 Contingent — MiRealSource-MiMLS
- 2026-05-19 Contingent — REALCOMP
- 2026-05-19 Contingent — SW Michigan MLS
- 2026-05-14 Listed $324,900 REALCOMP
- 2026-05-14 Listed $324,900 SW Michigan MLS
- 2026-05-14 Listed $324,900 MiRealSource-MiMLS
- 2025-05-01 Sold (Public Records) $216,000 Public Records
- 2025-05-01 Sold (MLS) $216,000 MiRealSource-MiMLS
- 2025-05-01 Sold (MLS) $216,000 REALCOMP
- 2025-04-10 Pending — MiRealSource-MiMLS
- 2025-04-10 Pending — REALCOMP
- 2025-04-07 Listed $180,000 REALCOMP
- 2025-04-07 Listed $180,000 MiRealSource-MiMLS
- 1988-10-01 Sold (Public Records) $79,000 Public Records
- 1982-08-01 Sold (Public Records) $45,000 Public Records
Property tax history
+3.0%/yrLatest (2025): $2,613 · +4.2% YoY. Source: county tax records.
Cash-flow waterfall
monthlySold comps — $/sqft
last 12 mo · ≤1 miLoading sold comps…