2185 Winterberry Ln · Cambridge, MD
Flood risk 1/10 · Minimal
- FEMA flood zone
- X (unshaded)
- Chance of flooding over 30 yrs
- 0.0%
- Est. flood insurance / yr
- $507 – $1,088
Fire risk 2/10 · Minimal
- Est. fire insurance / yr
- $755 – $1,403
Heat risk 9/10 · Severe
- Hot days now (above 104°F)
- 7 days/yr
- Hot days in 30 yrs
- 16 days/yr
Wind risk 6/10 · Moderate
- Chance of severe wind over 30 yrs
- 71.0%
Air-quality risk 3/10 · Minor
- Unhealthy air days now
- 2 days/yr
- Unhealthy air days in 30 yrs
- 3 days/yr
Risk factors via First Street. Map © Google.
Why this score? — see what drove the D+ grade
The composite is a weighted blend of 9 inputs, each scored 0–100. Each bar is that input's sub-score; the figure is the points it added to the 100-point composite (weight × sub-score).
- ARV discount +15.0/15.0
- Cash flow +12.2/30.0
- 1% rule +4.8/10.0
- DSCR +3.6/10.0
- Livability +3.2/5.0
- Rent growth +2.5/5.0
- Condition / age +2.5/5.0
- Schools +1.5/10.0
- Appreciation +0.0/10.0
$259,990
🖨 Deal sheet 📄 Offer letter ✓ Due diligence
Listing remarks
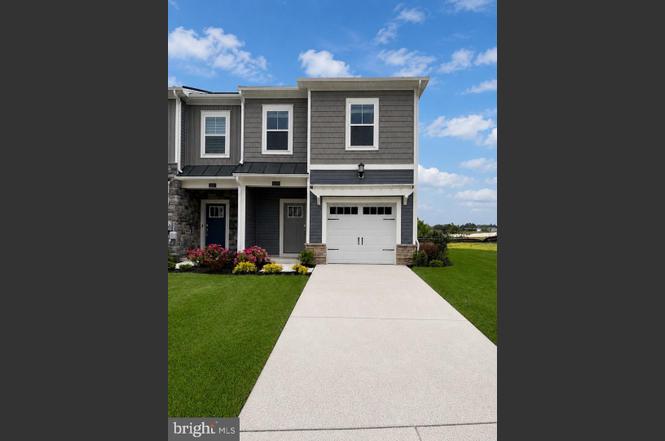
Lennar’s Tides at River Marsh is a premier resort-style community on Maryland’s scenic Eastern Shore in Cambridge, surrounded by the natural beauty of the Choptank River and the acclaimed River Marsh Golf Club. Residents enjoy a relaxed waterfront lifestyle with exceptional amenities, including a clubhouse, swimming pool, walking and biking trails, tennis and pickleball courts, and nearby marina access. Conveniently located adjacent to the Hyatt Regency Chesapeake Bay Resort and just minutes from downtown Cambridge, Blackwater National Wildlife Refuge, and Route 50, the community offers easy access to shopping, dining, recreation, Annapolis, and Ocean City. This move-in ready lu
Key facts
- Clubhouse
- Waterfront lifestyle
- Swimming pool
Tags
Property features AI
Finance
- Financial info: List price $331,440
Exterior
- Parking: 1 garage space (1 total parking space)
- Home design: Single-family home, front-load garage plan
- Exterior features: Living area approximately 1,762
Interior
- Bedrooms: 3 bedrooms
- Bathrooms: 2 full bathrooms and 1 half bathroom (2.5 total)
- Interior features: Spec home (new construction, Camden Front Load Garage plan)
Neighborhood map
What this means for you Summary
Snapshot
- This is a 3-bed/2.5-bath townhouse listed at $260k.
Deal economics
- At list price, monthly cash flow is $-54 ($-642/yr) — negative.
- To cash-flow at today's rent, offer at most $252k (3.0% below list).
- To meet the 1% rule (rent ≥ 1% of price), the offer needs to be $254k (2.1% below list).
- Recommended offer: $252k (3.0% below list) — sets the bar for cash-flow.
- Cap rate 6.0% vs local median 4.2% in Cambridge — top-decile yield for the area; either an underpriced asset or a hidden risk that comps aren't pricing in. Stress-test before assuming the spread holds.
Location & tenants
- Location reads 65/100 on livability (#255 in MD) — a middle-class / working-renter tenant base. Strengths: cost of living A+, health & safety A+, housing B+; Watch: amenities D, schools F, crime F.
- Dorchester County Public Schools (rural): math 10% / reading 23% proficiency, ranked #23 of 24 in MD (top 96%) — low school quality limits family demand, transient renter base, plan for 1-2y turnover.
- Market conditions: 292 active listings in the ZIP; 6 comparable units currently listed for rent nearby; rentals lingering (median 44d on market — plan ~5-8 weeks vacancy on turnover, expect pricing pressure); 100% of comp listings sitting > 30 days — soft ceiling on asking rent; 81 units permitted in Dorchester County in 2024 (0 in 5+ unit buildings).
Forward outlook
- Local home prices are declining (-3.0%/yr); year-one equity from $2k of loan paydown is wiped out by about $8k of value loss. Plan a longer hold.
- Dorchester County population projected to shrink 10% by 2050 — rents likely to lag national; underwrite the cash flow, not the appreciation.
Negotiation context
- Only 1 days on market — expect competitive offers; lowballing is unlikely to land.
Risks & watch-outs
- Climate carrying-cost: major wind risk, 71% chance of damaging wind over 30y; extreme-heat days projected 7→16/yr by 2055 (HVAC capex compounding) — expect insurance premiums to compound above CPI over the hold.
Questions for the listing agent
- What do current leases actually rent for vs. the listed asking? Can we see a recent rent roll and the last 12 months of T-12 income?
- What does the HOA fee cover, when was the last increase, and are there any pending special assessments or reserve-fund shortfalls?
- Is there a deadline driving the sale (1031 exchange, divorce, estate, relocation)? That informs how much negotiation room exists.
- Schools are F-rated, which usually means shorter tenancies and higher turnover. Who's the typical renter profile here, and what's been the actual vacancy rate?
- Crime grade is F in this area — have there been break-ins, vandalism, or insurance claims at this property in the last 3 years? What carrier currently insures it and at what premium?
- The area grade is low — what's the realistic commute time and amenity access for the typical tenant pool here? Any planned neighborhood developments (good or bad) we should know about?
- What's the average days-on-market for RENTAL listings here right now (not sales)? A rising rental-DOM trend means longer vacancies and softer asking-rent achievability than the comps imply.
- What's the recent tenant-quality profile in this submarket — average credit score on applications, eviction rate, late-payment / NSF rate, and stable-employment percentage? A property-management company in the area should have these aggregated.
- How much new for-sale + rental construction is in the pipeline within 1–3 miles? Heavy new supply typically softens prices + rents 12–24 months out; constrained supply supports both.
Investment metrics
- 1% rule
- 0.98% ✗
- Cap rate
- 6.05%
- Cash-on-cash
- -0.88%
- DSCR
- 0.96
- GRM
- 8.5
CMA / ARV
- ARV (on-the-fly)
- $440,500
- Comps found
- 8
Show comp detail 8 sales within ~0.75 mi
| Address | Dist | Beds/Ba | Sqft | Sold | Price | $/sf | Match |
|---|---|---|---|---|---|---|---|
| 2150 Winterberry Ln #20 | 0.00mi | 3/2.5 | 1,544 (-12%) | 7mo | $299,990 | $194 | 74 |
| 2199 Winterberry Ln Unit K | 0.10mi | 3/2.5 | 1,544 (-12%) | 7mo | $249,990 | $162 | 69 |
| 2700 Willow Oak Dr Unit 111B | 0.56mi | 2/2.0 (-1) | 1,720 (-2%) | 5mo | $226,000 | $131 | 59 |
| 2700 Willow Oak Dr Unit 409E | 0.56mi | 2/2.0 (-1) | 1,643 (-7%) | 1mo | $435,000 | $265 | 55 |
| 2700 Willow Oak Dr Unit 304E | 0.56mi | 2/2.0 (-1) | 1,629 (-8%) | 5mo | $407,500 | $250 | 50 |
| 2700 Willow Oak Dr Unit 311B | 0.56mi | 2/2.0 (-1) | 1,509 (-14%) | 4mo | $275,000 | $182 | 40 |
| 2700 Willow Oak Dr Unit 410C | 0.56mi | 2/2.0 (-1) | 1,522 (-14%) | 18mo | $415,000 | $273 | 30 |
| 2700 Willow Oak Dr Unit 310C | 0.56mi | 2/2.0 (-1) | 1,519 (-14%) | 19mo | $395,000 | $260 | 28 |
Match score weights: distance 35% · size 25% · config 20% · recency 20%. Top-matched comps best support the ARV.
Projected returns pro-forma
-3.0% appreciation · 3.0% rent growth · sell at horizon
- IRR
- -17.7%
- Equity multiple
- 0.38×
- Total profit
- $-45,336
- Equity at exit
- $38,765
- IRR
- -9.6%
- Equity multiple
- 0.41×
- Total profit
- $-43,045
- Equity at exit
- $22,479
Cash invested: $72,797 (down + closing). Projections, not guarantees.
Landlord ↔ Tenant lean methodology
- Overall (STATE)
- 27 Tenant-Leaning
- State Maryland
- 27 Tenant-Leaning · D+14
- County
- — inherits STATE
- City
- — inherits STATE
ZIP-level market 21613
- Home prices YoY
- -25.1%
- Active inventory
- 292
- Price-to-rent
- 8.5×
Monthly cashflow live
- Estimated rent
- $2,545 high interval (Pro) →
- Mortgage (P&I)
- −$1,363
- Tax est. 1.5%
- −$325 /mo · $3,900/yr
- Insurance
- −$108
- HOA
- −$267
- Vacancy / Maint / Mgmt
- −$534
- Net cashflow
- $-54
Break-even live
UW: 25.0% down · 7.5% · 30yr · 1.5% tax · 5.0% vac · 8.0% maint · 8.0% mgmt
Financing live
Cash to close
- Down payment
- $64,998
- Closing costs
- $7,800
- Reserves months
- —
- Total cash needed
- —
Loan-product check · same deal, 3 products live
Conventional
25% down · 7.5% · 30yr
- Down + closing
- —
- Monthly P&I
- —
- Monthly cashflow
- —
- DSCR
- —
- Eligible?
- —
Personal DTI + credit; lowest rate.
DSCR
20% down · 8.5% · 30yr
- Down + closing
- —
- Monthly P&I
- —
- Monthly cashflow
- —
- DSCR
- —
- Eligible?
- —
No personal income docs; deal must DSCR.
Hard money
10% down · 12.0% · 12mo
- Down + closing
- —
- Monthly P&I
- —
- Monthly cashflow
- —
- DSCR
- —
- Eligible?
- —
Short-term bridge; refi at stabilization.
Rent comps 6 comps
| Address | Beds | Baths | Sqft | Rent | $/sqft | DOM | Units | Dist |
|---|---|---|---|---|---|---|---|---|
| 2914 Winterberry Ln Cambridge, MD | 4.0 | 3.5 | 2148 | $2,600 | $1.21 | 43d | 1 | 0.04mi |
| 2208 Winterberry Ln Unit I Cambridge, MD | 3.0 | 2.5 | 1919 | $2,450 | $1.28 | 43d | 1 | 0.12mi |
| 2214 Winterberry Ln Unit I Cambridge, MD | 3.0 | 2.5 | 1945 | $2,450 | $1.26 | 43d | 1 | 0.14mi |
| 2108 Winterberry Ln Cambridge, MD | 3.0 | 2.5 | 1909 | $2,500 | $1.31 | 43d | 1 | 0.15mi |
| 2104 Winterberry Ln Cambridge, MD | 3.0 | 2.5 | 1909 | $2,500 | $1.31 | 43d | 1 | 0.16mi |
| 2102 Winterberry Ln Cambridge, MD | 3.0 | 2.5 | 1909 | $2,800 | $1.47 | 43d | 1 | 0.17mi |
HOA detail
- Monthly dues
- $267 · $3,204/yr
- Likely covers
- waterpool
Listing history 9 events
-
2026-06-18remarks 687-char remark
-
2026-06-18days on market $259,990 Active 1 DOM
-
2026-06-18days on market $259,990 Active 181 DOM
-
2026-06-18price $259,990 Active 180 DOM
-
2026-06-17days on market $331,440 Active 180 DOM
-
2026-06-16days on market $331,440 Active 179 DOM
-
2026-06-15days on market $331,440 Active 178 DOM
-
2026-06-14remarks 392-char remark
-
2026-06-14$331,440 Active 176 DOM
ⓘ Source: listings_history table (triggers on properties + properties_extension) + one-shot
backfill from property_details.listing_events for pre-trigger history.
Climate risk First Street
- Flood 1/10 Low FEMA zone X (unshaded) · 0% chance over 30 yrs
- Wildfire 2/10 Low
- Heat 9/10 Extreme 7 d/yr ≥104°F today · 16 d/yr by 30 yrs out
- Wind 6/10 Major 71% chance of damaging wind over 30 yrs
- Air quality 3/10 Moderate 2 unhealthy d/yr today · 3 by 30 yrs out
Nearby sold comps map
Loading sold comps map…
Walkable amenities ~0.75 mi
Loading nearby amenities…
Taxation est. · year 1
- Rental income
- $30,535
- − Mortgage interest
- −$14,563
- − Property taxes
- −$3,900
- − Insurance
- −$1,300
- − Repairs & maintenance
- −$2,443
- − Management
- −$2,443
- − HOA
- −$3,204
- − Depreciation
- −$7,563
- Taxable loss
- −$4,881
- Est. tax savings @ 24.0%
- +$1,172
- After-tax cash flow
- $529/yr
For passive investors: Depreciation is non-cash, so a rental often shows a tax loss while cash-flowing — sheltering income. Rental losses are passive: they offset passive income freely, and up to $25,000/yr can offset ordinary (W-2) income if you actively participate and your MAGI is under $100k (phasing out to $0 by $150k); unused losses carry forward. On sale, claimed depreciation is recaptured at up to 25%, and gains may owe capital-gains tax (a 1031 exchange can defer both). Figures are a year-1 estimate at your 24.0% rate — not tax advice; consult a CPA.
Schools (NCES district)
- District
- Dorchester County Public Schools
- NCES district ID
- 2400300
- Math proficiency
- 10% ▼ -14.00%
- Reading proficiency
- 23% ▼ -12.00%
- Median HH income
- $46,767
- Composite
- 14.65/100
- National rank
- #9404
- State rank
- #23 of 24 in MD
Livability — Cambridge
- Score
- 65/100
- State rank
- #255
- US rank
- #13046
Category grades
Schools grade is shown separately in the Schools card above.
Census & demographics
- Census place
- Cambridge, MD
- Population (ZIP)
- 18,167
Population outlook (Dorchester County) Hauer SSP2
- Today (2025)
- 31,699 people
- By 2030
- 31,054 · -2.0%
- By 2040
- 29,712 · -6.3%
- By 2050
- 28,618 · -9.7%
- By 2075
- 28,436 · -10.3%
- By 2100
- 28,937 · -8.7%
Race, ethnicity, and origin ACS 2023
- Neighborhood character
- Diverse neighborhood (Simpson 0.62)
- Race & ethnicity
- White 52% Black 33% Two or more races 10% Hispanic / Latino 6% Asian 2%
- Hispanic origin (detail)
- Puerto Rican 3%
- Common ancestry
- Romanian 1% Lithuanian 1% Italian 1%
- Foreign-born
- 4% · Canada
- Languages at home
- 95% English-only · Spanish 3% Other Indo-European 1% German/W. Germanic 1%
Political lean MEDSL · Dorchester
- 2024 margin
- R (+14.6) · D 41.6% · R 56.1% · Other 2.3%
- 2008→2024 swing
- -6.3pp toward R · 2008: -8.2pp · 2024: -14.6pp
- All cycles
- 2024: R+14.6 2020: R+11.9 2016: R+16.0 2012: R+6.6 2008: R+8.2
Not yet ingested
- Civics
- —
Market trends
- HPI YoY
- ▼ -91.03%
- Current HPI
- 271.1127
- Rent YoY
- —
- Metro
- —
- State GDP YoY
- ▲ 2.97%
- F500 in state
- 12
Industry mix (Fortune 500 HQ in MD)
| Industry | F500 HQs | Revenue |
|---|---|---|
| Aerospace / Defense | 1 | $71B |
|
||
| Utilities | 1 | $25B |
|
||
| Hotels | 1 | $24B |
|
||
| Consumer Goods | 1 | $7B |
|
||
| Real Estate | 1 | $6B |
|
||
| Chemicals | 1 | $2B |
|
||
Cash-flow waterfall
monthlySold comps — $/sqft
last 12 mo · ≤1 miLoading sold comps…