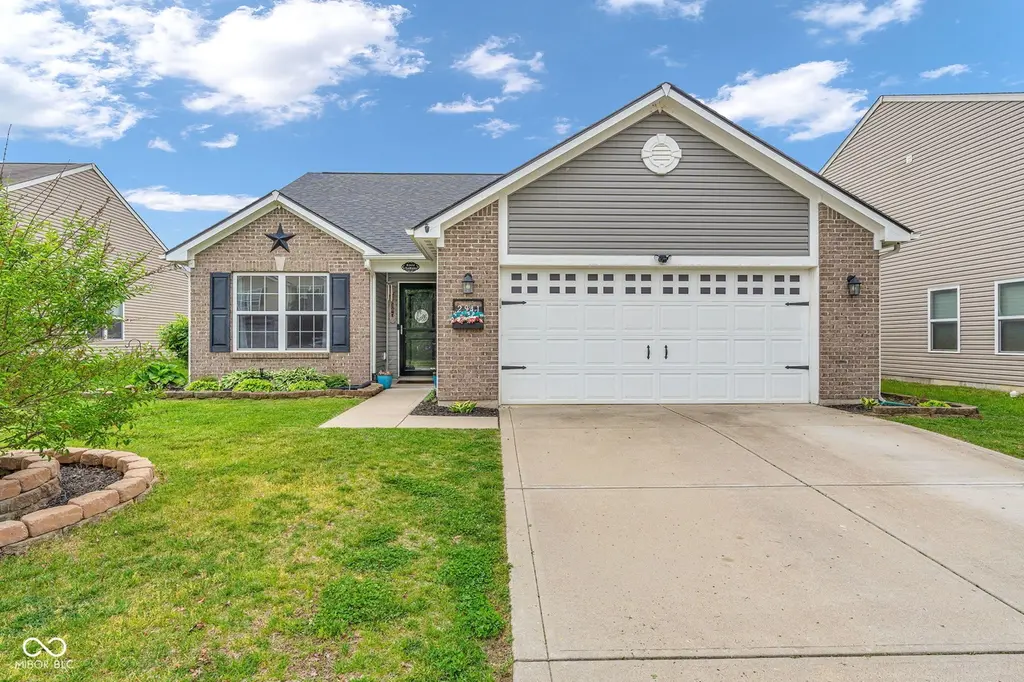
2941 W Hawanian Ln · Monrovia, IN
Flood risk 1/10 · Minimal
- FEMA flood zone
- X (unshaded)
- Chance of flooding over 30 yrs
- 0.0%
- Est. flood insurance / yr
- $507 – $1,088
Fire risk 1/10 · Minimal
- Est. fire insurance / yr
- $717 – $1,331
Heat risk 4/10 · Minor
- Hot days now (above 102°F)
- 7 days/yr
- Hot days in 30 yrs
- 20 days/yr
Wind risk 2/10 · Minimal
- Chance of severe wind over 30 yrs
- 1.0%
Air-quality risk 3/10 · Minor
- Unhealthy air days now
- 2 days/yr
- Unhealthy air days in 30 yrs
- 3 days/yr
Risk factors via First Street. Map © Google.
Why this score? — see what drove the D grade
The composite is a weighted blend of 9 inputs, each scored 0–100. Each bar is that input's sub-score; the figure is the points it added to the 100-point composite (weight × sub-score).
- Cash flow +9.8/30.0
- ARV discount +9.1/15.0
- Appreciation +4.5/10.0
- Schools +3.4/10.0
- Livability +3.3/5.0
- DSCR +2.8/10.0
- Rent growth +2.5/5.0
- Condition / age +2.5/5.0
- 1% rule +2.2/10.0
$250,000
🖨 Deal sheet (PDF) 📄 Offer letter ✓ Due diligence
Listing remarks
Welcome Home! This beautifully updated ranch-style home is truly move-in ready, offering stylish upgrades throughout. Thoughtfully selected colors and tasteful finishes create a warm, inviting atmosphere in every room. The open floorplan is ideal for both everyday living and entertaining, with excellent flow and functionality. The spacious kitchen-designed for multiple cooks-features stunning maple cabinetry and comes complete with all appliances. Luxurious laminate flooring adds a modern touch and is sure to impress your guests. Need extra space? The dedicated office can easily serve as a 4th bedroom to suit your needs. Enjoy privacy in the fully fenced rear yard-perfect for relaxing or pl
Key facts
- Spacious kitchen
- Brand-new roof
- Dedicated office
Tags
Property features AI
Finance
- HOA & community: Homeowners association with annual fee (approximately $450/year); Community pool; Association covers entrance common, maintenance, and park/playground
Exterior
- Parking: Attached 2-car garage (about 440 sq ft)
- Utilities: Public water; Municipal sewer connected; Regular solid waste service
- Home design: Single-family residence; One level; North-facing
- Construction: Vinyl with brick exterior; Slab foundation; Built as a one-level home
- Exterior features: Patio; Full yard fencing; Sidewalks; Located in a rural-subdivision setting
Interior
- Kitchen: Dishwasher; Electric oven; Microwave with hood; Refrigerator; Garbage disposal
- Bedrooms: Four bedrooms on the main level (examples of bedroom sizes include 11x11, 13x10, 12x12)
- Bathrooms: Two full bathrooms (both on the main level)
- Heating & cooling: Forced air heating (electric); Central air conditioning
- Interior features: Attic access; Walk-in closets; Painted woodwork; Eat-in kitchen
- Laundry & utility: Laundry room on the main level; Electric water heater
Neighborhood map
What this means for you Summary
Snapshot
- This is a 3-bed/2.0-bath single-family listed at $250k.
Deal economics
- At list price, monthly cash flow is $-159 ($-2k/yr) — negative.
- To cash-flow at today's rent, offer at most $222k (11.2% below list).
- To meet the 1% rule (rent ≥ 1% of price), the offer needs to be $179k (28.3% below list).
- Recommended offer: $179k (28.3% below list) — sets the bar for 1% rule.
- Cap rate 5.5% vs local median 4.4% in Monrovia — meaningfully above typical; check what's discounted (condition, days-on-market, listing class) to confirm the premium yield is real.
Location & tenants
- Location reads 66/100 on livability (#304 in IN) — a middle-class / working-renter tenant base. Strengths: crime A+, employment A+, cost of living A+; Watch: amenities F, commute F, health & safety F.
- Monroe-Gregg School District (rural): math 31% / reading 45% proficiency, ranked #143 of 301 in IN (top 48%) — families likely to look elsewhere, expect single-tenant / working-renter base with shorter leases.
- Zoned schools: Monrovia Elementary School (math 42% / reading 44%, grade F, #417 of 994 statewide, top 43%, 702 students, 47% FRL); Monrovia Middle School (math 24% / reading 42%, grade F, #180 of 330 statewide, top 56%, 328 students, 47% FRL); Monrovia High School (math 32% / reading 57%, grade F, #169 of 369 statewide, top 51%, 528 students, 36% FRL).
- Market conditions: 56 active listings in the ZIP; 2 comparable units currently listed for rent nearby; 330 units permitted in Morgan County in 2024 (0 in 5+ unit buildings).
Forward outlook
- Local home prices are declining (-1.0%/yr); year-one equity from $2k of loan paydown is wiped out by about $2k of value loss. Plan a longer hold.
- Morgan County population projected to shrink 6% by 2050 — rents likely to lag national; underwrite the cash flow, not the appreciation.
Negotiation context
- Only 8 days on market — expect competitive offers; lowballing is unlikely to land.
- 5 sale attempts since 12y ago with the ask held roughly flat each time — persistent listings suggest the price (not the market) is what's stuck; bring a comps-based counter.
Questions for the listing agent
- What do current leases actually rent for vs. the listed asking? Can we see a recent rent roll and the last 12 months of T-12 income?
- What does the HOA fee cover, when was the last increase, and are there any pending special assessments or reserve-fund shortfalls?
- Is there a deadline driving the sale (1031 exchange, divorce, estate, relocation)? That informs how much negotiation room exists.
- Schools are D-rated, which usually means shorter tenancies and higher turnover. Who's the typical renter profile here, and what's been the actual vacancy rate?
- The area grade is low — what's the realistic commute time and amenity access for the typical tenant pool here? Any planned neighborhood developments (good or bad) we should know about?
- What's the average days-on-market for RENTAL listings here right now (not sales)? A rising rental-DOM trend means longer vacancies and softer asking-rent achievability than the comps imply.
- What's the recent tenant-quality profile in this submarket — average credit score on applications, eviction rate, late-payment / NSF rate, and stable-employment percentage? A property-management company in the area should have these aggregated.
- How much new for-sale + rental construction is in the pipeline within 1–3 miles? Heavy new supply typically softens prices + rents 12–24 months out; constrained supply supports both.
Investment metrics
- 1% rule
- 0.72% ✗
- Cap rate
- 5.53%
- Cash-on-cash
- -2.73%
- DSCR
- 0.88
- GRM
- 11.6
CMA / ARV
- ARV (median comp)
- $258,998
- List price
- $250,000
- Delta
- -3.47%
- Verdict
- FAIR
- Comps
- 20 within 1.0 mi
Show comp detail 12 sales within ~0.75 mi
| Address | Dist | Beds/Ba | Sqft | Sold | Price | $/sf | Match |
|---|---|---|---|---|---|---|---|
| 2941 W Hawanian Ln | 0.00mi | 4/2.0 (+1) | 1,454 (0%) | 0mo | $250,000 | $172 | 95 |
| 2987 W Longbranch Dr | 0.11mi | 3/2.0 | 1,459 (+0%) | 3mo | $235,000 | $161 | 92 |
| 2966 W Calimanco Ln | 0.03mi | 3/2.0 | 1,399 (-4%) | 2mo | $255,000 | $182 | 91 |
| 3152 W Haberdashery Dr | 0.19mi | 3/2.0 | 1,495 (+3%) | 2mo | $270,000 | $181 | 85 |
| 11171 N Longbranch St | 0.09mi | 3/2.0 | 1,560 (+7%) | 4mo | $259,000 | $166 | 80 |
| 11111 N Longbranch St | 0.08mi | 3/2.0 | 1,616 (+11%) | 3mo | $250,000 | $155 | 75 |
| 60 Terrace Dr | 0.41mi | 3/1.0 | 1,475 (+1%) | 0mo | $222,500 | $151 | 74 |
| 11418 N Meadowbend Way | 0.40mi | 3/2.0 | 1,507 (+4%) | 3mo | $255,000 | $169 | 73 |
| 11254 N Sashing Way | 0.18mi | 3/2.0 | 1,565 (+8%) | 11mo | $267,000 | $171 | 70 |
| 2911 W Hawanian Ln | 0.03mi | 4/2.0 (+1) | 1,585 (+9%) | 11mo | $269,900 | $170 | 69 |
| 11305 N Quillow Way | 0.38mi | 3/2.0 | 1,503 (+3%) | 12mo | $303,000 | $202 | 66 |
| 3256 W Vintage St | 0.33mi | 3/2.0 | 1,272 (-12%) | 1mo | $259,010 | $204 | 63 |
Match score weights: distance 35% · size 25% · config 20% · recency 20%. Top-matched comps best support the ARV.
Projected returns pro-forma
-1.0% appreciation · 3.0% rent growth · sell at horizon
- IRR
- -9.6%
- Equity multiple
- 0.59×
- Total profit
- $-28,988
- Equity at exit
- $60,388
- IRR
- -2.8%
- Equity multiple
- 0.74×
- Total profit
- $-18,162
- Equity at exit
- $63,446
Cash invested: $70,000 (down + closing). Projections, not guarantees.
Landlord ↔ Tenant lean methodology
- Overall (STATE)
- 90 Strongly Landlord-Friendly
- State Indiana
- 90 Strongly Landlord-Friendly · R+11
- County
- — inherits STATE
- City
- — inherits STATE
ZIP-level market 46157
- Home prices YoY
- -0.5%
- Active inventory
- 56
- Price-to-rent
- 11.6×
Monthly cashflow live
- Estimated rent
- $1,792 medium interval (Pro) →
- Mortgage (P&I)
- −$1,311
- Tax from tax record
- −$122 /mo · $1,460/yr
- Insurance
- −$104
- HOA
- −$38
- Vacancy / Maint / Mgmt
- −$376
- Net cashflow
- $-159
Break-even live
Sensitivity live
| Price | -10% $-18 | -5% $-88 | +0% $-159 | +5% $-230 | +10% $-301 |
|---|---|---|---|---|---|
| Rent | -10% $-301 | -5% $-230 | +0% $-159 | +5% $-88 | +10% $-18 |
| Rate | -1.0pp $-33 | -0.5pp $-96 | base $-159 | +0.5pp $-224 | +1.0pp $-290 |
UW: 25.0% down · 7.5% · 30yr · 1.5% tax · 5.0% vac · 8.0% maint · 8.0% mgmt
Financing live
Cash to close
- Down payment
- $62,500
- Closing costs
- $7,500
- Reserves months
- —
- Total cash needed
- —
Loan-product check · same deal, 3 products live
Conventional
25% down · 7.5% · 30yr
- Down + closing
- —
- Monthly P&I
- —
- Monthly cashflow
- —
- DSCR
- —
- Eligible?
- —
Personal DTI + credit; lowest rate.
DSCR
20% down · 8.5% · 30yr
- Down + closing
- —
- Monthly P&I
- —
- Monthly cashflow
- —
- DSCR
- —
- Eligible?
- —
No personal income docs; deal must DSCR.
Hard money
10% down · 12.0% · 12mo
- Down + closing
- —
- Monthly P&I
- —
- Monthly cashflow
- —
- DSCR
- —
- Eligible?
- —
Short-term bridge; refi at stabilization.
Rent comps 2 comps
| Address | Beds | Baths | Sqft | Rent | $/sqft | DOM | Units | Dist |
|---|---|---|---|---|---|---|---|---|
| 2898 W Hawanian Ln Monrovia, IN | 3.0 | 2.0 | 1392 | $1,720 | $1.24 | 45d | 1 | 0.04mi |
| 3009 W Sampler Ln Monrovia, IN | 3.0 | 2.0 | 1560 | $1,866 | $1.20 | 45d | 1 | 0.09mi |
HOA detail
- Monthly dues
- $38 · $456/yr
Listing history 14 events
-
2026-05-09status Pending 836-char remark
-
2026-05-01$250,000 Active 836-char remark
-
2026-01-23historical
-
2026-01-11price $244,999
-
2025-10-11price $249,999
-
2025-10-03price $257,900
-
2025-08-26$259,000 Active
-
2019-09-03historical
-
2019-09-01status Active
-
2019-08-03historical
-
2019-07-29$167,900 Active
-
2014-11-15historical
-
2014-10-31soldstatus $136,625
-
2014-10-01$136,625
ⓘ Source: listings_history table (triggers on properties + properties_extension) + one-shot
backfill from property_details.listing_events for pre-trigger history.
Tax reassessment forecast IN · Partial reset (capped growth)
- Current annual tax
- $1,460 · $122/mo
- Projected year-2 tax
- $1,792 · $149/mo
- Expected delta
- +$333/yr (+$28/mo · 22.8%)
ⓘ Screening estimate from a state-policy table — verify with the county assessor before closing.
Climate risk First Street
- Flood 1/10 Low FEMA zone X (unshaded) · 0% chance over 30 yrs
- Wildfire 1/10 Low
- Heat 4/10 Moderate 7 d/yr ≥102°F today · 20 d/yr by 30 yrs out
- Wind 2/10 Low 100% chance of damaging wind over 30 yrs
- Air quality 3/10 Moderate 2 unhealthy d/yr today · 3 by 30 yrs out
Nearby sold comps map
Loading sold comps map…
Walkable amenities ~0.75 mi
Loading nearby amenities…
Taxation est. · year 1
- Rental income
- $21,504
- − Mortgage interest
- −$14,004
- − Property taxes
- −$1,460
- − Insurance
- −$1,250
- − Repairs & maintenance
- −$1,720
- − Management
- −$1,720
- − HOA
- −$456
- − Depreciation
- −$7,273
- Taxable loss
- −$6,379
- Est. tax savings @ 24.0%
- +$1,531
- After-tax cash flow
- $-379/yr
For passive investors: Depreciation is non-cash, so a rental often shows a tax loss while cash-flowing — sheltering income. Rental losses are passive: they offset passive income freely, and up to $25,000/yr can offset ordinary (W-2) income if you actively participate and your MAGI is under $100k (phasing out to $0 by $150k); unused losses carry forward. On sale, claimed depreciation is recaptured at up to 25%, and gains may owe capital-gains tax (a 1031 exchange can defer both). Figures are a year-1 estimate at your 24.0% rate — not tax advice; consult a CPA.
Schools (NCES district)
- District
- Monroe-Gregg School District
- NCES district ID
- 1804140
- Math proficiency
- 31% ▼ -9.00%
- Reading proficiency
- 45% ▼ -4.00%
- Median HH income
- $64,767
- Composite
- 34.2/100
- National rank
- #5266
- State rank
- #143 of 301 in IN
Livability — Monrovia
- Score
- 66/100
- State rank
- #304
- US rank
- #12092
Category grades
Schools grade is shown separately in the Schools card above.
Census & demographics
- Census place
- Monrovia, IN
- Population (ZIP)
- 4,370
Population outlook (Morgan County) Hauer SSP2
- Today (2025)
- 71,081 people
- By 2030
- 71,178 · +0.1%
- By 2040
- 69,907 · -1.7%
- By 2050
- 66,455 · -6.5%
- By 2075
- 57,291 · -19.4%
- By 2100
- 43,782 · -38.4%
Race, ethnicity, and origin ACS 2023
- Neighborhood character
- Predominantly White (90%)
- Race & ethnicity
- White 90% Two or more races 5% Hispanic / Latino 3% Black 2% Asian 1%
- Common ancestry
- Slovak 2% Italian 2% Lithuanian 1%
- Foreign-born
- 2%
- Languages at home
- 98% English-only · Tagalog/Filipino 1%
Political lean MEDSL · Morgan
- 2024 margin
- Solid R (+54.3) · D 22.0% · R 76.3% · Other 1.7%
- 2008→2024 swing
- -27.3pp toward R · 2008: -27.1pp · 2024: -54.3pp
- All cycles
- 2024: R+54.3 2020: R+54.6 2016: R+56.6 2012: R+41.1 2008: R+27.1
Not yet ingested
- Civics
- —
Market trends
- HPI YoY
- ▼ -1.00%
- Current HPI
- 212.8798
- Rent YoY
- —
- Metro
- —
- State GDP YoY
- ▲ 2.90%
- F500 in state
- 18
Industry mix (Fortune 500 HQ in IN)
| Industry | F500 HQs | Revenue |
|---|---|---|
| Industrial Machinery | 2 | $37B |
|
||
| Healthcare | 1 | $177B |
|
||
| Pharmaceuticals | 1 | $45B |
|
||
| Metals / Steel | 1 | $18B |
|
||
| Agriculture | 1 | $17B |
|
||
| Packaging | 1 | $12B |
|
||
Price history
+83.0% since first listed15 events — show timeline
- 2026-06-09 Sold (MLS) $250,000 MIBOR as Distributed by MLS Grid
- 2026-05-09 Pending — MIBOR as Distributed by MLS Grid
- 2026-05-01 Listed $250,000 MIBOR as Distributed by MLS Grid
- 2026-01-23 Listing Removed — MIBOR as Distributed by MLS Grid
- 2026-01-11 Price Changed $244,999 MIBOR as Distributed by MLS Grid
- 2025-10-11 Price Changed $249,999 MIBOR as Distributed by MLS Grid
- 2025-10-03 Price Changed $257,900 MIBOR as Distributed by MLS Grid
- 2025-08-26 Listed $259,000 MIBOR as Distributed by MLS Grid
- 2019-09-03 Listing Removed — MIBOR as Distributed by MLS Grid
- 2019-09-01 Relisted — MIBOR as Distributed by MLS Grid
- 2019-08-03 Listing Removed — MIBOR as Distributed by MLS Grid
- 2019-07-29 Listed $167,900 MIBOR as Distributed by MLS Grid
- 2014-11-15 Listing Removed — MIBOR as Distributed by MLS Grid
- 2014-10-31 Sold (MLS) $136,625 MIBOR as Distributed by MLS Grid
- 2014-10-01 Listed $136,625 MIBOR as Distributed by MLS Grid
Property tax history
+63.5%/yrLatest (2025): $1,460 · +4.1% YoY. Source: county tax records.
Cash-flow waterfall
monthlySold comps — $/sqft
last 12 mo · ≤1 miLoading sold comps…