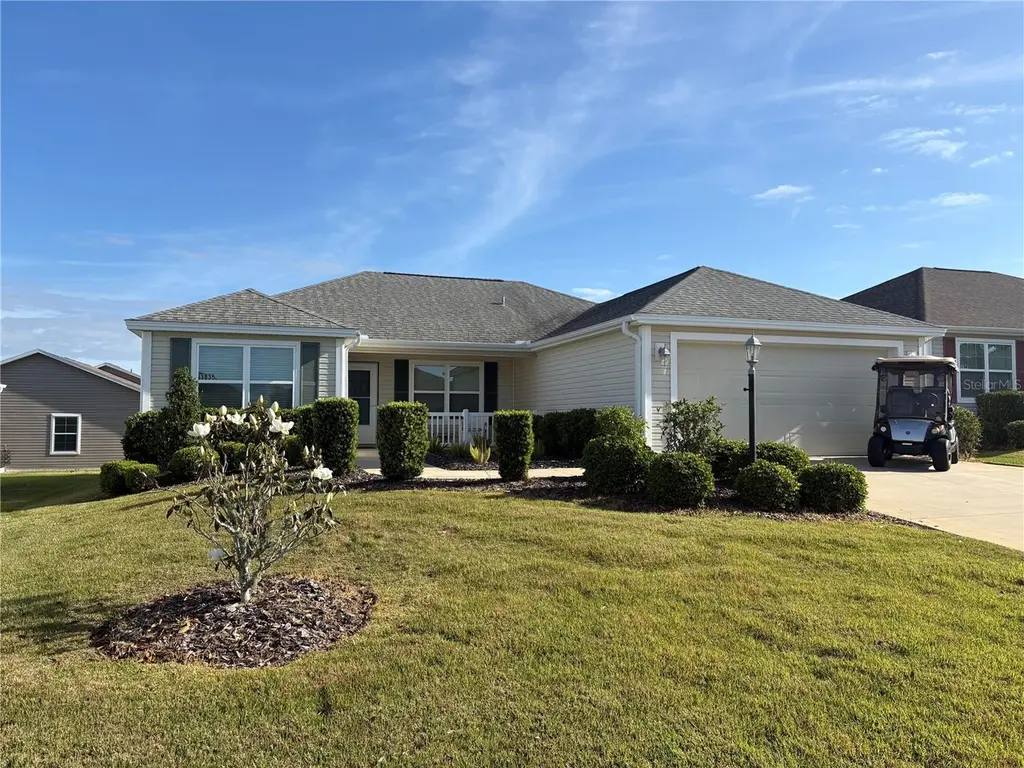
3135 Burns Dr · Fruitland Park, FL
Flood risk 1/10 · Minimal
- FEMA flood zone
- X (unshaded)
- Chance of flooding over 30 yrs
- 0.0%
- Est. flood insurance / yr
- $507 – $1,088
Fire risk 4/10 · Minor
- Est. fire insurance / yr
- $947 – $1,759
Heat risk 9/10 · Severe
- Hot days now (above 108°F)
- 7 days/yr
- Hot days in 30 yrs
- 24 days/yr
Wind risk 9/10 · Severe
- Chance of severe wind over 30 yrs
- 99.0%
Air-quality risk 3/10 · Minor
- Unhealthy air days now
- 2 days/yr
- Unhealthy air days in 30 yrs
- 4 days/yr
Risk factors via First Street. Map © Google.
Why this score? — see what drove the D grade
The composite is a weighted blend of 9 inputs, each scored 0–100. Each bar is that input's sub-score; the figure is the points it added to the 100-point composite (weight × sub-score).
- Appreciation +10.0/10.0
- ARV discount +8.2/15.0
- Cash flow +6.3/30.0
- Schools +4.2/10.0
- Livability +3.5/5.0
- 1% rule +2.8/10.0
- Rent growth +2.5/5.0
- Condition / age +2.5/5.0
- DSCR +0.6/10.0
$381,500
🖨 Deal sheet (PDF) 📄 Offer letter ✓ Due diligence
Listing remarks MLS
LIKE NEW BOUGIANVILA
Key facts
- Screened-in porch
- Front porch
- Split floor plan
Tags
Property features AI
Finance
- Other: Total living area 1,527 square feet
- Financial info: Turnkey (furnished)
- HOA & community: Community development district (CDD); Senior community
Exterior
- Parking: Attached garage with 2 garage spaces
- Utilities: Public water; Public sewer; Electricity available and connected; Cable available and connected; Phone available; Underground utilities; Water available and connected; Sewer available and connected
- Home design: Single-family residence; One story; Faces southwest
- Construction: Vinyl siding exterior; Shingle roof; Slab foundation; Built on a 0.13-acre lot
- Exterior features: Irrigation equipment; Asphalt road access
Interior
- Kitchen: Dishwasher; Range; Range hood; Microwave; Refrigerator; Electric water heater
- Bedrooms: 3 bedrooms
- Flooring: Other
- Bathrooms: 2 full bathrooms
- Heating & cooling: Central heating; Central air conditioning
- Interior features: Ceiling fans; Living room / dining room combo; Open floorplan; Walk-in closets; Window treatments
- Laundry & utility: Washer; Dryer; Laundry inside
Neighborhood map
What this means for you Summary
Snapshot
- This is a 3-bed/2.0-bath single-family listed at $382k.
Deal economics
- At list price, monthly cash flow is $-679 ($-8k/yr) — negative.
- To cash-flow at today's rent, offer at most $262k (31.4% below list).
- To meet the 1% rule (rent ≥ 1% of price), the offer needs to be $297k (22.1% below list).
- Recommended offer: $262k (31.4% below list) — sets the bar for cash-flow.
Location & tenants
- Location reads 70/100 on livability (#447 in FL) — a middle-class / working-renter tenant base. Strengths: housing A+, crime A, health & safety A-; Watch: amenities F, commute F.
- Lake (suburban): math 49% / reading 50% proficiency, ranked #37 of 73 in FL (top 51%) — families likely to look elsewhere, expect single-tenant / working-renter base with shorter leases.
- Zoned schools: Fruitland Park Elementary School (math 46% / reading 41%, grade F, #1,345 of 2,144 statewide, top 64%, 733 students, 66% FRL); Carver Middle School (math 41% / reading 41%, grade F, #353 of 571 statewide, top 63%, 837 students, 65% FRL); Leesburg High School (math 24% / reading 32%, grade F, #464 of 667 statewide, top 70%, 1,641 students, 58% FRL).
- Zoned-school proficiency averages 38% at this address vs 50% district-wide (-12 pts) — the specific schools serving this property underperform the Lake average; the district grade overstates school quality for this exact location.
- Market conditions: 269 active listings in the ZIP; 6 comparable units currently listed for rent nearby; rentals at typical pace (median 23d on market — plan ~3-4 weeks tenant-placement turnaround); solid renter incomes; 4,799 units permitted in Lake County in 2024 (814 in 5+ unit buildings).
- This rent runs 37% of the median local income ($97k/yr) — at the standard rent-burdened threshold; future hikes will face affordability resistance.
Forward outlook
- In year one you build about $41k of equity ($3k loan paydown + $38k appreciation (10.0% local appreciation)).
- Lake County population projected at +37% by 2050 — long-run rental-demand tailwind backs the buy-and-hold thesis.
- By year 2, paydown + projected appreciation supports a ~$66k cash-out refi (75% LTV) — recoverable capital for the next deal without selling this one.
Negotiation context
- It's been on market 72 days — a 6% lower offer ($359k) is reasonable based on typical stale-listing flexibility.
- 2 sale attempts since 8y ago with the ask held roughly flat each time — persistent listings suggest the price (not the market) is what's stuck; bring a comps-based counter.
Risks & watch-outs
- Climate carrying-cost: severe wind risk, 99% chance of damaging wind over 30y; extreme-heat days projected 7→24/yr by 2055 (HVAC capex compounding) — expect insurance premiums to compound above CPI over the hold.
Questions for the listing agent
- What do current leases actually rent for vs. the listed asking? Can we see a recent rent roll and the last 12 months of T-12 income?
- It's been on market 72 days. Have you received any prior offers? Is the seller open to a 31% concession, seller financing, or rate buy-down credit?
- What does the HOA fee cover, when was the last increase, and are there any pending special assessments or reserve-fund shortfalls?
- Why hasn't it sold? Are there any deal-killer items the seller is aware of (foundation, flood, title, zoning, code violations)?
- Is there a deadline driving the sale (1031 exchange, divorce, estate, relocation)? That informs how much negotiation room exists.
- Schools are D-rated, which usually means shorter tenancies and higher turnover. Who's the typical renter profile here, and what's been the actual vacancy rate?
- The area grade is low — what's the realistic commute time and amenity access for the typical tenant pool here? Any planned neighborhood developments (good or bad) we should know about?
- What's the average days-on-market for RENTAL listings here right now (not sales)? A rising rental-DOM trend means longer vacancies and softer asking-rent achievability than the comps imply.
- What's the recent tenant-quality profile in this submarket — average credit score on applications, eviction rate, late-payment / NSF rate, and stable-employment percentage? A property-management company in the area should have these aggregated.
- How much new for-sale + rental construction is in the pipeline within 1–3 miles? Heavy new supply typically softens prices + rents 12–24 months out; constrained supply supports both.
Investment metrics
- 1% rule
- 0.78% ✗
- Cap rate
- 4.16%
- Cash-on-cash
- -7.63%
- DSCR
- 0.66
- GRM
- 10.7
CMA / ARV
- ARV (on-the-fly)
- $387,858
- Comps found
- 6
Show comp detail 6 sales within ~0.75 mi
| Address | Dist | Beds/Ba | Sqft | Sold | Price | $/sf | Match |
|---|---|---|---|---|---|---|---|
| 744 Shelton St | 0.12mi | 3/2.0 | 1,474 (-4%) | 13mo | $275,000 | $187 | 78 |
| 832 Parrish Pl | 0.29mi | 3/2.0 | 1,652 (+8%) | 12mo | $425,000 | $257 | 63 |
| 2975 Bowles Pl | 0.28mi | 3/2.0 | 1,652 (+8%) | 20mo | $500,000 | $303 | 57 |
| 1061 Carver Ct | 0.62mi | 3/2.0 | 1,391 (-9%) | 2mo | $345,000 | $248 | 55 |
| 1084 Becker Ave | 0.66mi | 3/2.0 | 1,395 (-9%) | 12mo | $339,900 | $244 | 45 |
| 1049 Carver Ct | 0.59mi | 3/2.0 | 1,652 (+8%) | 17mo | $420,000 | $254 | 45 |
Match score weights: distance 35% · size 25% · config 20% · recency 20%. Top-matched comps best support the ARV.
Projected returns pro-forma
10.0% appreciation · 3.0% rent growth · sell at horizon
- IRR
- 18.9%
- Equity multiple
- 2.54×
- Total profit
- $164,806
- Equity at exit
- $343,685
- IRR
- 17.5%
- Equity multiple
- 5.87×
- Total profit
- $519,909
- Equity at exit
- $741,171
Cash invested: $106,820 (down + closing). Projections, not guarantees.
Landlord ↔ Tenant lean methodology
- Overall (STATE)
- 87 Strongly Landlord-Friendly
- State Florida
- 87 Strongly Landlord-Friendly · R+3
- County
- — inherits STATE
- City
- — inherits STATE
ZIP-level market 32163
- Home prices YoY
- 9.8%
- Active inventory
- 269
- Price-to-rent
- 10.7×
Monthly cashflow live
- Estimated rent
- $2,973 high interval (Pro) →
- Mortgage (P&I)
- −$2,001
- Tax from tax record
- −$673 /mo · $8,079/yr
- Insurance
- −$159
- HOA
- −$195
- Vacancy / Maint / Mgmt
- −$624
- Net cashflow
- $-679
Break-even live
Sensitivity live
| Price | -10% $-463 | -5% $-571 | +0% $-679 | +5% $-787 | +10% $-895 |
|---|---|---|---|---|---|
| Rent | -10% $-914 | -5% $-797 | +0% $-679 | +5% $-562 | +10% $-444 |
| Rate | -1.0pp $-487 | -0.5pp $-582 | base $-679 | +0.5pp $-778 | +1.0pp $-879 |
UW: 25.0% down · 7.5% · 30yr · 1.5% tax · 5.0% vac · 8.0% maint · 8.0% mgmt
Financing live
Cash to close
- Down payment
- $95,375
- Closing costs
- $11,445
- Reserves months
- —
- Total cash needed
- —
Loan-product check · same deal, 3 products live
Conventional
25% down · 7.5% · 30yr
- Down + closing
- —
- Monthly P&I
- —
- Monthly cashflow
- —
- DSCR
- —
- Eligible?
- —
Personal DTI + credit; lowest rate.
DSCR
20% down · 8.5% · 30yr
- Down + closing
- —
- Monthly P&I
- —
- Monthly cashflow
- —
- DSCR
- —
- Eligible?
- —
No personal income docs; deal must DSCR.
Hard money
10% down · 12.0% · 12mo
- Down + closing
- —
- Monthly P&I
- —
- Monthly cashflow
- —
- DSCR
- —
- Eligible?
- —
Short-term bridge; refi at stabilization.
Rent comps 6 comps
| Address | Beds | Baths | Sqft | Rent | $/sqft | DOM | Units | Dist |
|---|---|---|---|---|---|---|---|---|
| 1069 Becker Ave The Villages, FL | 3.0 | 2.0 | 1656 | $5,000 | $3.02 | 25d | 1 | 0.63mi |
| 3530 E Harbor Dr Fruitland Park, FL | 1.0–3.0 | 1.0–2.0 | 1061 | $2,014 | $1.90 | 0d | 36 | 0.72mi |
| 1609 Hoofprint Ct Fruitland Park, FL | 4.0 | 2.0 | 2128 | $2,191 | $1.03 | 6d | 1 | 0.80mi |
| 3225 Wise Way The Villages, FL | 3.0 | 2.0 | 1652 | $2,650 | $1.60 | 25d | 1 | 0.86mi |
| 2614 Dartford Ter The Villages, FL | 3.0 | 2.0 | 1685 | $1,995 | $1.18 | 23d | 1 | 1.32mi |
| 307 Willard Ave Fruitland Park, FL | 3.0 | 2.0 | 1796 | $1,881 | $1.05 | 14d | 1 | 1.44mi |
HOA detail
- Monthly dues
- $195 · $2,340/yr
Listing history 21 events
-
2026-06-21days on market $381,500 Active 72 DOM
-
2026-06-18days on market $381,500 Active 69 DOM
-
2026-06-17days on market $381,500 Active 68 DOM
-
2026-06-16days on market $381,500 Active 67 DOM
-
2026-06-15days on market $381,500 Active 66 DOM
-
2026-06-13days on market $381,500 Active 64 DOM
-
2026-06-09days on market $381,500 Active 60 DOM
-
2026-06-08days on market $381,500 Active 59 DOM
-
2026-06-07days on market $381,500 Active 58 DOM
-
2026-06-04days on market $381,500 Active 55 DOM
-
2026-06-03days on market $381,500 Active 54 DOM
-
2026-06-02days on market $381,500 Active 53 DOM
-
2026-06-01days on market $381,500 Active 52 DOM
-
2026-05-31days on market $381,500 Active 51 DOM
-
2026-04-10$381,500 Active
-
2024-11-21soldstatus $335,000
-
2018-05-18soldstatus $252,000
-
2018-05-09soldstatus $252,000 Sold 20-char remark
Show marketing remark (20 chars)
LIKE NEW BOUGIANVILA
-
2018-04-14status Pending 20-char remark
Show marketing remark (20 chars)
LIKE NEW BOUGIANVILA
-
2018-04-04$259,000 20-char remark
Show marketing remark (20 chars)
LIKE NEW BOUGIANVILA
-
2018-04-04historical 20-char remark
Show marketing remark (20 chars)
LIKE NEW BOUGIANVILA
ⓘ Source: listings_history table (triggers on properties + properties_extension) + one-shot
backfill from property_details.listing_events for pre-trigger history.
Tax reassessment forecast FL · Resets to sale price
- Current annual tax
- $8,079 · $673/mo
- Projected year-2 tax
- $8,079 · $673/mo
- Expected delta
- $0/yr ($0/mo · 0.0%)
ⓘ Screening estimate from a state-policy table — verify with the county assessor before closing.
Climate risk First Street
- Flood 1/10 Low FEMA zone X (unshaded) · 0% chance over 30 yrs
- Wildfire 4/10 Moderate
- Heat 9/10 Extreme 7 d/yr ≥108°F today · 24 d/yr by 30 yrs out
- Wind 9/10 Extreme 99% chance of damaging wind over 30 yrs
- Air quality 3/10 Moderate 2 unhealthy d/yr today · 4 by 30 yrs out
Nearby sold comps map
Loading sold comps map…
Walkable amenities ~0.75 mi
Loading nearby amenities…
Taxation est. · year 1
- Rental income
- $35,677
- − Mortgage interest
- −$21,370
- − Property taxes
- −$8,079
- − Insurance
- −$1,908
- − Repairs & maintenance
- −$2,854
- − Management
- −$2,854
- − HOA
- −$2,340
- − Depreciation
- −$11,098
- Taxable loss
- −$14,826
- Est. tax savings @ 24.0%
- +$3,558
- After-tax cash flow
- $-4,591/yr
For passive investors: Depreciation is non-cash, so a rental often shows a tax loss while cash-flowing — sheltering income. Rental losses are passive: they offset passive income freely, and up to $25,000/yr can offset ordinary (W-2) income if you actively participate and your MAGI is under $100k (phasing out to $0 by $150k); unused losses carry forward. On sale, claimed depreciation is recaptured at up to 25%, and gains may owe capital-gains tax (a 1031 exchange can defer both). Figures are a year-1 estimate at your 24.0% rate — not tax advice; consult a CPA.
Schools (NCES district)
- District
- Lake
- NCES district ID
- 1201050
- Math proficiency
- 49% ▼ -7.00%
- Reading proficiency
- 50% ▼ -4.00%
- Median HH income
- $46,632
- Composite
- 42.05/100
- National rank
- #3327
- State rank
- #37 of 73 in FL
Livability — Fruitland Park
- Score
- 70/100
- State rank
- #447
- US rank
- #8098
Category grades
Schools grade is shown separately in the Schools card above.
Census & demographics
- Census place
- Fruitland Park, FL
- County
- Sumter County · 110,591 people
- City population
- 12,196
- Metro
- The Villages, FL
- Population (ZIP)
- 28,549
- Household income
- $96,775
- Rent vs Own
- Severe rent burden
- 307.0
Population outlook (Lake County) Hauer SSP2
- Today (2025)
- 386,640 people
- By 2030
- 417,107 · +7.9%
- By 2040
- 476,676 · +23.3%
- By 2050
- 531,296 · +37.4%
- By 2075
- 648,303 · +67.7%
- By 2100
- 698,530 · +80.7%
Race, ethnicity, and origin ACS 2023
- Neighborhood character
- Predominantly White (95%)
- Race & ethnicity
- White 95% Two or more races 2% Hispanic / Latino 2% Asian 1%
- Common ancestry
- Romanian 6% Lithuanian 3% Iranian 3%
- Foreign-born
- 6% · Canada, Vietnam
- Languages at home
- 96% English-only · Spanish 2% Vietnamese 1% Other Indo-European 0%
Political lean MEDSL · Lake
- 2024 margin
- Strong R (+24.7) · D 37.3% · R 62.0%
- 2008→2024 swing
- -11.2pp toward R · 2008: -13.5pp · 2024: -24.7pp
- All cycles
- 2024: R+24.7 2020: R+20.0 2016: R+23.1 2012: R+17.1 2008: R+13.5
Not yet ingested
- Civics
- —
Market trends
- HPI YoY
- ▲ 20.47%
- Current HPI
- 229.0075
- Rent YoY
- —
- Metro
- The Villages, FL
- State GDP YoY
- ▲ 3.28%
- F500 in state
- 36
Industry mix (Fortune 500 HQ in FL)
| Industry | F500 HQs | Revenue |
|---|---|---|
| Industrial Technology | 2 | $29B |
|
||
| Insurance | 2 | $17B |
|
||
| Retail | 1 | $60B |
|
||
| Technology Distribution | 1 | $58B |
|
||
| Homebuilding | 1 | $35B |
|
||
| Technology Manufacturing | 1 | $35B |
|
||
Price history
+47.3% since first listed7 events — show timeline
- 2026-04-10 Listed $381,500 Stellar MLS as Distributed by MLS Grid
- 2024-11-21 Sold (Public Records) $335,000 Public Records
- 2018-05-18 Sold (Public Records) $252,000 Public Records
- 2018-05-09 Sold (MLS) $252,000 Stellar MLS as Distributed by MLS Grid
- 2018-04-14 Pending — Stellar MLS as Distributed by MLS Grid
- 2018-04-04 Listing Removed — Stellar MLS as Distributed by MLS Grid
- 2018-04-04 Listed $259,000 Stellar MLS as Distributed by MLS Grid
Property tax history
+13.0%/yrLatest (2025): $8,079 · +5.2% YoY. Source: county tax records.
Cash-flow waterfall
monthlySold comps — $/sqft
last 12 mo · ≤1 miLoading sold comps…