 Duplex
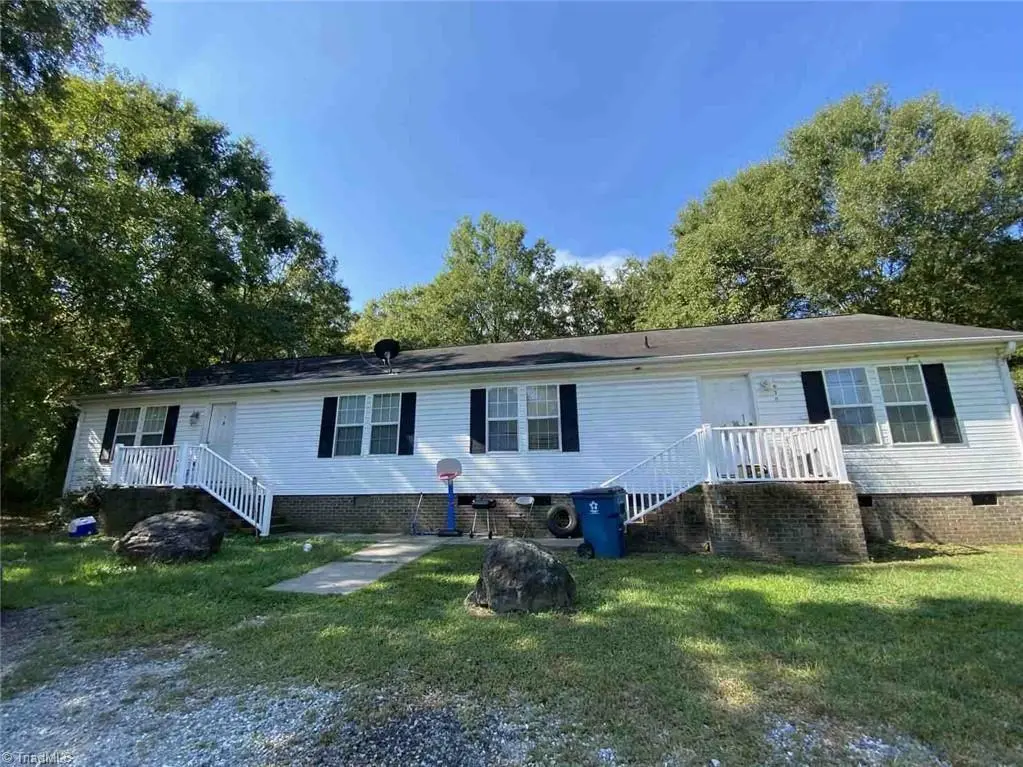
1928-1930 Durham St · Glen Raven, NC
Flood risk 1/10 · Minimal
- FEMA flood zone
- X (unshaded)
- Chance of flooding over 30 yrs
- 0.0%
- Est. flood insurance / yr
- $507 – $1,088
Fire risk 3/10 · Minor
- Est. fire insurance / yr
- $906 – $1,684
Heat risk 5/10 · Moderate
- Hot days now (above 104°F)
- 6 days/yr
- Hot days in 30 yrs
- 16 days/yr
Wind risk 5/10 · Moderate
- Chance of severe wind over 30 yrs
- 20.0%
Air-quality risk 2/10 · Minimal
- Unhealthy air days now
- 2 days/yr
- Unhealthy air days in 30 yrs
- 2 days/yr
Risk factors via First Street. Map © Google.
Why this score? — see what drove the D grade
The composite is a weighted blend of 9 inputs, each scored 0–100. Each bar is that input's sub-score; the figure is the points it added to the 100-point composite (weight × sub-score).
- Cash flow +14.7/30.0
- ARV discount +7.5/15.0
- DSCR +4.5/10.0
- 1% rule +4.1/10.0
- Livability +3.1/5.0
- Schools +3.0/10.0
- Rent growth +2.8/5.0
- Condition / age +2.2/5.0
- Appreciation +0.0/10.0
$279,900
🖨 Deal sheet (PDF) 📄 Offer letter ✓ Due diligence
Multi-family units
County records classify this as Multi-Family (2-4 Unit). Listing-text estimate: 2 units. confirmed
Listing remarks
Duplex for sale to the savvy investor! 1928 Durham St is currently rented for $1838/month (Lease expired 4/30/2026 and renter is month-to-month presently) and 1930 Durham St is currently rented for $1000/month (Lease expired 5/31/2026 and renter is also month-to-month presently). Buyers will need a LOI/POF to schedule a showing and plenty of advance notice.
Key facts
- 0.55 acre lot
- Built 2001
- Listed 17 days
Property features AI
Finance
- Other: Property listed with Coldwell Banker - HP&W; Directions available: From I-85 S take exit 145 for NC-49; right onto NC-49 N/Maple Ave; right onto S Mebane St; left onto E Webb Ave; right onto Elmira St; left onto Durham St; duplex is on the left.
- Financial info: Annual tax amount: $1,751.56
- HOA & community: No homeowners association
Exterior
- Parking: Driveway
- Utilities: Public water; Public sewer; Water heater: Unknown
- Home design: Residential income property (duplex); Built in 2001
- Exterior features: City lot; Lot dimensions approximately 129 x 194 x 119 x 196
Interior
- Heating & cooling: Cooling: Other; Heating: See remarks; Heating fuel: See remarks
- Interior features: No basement
Neighborhood map
What this means for you Summary
Snapshot
- This is a 2 × 2-bed/1-bath units multifamily listed at $280k. Condition is rated fair.
Deal economics
- At list price, monthly cash flow is $73 ($877/yr) — positive. Per door: $37/mo.
- The deal already cash-flows at list — no discount required.
- To meet the 1% rule (rent ≥ 1% of price), the offer needs to be $254k (9.2% below list).
- Recommended offer: $254k (9.2% below list) — sets the bar for 1% rule.
- Cap rate 6.6% vs local median 3.7% in Glen Raven — top-decile yield for the area; either an underpriced asset or a hidden risk that comps aren't pricing in. Stress-test before assuming the spread holds.
Location & tenants
- Location reads 62/100 on livability (#440 in NC) — a middle-class / working-renter tenant base. Strengths: cost of living A+, housing A+, crime A; Watch: health & safety C-, employment D, amenities F.
- Alamance-Burlington Schools (rural): math 30% / reading 40% proficiency, ranked #133 of 178 in NC (top 75%) — families likely to look elsewhere, expect single-tenant / working-renter base with shorter leases.
- Zoned schools: Marvin B Smith Elementary (math 44% / reading 56%, grade D+, #409 of 1,410 statewide, top 29%, 481 students, 52% FRL); Turrentine Middle (math 21% / reading 37%, grade F, #350 of 475 statewide, top 74%, 929 students, 68% FRL); Walter M Williams High (math 52% / reading 59%, grade C, #265 of 535 statewide, top 50%, 1,343 students, 58% FRL).
- Market conditions: Rents rising (+1.1%/yr); 275 active listings in the ZIP; 18 comparable units currently listed for rent nearby; rentals at typical pace (median 15d on market — plan ~3-4 weeks tenant-placement turnaround); 2,466 units permitted in Alamance County in 2024 (403 in 5+ unit buildings).
- At $2,541/mo this rent would consume 59% of the median local household income ($52k/yr) (locally 1040% of renters already pay >50% of income on rent) — very limited rent-growth headroom before tenants either downsize or default.
Forward outlook
- Local home prices are declining (-3.0%/yr); year-one equity from $2k of loan paydown is wiped out by about $8k of value loss. Plan a longer hold.
- Alamance County population projected at +19% by 2050 — long-run rental-demand tailwind backs the buy-and-hold thesis.
Negotiation context
- It's been on market 17 days — a 2% lower offer ($276k) is reasonable based on typical stale-listing flexibility.
- 5 sale attempts since 24y ago with the ask held roughly flat each time — persistent listings suggest the price (not the market) is what's stuck; bring a comps-based counter.
Risks & watch-outs
- Climate carrying-cost: moderate wind risk, 20% chance of damaging wind over 30y; extreme-heat days projected 6→16/yr by 2055 (HVAC capex compounding) — expect insurance premiums to compound above CPI over the hold.
Questions for the listing agent
- Can we see the unit-by-unit rent roll, current vacancy, and any below-market leases? What's the average tenancy length?
- What capital expenditures (roof, boiler, parking lot, exteriors) have been made in the last 5 years, and what's planned in the next 2?
- Have any recent inspections been done? Can we get a copy of the seller's disclosures and any deferred-maintenance estimates?
- Is there a deadline driving the sale (1031 exchange, divorce, estate, relocation)? That informs how much negotiation room exists.
- Schools are F-rated, which usually means shorter tenancies and higher turnover. Who's the typical renter profile here, and what's been the actual vacancy rate?
- The area grade is low — what's the realistic commute time and amenity access for the typical tenant pool here? Any planned neighborhood developments (good or bad) we should know about?
- What's the average days-on-market for RENTAL listings here right now (not sales)? A rising rental-DOM trend means longer vacancies and softer asking-rent achievability than the comps imply.
- What's the recent tenant-quality profile in this submarket — average credit score on applications, eviction rate, late-payment / NSF rate, and stable-employment percentage? A property-management company in the area should have these aggregated.
- How much new apartment / multifamily construction is in the pipeline within 1–3 miles? Heavy new supply (>2% of stock underway) typically softens rents 12–24 months out; light construction supports rent growth.
Investment metrics
- 1% rule
- 0.91% ✗
- Cap rate
- 6.61%
- Cash-on-cash
- 1.12%
- DSCR
- 1.05
- GRM
- 9.2
CMA / ARV
No comps found within radius.
Show comp detail 1 sale within ~0.75 mi
| Address | Dist | Beds/Ba | Sqft | Sold | Price | $/sf | Match |
|---|---|---|---|---|---|---|---|
| 2252-2254 Pinecroft Dr | 0.55mi | 6/4.0 | 2,632 | 21mo | $455,000 | $173 | 44 |
Match score weights: distance 35% · size 25% · config 20% · recency 20%. Top-matched comps best support the ARV.
Projected returns pro-forma
-3.0% appreciation · 1.06% rent growth · sell at horizon
- IRR
- -16.7%
- Equity multiple
- 0.42×
- Total profit
- $-45,530
- Equity at exit
- $41,734
- IRR
- -12.5%
- Equity multiple
- 0.33×
- Total profit
- $-52,703
- Equity at exit
- $24,201
Cash invested: $78,372 (down + closing). Projections, not guarantees.
Landlord ↔ Tenant lean methodology
- Overall (STATE)
- 85 Strongly Landlord-Friendly
- State North Carolina
- 85 Strongly Landlord-Friendly · R+3
- County
- — inherits STATE
- City
- — inherits STATE
ZIP-level market 27217
- Home prices YoY
- -22.3%
- Rents YoY
- 1.1%
- Active inventory
- 275
- Price-to-rent
- 18.4×
Monthly cashflow live
- Estimated rent
- $2,541 high interval (Pro) →
- Mortgage (P&I)
- −$1,468
- Tax est. 1.5%
- −$350 /mo · $4,198/yr
- Insurance
- −$117
- HOA
- −$0
- Vacancy / Maint / Mgmt
- −$534
- Net cashflow
- $73
Break-even live
Sensitivity live
| Price | -10% $266 | -5% $170 | +0% $73 | +5% $-24 | +10% $-120 |
|---|---|---|---|---|---|
| Rent | -10% $-128 | -5% $-27 | +0% $73 | +5% $173 | +10% $274 |
| Rate | -1.0pp $214 | -0.5pp $144 | base $73 | +0.5pp $1 | +1.0pp $-73 |
2-unit breakdown (identical units grouped — click to expand)
| Units | Beds | Baths | Est. rent |
|---|---|---|---|
| 2× units | 2 | 1 | $2,540 |
| #1 | 2 | 1 | $1,270 |
| #2 | 2 | 1 | $1,270 |
| Total (2 units) | $2,541 | ||
UW: 25.0% down · 7.5% · 30yr · 1.5% tax · 5.0% vac · 8.0% maint · 8.0% mgmt
Financing live
Cash to close
- Down payment
- $69,975
- Closing costs
- $8,397
- Reserves months
- —
- Total cash needed
- —
Loan-product check · same deal, 3 products live
Conventional
25% down · 7.5% · 30yr
- Down + closing
- —
- Monthly P&I
- —
- Monthly cashflow
- —
- DSCR
- —
- Eligible?
- —
Personal DTI + credit; lowest rate.
DSCR
20% down · 8.5% · 30yr
- Down + closing
- —
- Monthly P&I
- —
- Monthly cashflow
- —
- DSCR
- —
- Eligible?
- —
No personal income docs; deal must DSCR.
Hard money
10% down · 12.0% · 12mo
- Down + closing
- —
- Monthly P&I
- —
- Monthly cashflow
- —
- DSCR
- —
- Eligible?
- —
Short-term bridge; refi at stabilization.
Rent comps 18 comps
| Address | Beds | Baths | Sqft | Rent | $/sqft | DOM | Units | Dist |
|---|---|---|---|---|---|---|---|---|
| 1615 Cadiz St Burlington, NC | 2.0 | 1.0 | 1100 | $1,200 | $1.09 | 23d | 1 | 0.49mi |
| 1331 Elm St Burlington, NC | 3.0 | 1.0 | 950 | $1,475 | $1.55 | 23d | 1 | 0.70mi |
| 317 Caswell St Unit 2 Burlington, NC | 1.0 | 1.0 | 650 | $750 | $1.15 | 23d | 1 | 0.73mi |
| 1322 Elm St Burlington, NC | 3.0 | 1.5 | 848 | $1,550 | $1.83 | 15d | 1 | 0.76mi |
| 1106 Attica St Burlington, NC | 3.0 | 2.0 | 1500 | $1,750 | $1.17 | 15d | 1 | 1.00mi |
| 1013 Attica St Burlington, NC | 2.0 | 1.0 | 855 | $1,245 | $1.46 | 15d | 1 | 1.03mi |
| 143 Emerson Point Dr Elon, NC | 2.0 | 2.0 | 1110 | $1,400 | $1.26 | 15d | 1 | 1.08mi |
| 1128 Ava St Burlington, NC | 2.0 | 1.0 | 900 | $1,200 | $1.33 | 15d | 1 | 1.12mi |
| 654 Lakeside Ave Unit 654 Burlington, NC | 2.0 | 1.0 | 830 | $1,125 | $1.36 | 15d | 1 | 1.20mi |
| 302 Campus Walk Trl #201 Elon, NC | 3.0 | 3.0 | 1500 | $1,600 | $1.07 | 15d | 1 | 1.23mi |
| 100 Campus Walk Trl Rm 3 Elon, NC | 1.0 | 1.0 | — | $575 | — | 15d | 1 | 1.24mi |
| 929 E Haggard Ave Elon, NC | 2.0 | 1.0 | 1088 | $1,575 | $1.45 | 23d | 1 | 1.24mi |
| 102 Campus Walk Trl Rm 3 Elon, NC | 1.0 | 1.0 | — | $575 | — | 15d | 1 | 1.26mi |
| 1000 Camden St Burlington, NC | 2.0 | 1.0 | 600 | $1,095 | $1.82 | 15d | 1 | 1.31mi |
| 525 Lakeside Ave Burlington, NC | 3.0 | 1.0 | 975 | $1,300 | $1.33 | 23d | 1 | 1.34mi |
| 917 E Haggard Ave Elon, NC | 2.0 | 1.0 | — | $1,225 | — | 15d | 1 | 1.34mi |
| 1515 Woodland Ave Burlington, NC | 3.0 | 2.0 | 1101 | $1,500 | $1.36 | 15d | 1 | 1.47mi |
| 1121 Jackson St Burlington, NC | 2.0 | 1.0 | — | $995 | — | 23d | 1 | 1.47mi |
Listing history 14 events
-
2026-06-22days on market $279,900 Active 17 DOM
-
2026-06-19days on market $279,900 Active 15 DOM
-
2026-06-18days on market $279,900 Active 14 DOM
-
2026-06-17days on market $279,900 Active 13 DOM
-
2026-06-16days on market $279,900 Active 12 DOM
-
2026-06-15days on market $279,900 Active 11 DOM
-
2026-06-14days on market $279,900 Active 9 DOM
-
2026-06-13days on market $279,900 Active 8 DOM
-
2026-06-10days on market $279,900 Active 6 DOM
-
2026-06-09days on market $279,900 Active 5 DOM
-
2026-06-08days on market $279,900 Active 4 DOM
-
2026-06-07days on market $279,900 Active 3 DOM
-
2026-06-05remarks 359-char remark
-
2026-06-05$279,900 Active 1 DOM
ⓘ Source: listings_history table (triggers on properties + properties_extension) + one-shot
backfill from property_details.listing_events for pre-trigger history.
Climate risk First Street
- Flood 1/10 Low FEMA zone X (unshaded) · 0% chance over 30 yrs
- Wildfire 3/10 Moderate
- Heat 5/10 Major 6 d/yr ≥104°F today · 16 d/yr by 30 yrs out
- Wind 5/10 Major 20% chance of damaging wind over 30 yrs
- Air quality 2/10 Low 2 unhealthy d/yr today · 2 by 30 yrs out
Nearby sold comps map
Loading sold comps map…
Walkable amenities ~0.75 mi
Loading nearby amenities…
Taxation est. · year 1
- Rental income
- $30,492
- − Mortgage interest
- −$15,679
- − Property taxes
- −$4,198
- − Insurance
- −$1,400
- − Repairs & maintenance
- −$2,439
- − Management
- −$2,439
- − Depreciation
- −$8,143
- Taxable loss
- −$3,806
- Est. tax savings @ 24.0%
- +$913
- After-tax cash flow
- $1,790/yr
For passive investors: Depreciation is non-cash, so a rental often shows a tax loss while cash-flowing — sheltering income. Rental losses are passive: they offset passive income freely, and up to $25,000/yr can offset ordinary (W-2) income if you actively participate and your MAGI is under $100k (phasing out to $0 by $150k); unused losses carry forward. On sale, claimed depreciation is recaptured at up to 25%, and gains may owe capital-gains tax (a 1031 exchange can defer both). Figures are a year-1 estimate at your 24.0% rate — not tax advice; consult a CPA.
Condition & rehab AI · 2 photos
This multi-family property requires significant repairs and updates to its roof, siding, flooring, interior walls, HVAC, and landscaping to improve its condition and value.
Repairs flagged
- Major roof — Signs of wear and discoloration suggest significant damage and potential leaks.
- Major siding — The siding is visibly worn and may need repainting or replacement.
- Major flooring — The exterior flooring is in poor condition and may need repair or replacement.
- Major interior walls/paint — The interior walls and paint are in poor condition and may need repainting.
- Major HVAC/mechanicals — The HVAC units appear old and may need replacement or repair.
- Major landscaping — The landscaping is overgrown and requires trimming and maintenance to improve curb appeal.
Value-add opportunities
- Both roof replacement — Replacing the roof would significantly improve the home's condition and appeal.
- Both siding and painting — Updating the siding and painting would enhance the home's curb appeal and value.
- Both HVAC replacement — Replacing the HVAC units would improve comfort and energy efficiency, benefiting both resale and rental value.
- Both landscaping and curb appeal — Trimming and maintaining the landscaping would improve the home's curb appeal and attract potential buyers/renters.
Renovation cost estimate screening
| Repair item | Severity | Est. cost |
|---|---|---|
| roof · Signs of wear and discoloration suggest significant damage and potential leaks. | Major | $15,000–50,000 |
| siding · The siding is visibly worn and may need repainting or replacement. | Major | $15,000–50,000 |
| flooring · The exterior flooring is in poor condition and may need repair or replacement. | Major | $15,000–50,000 |
| interior walls/paint · The interior walls and paint are in poor condition and may need repainting. | Major | $15,000–50,000 |
| HVAC/mechanicals · The HVAC units appear old and may need replacement or repair. | Major | $15,000–50,000 |
| landscaping · The landscaping is overgrown and requires trimming and maintenance to improve curb appeal. | Major | $15,000–50,000 |
| Total estimated repair cost · 6 items | $90,000–300,000 |
Value-add ROI direction
- Both roof replacement — Replacing the roof would significantly improve the home's condition and appeal. ↑
- Both siding and painting — Updating the siding and painting would enhance the home's curb appeal and value. ↑
- Both HVAC replacement — Replacing the HVAC units would improve comfort and energy efficiency, benefiting both resale and rental value. ↑
- Both landscaping and curb appeal — Trimming and maintaining the landscaping would improve the home's curb appeal and attract potential buyers/renters. ↑
ⓘ Cost ranges are severity-bucket heuristics (US national rule-of-thumb). Get contractor quotes + a written scope before underwriting a rehab budget.
Schools (NCES district)
- District
- Alamance-Burlington Schools
- NCES district ID
- 3700030
- Math proficiency
- 30% ▼ -6.00%
- Reading proficiency
- 40% ▲ 2.00%
- Median HH income
- $43,359
- Composite
- 29.68/100
- National rank
- #6460
- State rank
- #133 of 178 in NC
Livability — Glen Raven
- Score
- 62/100
- State rank
- #440
- US rank
- #16208
Category grades
Schools grade is shown separately in the Schools card above.
Census & demographics
- Census place
- Glen Raven, NC
- County
- Alamance County · 173,369 people
- Metro
- Burlington, NC
- Population (ZIP)
- 41,406
- Household income
- $51,950
- Rent vs Own
- Severe rent burden
- 1040.0
Population outlook (Alamance County) Hauer SSP2
- Today (2025)
- 173,381 people
- By 2030
- 180,609 · +4.2%
- By 2040
- 194,327 · +12.1%
- By 2050
- 206,158 · +18.9%
- By 2075
- 235,665 · +35.9%
- By 2100
- 258,626 · +49.2%
Race, ethnicity, and origin ACS 2023
- Neighborhood character
- Diverse neighborhood (Simpson 0.69)
- Race & ethnicity
- White 38% Black 29% Hispanic / Latino 29% Two or more races 7% Native American 1%
- Hispanic origin (detail)
- Mexican 19% Puerto Rican 1%
- Common ancestry
- Serbian 2% Italian 1% Slovak 1%
- Foreign-born
- 13% · Canada
- Languages at home
- 75% English-only · Spanish 24%
Political lean MEDSL · Alamance
- 2024 margin
- Lean R (+8.2) · D 45.4% · R 53.5% · Other 1.1%
- 2008→2024 swing
- +1.1pp toward D · 2008: -9.2pp · 2024: -8.2pp
- All cycles
- 2024: R+8.2 2020: R+8.4 2016: R+12.9 2012: R+14.1 2008: R+9.2
Not yet ingested
- Civics
- —
Market trends
- HPI YoY
- ▼ -74.45%
- Current HPI
- 259.8107
- Rent YoY
- ▲ 1.06%
- Metro
- Burlington, NC
- State GDP YoY
- ▲ 3.28%
- F500 in state
- 26
Industry mix (Fortune 500 HQ in NC)
| Industry | F500 HQs | Revenue |
|---|---|---|
| Financial Services | 2 | $213B |
|
||
| Retail | 2 | $95B |
|
||
| Industrial Conglomerate | 1 | $38B |
|
||
| Metals / Steel | 1 | $35B |
|
||
| Utilities | 1 | $30B |
|
||
| Industrial Machinery | 1 | $19B |
|
||
Price history
+201.3% since first listed9 events — show timeline
- 2026-06-04 Listed $279,900 Triad MLS
- 2008-11-21 Listing Removed — TMLS
- 2007-12-11 Listed $129,900 TMLS
- 2007-11-21 Listing Removed — TMLS
- 2007-05-21 Listed $125,000 TMLS
- 2005-02-28 Listing Removed — TMLS
- 2004-11-13 Listed $159,900 TMLS
- 2002-08-15 Listing Removed — TMLS
- 2002-02-15 Listed $92,900 TMLS
Cash-flow waterfall
monthlySold comps — $/sqft
last 12 mo · ≤1 miLoading sold comps…