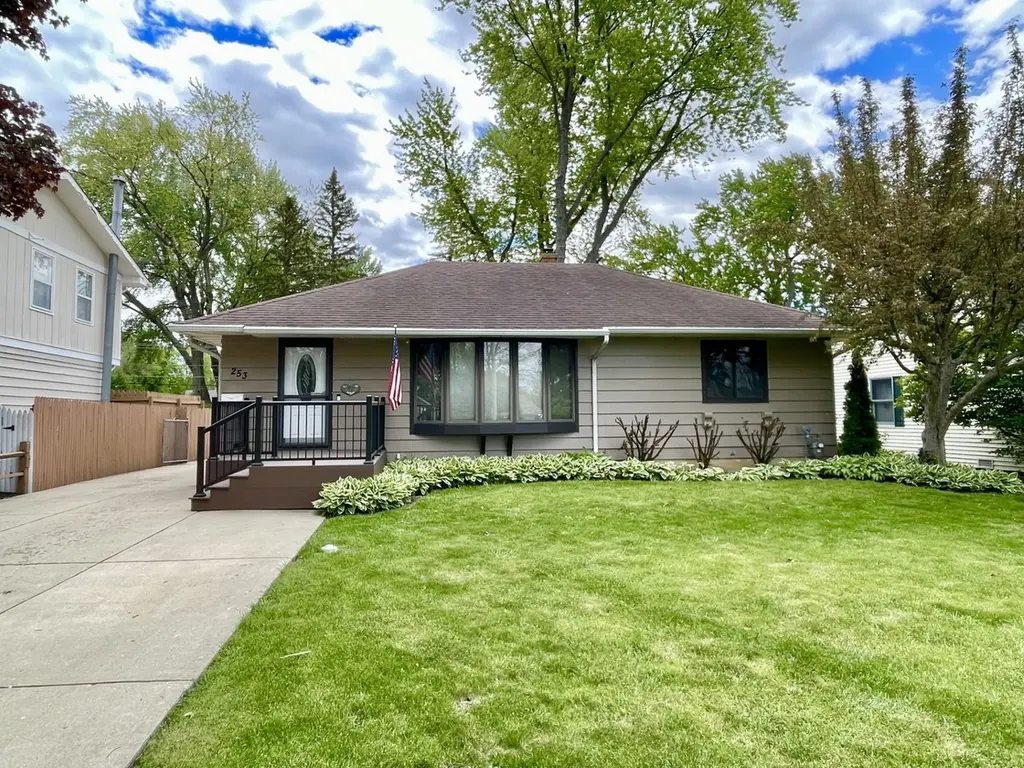
253 Heather Ave · Grayslake, IL
Flood risk 1/10 · Minimal
- FEMA flood zone
- X (unshaded)
- Chance of flooding over 30 yrs
- 0.0%
- Est. flood insurance / yr
- $473 – $860
Fire risk 2/10 · Minimal
- Est. fire insurance / yr
- $804 – $1,492
Heat risk 2/10 · Minimal
- Hot days now (above 100°F)
- 7 days/yr
- Hot days in 30 yrs
- 14 days/yr
Wind risk 2/10 · Minimal
- Chance of severe wind over 30 yrs
- —
Air-quality risk 3/10 · Minor
- Unhealthy air days now
- 3 days/yr
- Unhealthy air days in 30 yrs
- 3 days/yr
Risk factors via First Street. Map © Google.
Why this score? — see what drove the F grade
The composite is a weighted blend of 9 inputs, each scored 0–100. Each bar is that input's sub-score; the figure is the points it added to the 100-point composite (weight × sub-score).
- ARV discount +4.6/15.0
- Livability +4.5/5.0
- Rent growth +4.3/5.0
- Cash flow +4.2/30.0
- Schools +3.9/10.0
- Condition / age +2.5/5.0
- 1% rule +1.2/10.0
- DSCR +0.0/10.0
- Appreciation +0.0/10.0
$310,000
🖨 Deal sheet 📄 Offer letter ✓ Due diligence
Listing remarks
This charming 3-bedroom home, plus an additional bedroom in the basement, offers 2 full baths, a fully finished basement, and a 2 1/2-car detached garage. Filled with warmth, love, and decades of beautiful memories, this home was the backdrop for raising four children, and you can truly feel the pride, joy, and positive energy throughout every space. From cozy gatherings to milestone moments, this home has been beautifully lived in and deeply loved. Tucked into the heart of The Manor, this beloved home is just two blocks from picturesque Manor Lake, where this family spent countless summer days making lifelong memories. Enjoy peaceful walks along the scenic path surrounding the lake, mornin
Key facts
- 8,363 sq ft lot
- 2 garage spots
- Community pool
Neighborhood map
What this means for you Summary
Snapshot
- This is a 2-bed/1.0-bath single-family listed at $310k.
Deal economics
- At list price, monthly cash flow is $-835 ($-10k/yr) — negative.
- To cash-flow at today's rent, offer at most $163k (47.6% below list).
- To meet the 1% rule (rent ≥ 1% of price), the offer needs to be $191k (38.4% below list).
- Recommended offer: $163k (47.6% below list) — sets the bar for cash-flow.
Location & tenants
- Location reads 90/100 on livability (#4 in IL, #85 nationally) — a professional / high-income tenant draw. Strengths: crime A+, commute A+, employment A+.
- Grayslake Chsd 127 (suburban): math 40% / reading 44% proficiency, ranked #95 of 620 in IL (top 15%) — families likely to look elsewhere, expect single-tenant / working-renter base with shorter leases.
- Zoned schools: Grayslake Central High School (math 43% / reading 46%, grade F, #62 of 693 statewide, top 10%, 1,419 students, 0% FRL).
- Market conditions: Rents rising fast (+7.1%/yr); 89 active listings in the ZIP; 8 comparable units currently listed for rent nearby; rentals leasing fast (median 7d on market — plan ~1-2 weeks tenant-placement turnaround); solid renter incomes; 948 units permitted in Lake County in 2024 (424 in 5+ unit buildings).
Forward outlook
- Local home prices are declining (-3.0%/yr); year-one equity from $2k of loan paydown is wiped out by about $9k of value loss. Plan a longer hold.
- Lake County population projected to shrink 8% by 2050 — rents likely to lag national; underwrite the cash flow, not the appreciation.
Negotiation context
- Only 14 days on market — expect competitive offers; lowballing is unlikely to land.
- Current owner paid $65k; list at $310k implies a 377% gain — meaningful room to come down on a strong offer.
Risks & watch-outs
- Watch-outs: built in 1955 — expect roof / HVAC / electrical / plumbing capex.
Questions for the listing agent
- What do current leases actually rent for vs. the listed asking? Can we see a recent rent roll and the last 12 months of T-12 income?
- Built in 1955 — when were the roof, HVAC, electrical panel, plumbing, and water heater last replaced?
- Is there a deadline driving the sale (1031 exchange, divorce, estate, relocation)? That informs how much negotiation room exists.
- Schools are B-rated — typically a magnet for longer-tenancy family renters. What's the average tenant stay here, and is there a school-zone premium baked into asking?
- The area grade is low — what's the realistic commute time and amenity access for the typical tenant pool here? Any planned neighborhood developments (good or bad) we should know about?
- What's the average days-on-market for RENTAL listings here right now (not sales)? A rising rental-DOM trend means longer vacancies and softer asking-rent achievability than the comps imply.
- What's the recent tenant-quality profile in this submarket — average credit score on applications, eviction rate, late-payment / NSF rate, and stable-employment percentage? A property-management company in the area should have these aggregated.
- How much new for-sale + rental construction is in the pipeline within 1–3 miles? Heavy new supply typically softens prices + rents 12–24 months out; constrained supply supports both.
Investment metrics
- 1% rule
- 0.62% ✗
- Cap rate
- 3.06%
- Cash-on-cash
- -11.54%
- DSCR
- 0.49
- GRM
- 13.5
CMA / ARV
- ARV (on-the-fly)
- $291,200
- Comps found
- 12
Show comp detail 12 sales within ~0.75 mi
| Address | Dist | Beds/Ba | Sqft | Sold | Price | $/sf | Match |
|---|---|---|---|---|---|---|---|
| 250 Normandy Ln | 0.16mi | 3/1.0 (+1) | 1,005 (-3%) | 13mo | $283,000 | $282 | 71 |
| 418 Flanders Ln | 0.38mi | 3/1.0 (+1) | 1,056 (+2%) | 5mo | $258,000 | $244 | 71 |
| 262 Normandy Ln | 0.16mi | 3/1.5 (+1) | 1,144 (+10%) | 0mo | $320,000 | $280 | 69 |
| 307 Highland Rd | 0.10mi | 2/1.0 | 910 (-12%) | 11mo | $280,000 | $308 | 65 |
| 241 Highland Rd | 0.07mi | 3/1.0 (+1) | 960 (-8%) | 21mo | $270,000 | $281 | 62 |
| 265 Heather Ave | 0.02mi | 3/1.0 (+1) | 1,152 (+11%) | 17mo | $260,000 | $226 | 62 |
| 219 Carol Ln | 0.27mi | 3/2.0 (+1) | 896 (-14%) | 3mo | $303,500 | $339 | 53 |
| 367 N Lake St | 0.58mi | 2/1.0 | 894 (-14%) | 1mo | $291,800 | $326 | 49 |
| 131 School St | 0.74mi | 3/1.0 (+1) | 1,080 (+4%) | 12mo | $279,000 | $258 | 44 |
| 346 Mitchell Dr | 0.74mi | 3/1.0 (+1) | 1,150 (+11%) | 2mo | $315,000 | $274 | 41 |
| 73 Harvey Ave | 0.75mi | 2/1.5 | 1,167 (+12%) | 6mo | $316,000 | $271 | 38 |
| 312 Briargate Dr | 0.29mi | 3/2.0 (+1) | 1,176 (+13%) | 22mo | $275,000 | $234 | 37 |
Match score weights: distance 35% · size 25% · config 20% · recency 20%. Top-matched comps best support the ARV.
Projected returns pro-forma
-3.0% appreciation · 7.08% rent growth · sell at horizon
- IRR
- -32.4%
- Equity multiple
- -0.10×
- Total profit
- $-95,071
- Equity at exit
- $46,222
- IRR
- -21.6%
- Equity multiple
- -0.32×
- Total profit
- $-114,164
- Equity at exit
- $26,803
Cash invested: $86,800 (down + closing). Projections, not guarantees.
Landlord ↔ Tenant lean methodology
- Overall (STATE)
- 43 Moderately Tenant-Leaning
- State Illinois
- 43 Moderately Tenant-Leaning · D+7
- County
- — inherits STATE
- City
- — inherits STATE
ZIP-level market 60030
- Rents YoY
- 7.1%
- Active inventory
- 89
- Price-to-rent
- 13.5×
Monthly cashflow live
- Estimated rent
- $1,911 high interval (Pro) →
- Mortgage (P&I)
- −$1,626
- Tax from tax record
- −$589 /mo · $7,070/yr
- Insurance
- −$129
- HOA
- −$0
- Vacancy / Maint / Mgmt
- −$401
- Net cashflow
- $-835
Break-even live
UW: 25.0% down · 7.5% · 30yr · 1.5% tax · 5.0% vac · 8.0% maint · 8.0% mgmt
Financing live
Cash to close
- Down payment
- $77,500
- Closing costs
- $9,300
- Reserves months
- —
- Total cash needed
- —
Loan-product check · same deal, 3 products live
Conventional
25% down · 7.5% · 30yr
- Down + closing
- —
- Monthly P&I
- —
- Monthly cashflow
- —
- DSCR
- —
- Eligible?
- —
Personal DTI + credit; lowest rate.
DSCR
20% down · 8.5% · 30yr
- Down + closing
- —
- Monthly P&I
- —
- Monthly cashflow
- —
- DSCR
- —
- Eligible?
- —
No personal income docs; deal must DSCR.
Hard money
10% down · 12.0% · 12mo
- Down + closing
- —
- Monthly P&I
- —
- Monthly cashflow
- —
- DSCR
- —
- Eligible?
- —
Short-term bridge; refi at stabilization.
Rent comps 8 comps
| Address | Beds | Baths | Sqft | Rent | $/sqft | DOM | Units | Dist |
|---|---|---|---|---|---|---|---|---|
| 720 Brittany Sq Grayslake, IL | 1.0–2.0 | 1.0 | 850 | $1,695 | $1.99 | 1d | 5 | 0.40mi |
| 575 Berry Ave Unit 1D Grayslake, IL | 1.0 | 1.0 | 700 | $1,350 | $1.93 | 2d | 1 | 0.44mi |
| 575 Berry Ave Unit 2B Grayslake, IL | 1.0 | 1.0 | 700 | $1,350 | $1.93 | 24d | 1 | 0.44mi |
| 62 Pine St Unit A Grayslake, IL | 3.0 | 2.0 | 1400 | $2,790 | $1.99 | 7d | 1 | 0.66mi |
| 84 W Belvidere Rd Grayslake, IL | 2.0 | 1.0 | 808 | $2,250 | $2.78 | 7d | 1 | 1.23mi |
| 108 E Big Horn Dr Hainesville, IL | 3.0 | 1.5 | 1228 | $2,600 | $2.12 | 1d | 1 | 1.30mi |
| 378 Tower Dr #378 Hainesville, IL | 3.0 | 2.5 | 1488 | $2,600 | $1.75 | 11d | 1 | 1.34mi |
| 145 Glen St Grayslake, IL | 2.0 | 1.0 | 880 | $1,672 | $1.90 | 1d | 2 | 1.46mi |
Listing history 10 events
-
2026-06-13statusdays on market $310,000 Pending 14 DOM
-
2026-06-09days on market $310,000 Contingent - Continue to Show 12 DOM
-
2026-06-08days on market $310,000 Contingent - Continue to Show 11 DOM
-
2026-06-07days on market $310,000 Contingent - Continue to Show 10 DOM
-
2026-06-04days on market $310,000 Contingent - Continue to Show 7 DOM
-
2026-06-03days on market $310,000 Contingent - Continue to Show 6 DOM
-
2026-06-02statusdays on market $310,000 Contingent - Continue to Show 5 DOM
-
2026-06-01days on market $310,000 Active 4 DOM
-
2026-05-31days on market $310,000 Active 3 DOM
-
1985-03-01soldstatus $65,000
ⓘ Source: listings_history table (triggers on properties + properties_extension) + one-shot
backfill from property_details.listing_events for pre-trigger history.
Tax reassessment forecast IL · Partial reset (capped growth)
- Current annual tax
- $7,070 · $589/mo
- Projected year-2 tax
- $7,070 · $589/mo
- Expected delta
- $0/yr ($0/mo · 0.0%)
ⓘ Screening estimate from a state-policy table — verify with the county assessor before closing.
Climate risk First Street
- Flood 1/10 Low FEMA zone X (unshaded) · 0% chance over 30 yrs
- Wildfire 2/10 Low
- Heat 2/10 Low 7 d/yr ≥100°F today · 14 d/yr by 30 yrs out
- Wind 2/10 Low
- Air quality 3/10 Moderate 3 unhealthy d/yr today · 3 by 30 yrs out
Nearby sold comps map
Loading sold comps map…
Walkable amenities ~0.75 mi
Loading nearby amenities…
Taxation est. · year 1
- Rental income
- $22,927
- − Mortgage interest
- −$17,365
- − Property taxes
- −$7,070
- − Insurance
- −$1,550
- − Repairs & maintenance
- −$1,834
- − Management
- −$1,834
- − Depreciation
- −$9,018
- Taxable loss
- −$15,744
- Est. tax savings @ 24.0%
- +$3,778
- After-tax cash flow
- $-6,237/yr
For passive investors: Depreciation is non-cash, so a rental often shows a tax loss while cash-flowing — sheltering income. Rental losses are passive: they offset passive income freely, and up to $25,000/yr can offset ordinary (W-2) income if you actively participate and your MAGI is under $100k (phasing out to $0 by $150k); unused losses carry forward. On sale, claimed depreciation is recaptured at up to 25%, and gains may owe capital-gains tax (a 1031 exchange can defer both). Figures are a year-1 estimate at your 24.0% rate — not tax advice; consult a CPA.
Schools (NCES district)
- District
- Grayslake Chsd 127
- NCES district ID
- 1717550
- Math proficiency
- 40% ▼ -7.00%
- Reading proficiency
- 44% ▼ -9.00%
- Median HH income
- $84,295
- Composite
- 39.42/100
- National rank
- #3963
- State rank
- #95 of 620 in IL
Livability — Grayslake
- Score
- 90/100
- State rank
- #4
- US rank
- #85
Category grades
Schools grade is shown separately in the Schools card above.
Census & demographics
- Census place
- Grayslake, IL
- County
- Lake County · 591,991 people
- City population
- 35,792
- Metro
- Chicago-Naperville-Elgin, IL-IN-WI
- Population (ZIP)
- 35,792
- Household income
- $104,795
- Rent vs Own
- Severe rent burden
- 589.0
Population outlook (Lake County) Hauer SSP2
- Today (2025)
- 700,217 people
- By 2030
- 693,290 · -1.0%
- By 2040
- 673,588 · -3.8%
- By 2050
- 643,556 · -8.1%
- By 2075
- 562,792 · -19.6%
- By 2100
- 457,715 · -34.6%
Race, ethnicity, and origin ACS 2023
- Neighborhood character
- Predominantly White (74%)
- Race & ethnicity
- White 74% Hispanic / Latino 11% Two or more races 9% Black 7% Asian 4%
- Hispanic origin (detail)
- Mexican 7% Puerto Rican 2%
- Common ancestry
- Romanian 11% Portuguese 2% Lithuanian 2%
- Foreign-born
- 10% · Canada, China
- Languages at home
- 85% English-only · Spanish 7% Russian/Polish/Slavic 2% Other Indo-European 1%
Political lean MEDSL · Lake
- 2024 margin
- Strong D (+20.8) · D 59.7% · R 38.9% · Other 1.4%
- 2008→2024 swing
- +1.1pp toward D · 2008: 19.6pp · 2024: 20.8pp
- All cycles
- 2024: D+20.8 2020: D+24.1 2016: D+20.3 2012: D+8.1 2008: D+19.6
Not yet ingested
- Civics
- —
Market trends
- HPI YoY
- ▼ -118.09%
- Current HPI
- 200.6576
- Rent YoY
- ▲ 7.08%
- Metro
- Chicago-Naperville-Elgin, IL-IN-WI
- State GDP YoY
- ▲ 1.59%
- F500 in state
- 60
Industry mix (Fortune 500 HQ in IL)
| Industry | F500 HQs | Revenue |
|---|---|---|
| Insurance | 4 | $201B |
|
||
| Consumer Goods | 4 | $87B |
|
||
| Industrial Machinery | 3 | $64B |
|
||
| Healthcare | 2 | $55B |
|
||
| Retail / Pharmacy | 1 | $148B |
|
||
| Agriculture / Food | 1 | $86B |
|
||
Price history
1 event — show timeline
- 1985-03-01 Sold (Public Records) $65,000 Public Records
Property tax history
+2.7%/yrLatest (2024): $7,070 · +5.2% YoY. Source: county tax records.
Cash-flow waterfall
monthlySold comps — $/sqft
last 12 mo · ≤1 miLoading sold comps…