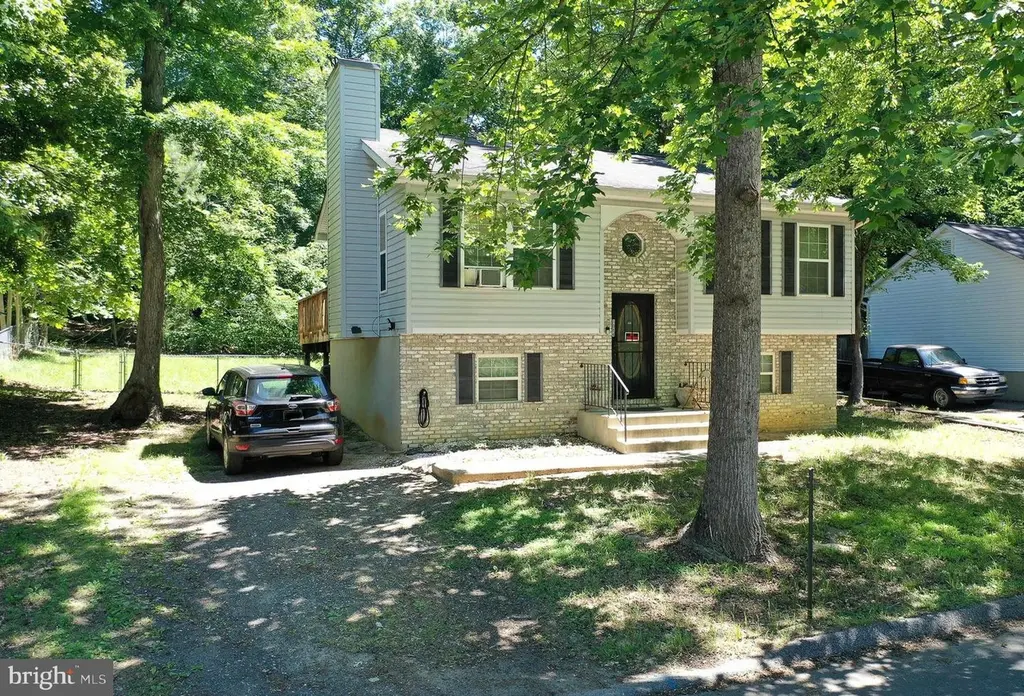
1084 Rimrock Rd · Chesapeake Ranch Estates, MD
Flood risk 1/10 · Minimal
- FEMA flood zone
- X (unshaded)
- Chance of flooding over 30 yrs
- 0.0%
- Est. flood insurance / yr
- $473 – $860
Fire risk 3/10 · Minor
- Est. fire insurance / yr
- $755 – $1,403
Heat risk 9/10 · Severe
- Hot days now (above 101°F)
- 7 days/yr
- Hot days in 30 yrs
- 17 days/yr
Wind risk 7/10 · Major
- Chance of severe wind over 30 yrs
- 79.0%
Air-quality risk 3/10 · Minor
- Unhealthy air days now
- 2 days/yr
- Unhealthy air days in 30 yrs
- 3 days/yr
Risk factors via First Street. Map © Google.
Why this score? — see what drove the D+ grade
The composite is a weighted blend of 9 inputs, each scored 0–100. Each bar is that input's sub-score; the figure is the points it added to the 100-point composite (weight × sub-score).
- ARV discount +15.0/15.0
- Cash flow +13.5/30.0
- DSCR +4.1/10.0
- 1% rule +3.6/10.0
- Schools +3.3/10.0
- Livability +3.3/5.0
- Rent growth +2.5/5.0
- Condition / age +2.5/5.0
- Appreciation +0.0/10.0
$276,000
🖨 Deal sheet 📄 Offer letter ✓ Due diligence
Listing remarks
Great opportunity to own a home in an amenity-filled community! This home will shine like new with a little TLC, like fresh paint, new carpet, and heat pump repair. (currently not working but owner has not had it looked at). Priced to sell and being sold in "AS-IS" Condition. Other than that, the home is in great condition. On the main floor, you have two bedrooms and a full hall bath. There is a generous-sized eat-in kitchen with plenty of table space and a walk out to the large rear deck overlooking a wooded backyard for privacy. The family room is just off the kitchen and is compete with a wood burning fireplace. The lower level is complete with an additional Rec room, laundry
Key facts
- 0.25 acre lot
- 2 parking spots
- Built 1995
Property features AI
Finance
- HOA & community: Annual HOA fee of $622.66
Exterior
- Parking: Driveway parking (2 spaces); Total of 2 garage/parking spaces
- Utilities: Public water; On-site septic system; Electric heating and cooling; Electric hot water
- Home design: Detached single-family home; Good condition; Fee simple ownership
- Construction: Brick and vinyl siding exterior; Slab foundation; Above-grade and below-grade structures
- Exterior features: Rear and fully fenced yard (chain link and wood fencing); Backs to trees; No-thru street location
Interior
- Kitchen: Cooktop with downdraft; Electric oven/range; Range hood; Dishwasher; Refrigerator; Exhaust fan
- Bedrooms: Two main-level bedrooms; One lower-level bedroom
- Bathrooms: Two full bathrooms (one on main level, one on lower level)
- Heating & cooling: Heat pump heating; Central air conditioning; Ceiling fans
- Interior features: Fully finished basement with daylight windows, interior access, outside/rear entrance, connecting stairway and heated living space; Exterior lighting; Mantel fireplace with marble and wood details (1 fireplace)
- Laundry & utility: Washer and dryer; Laundry located on lower floor; Electric water heater
Neighborhood map
What this means for you Summary
Snapshot
- This is a 3-bed/1.0-bath single-family listed at $276k.
Deal economics
- At list price, monthly cash flow is $12 ($141/yr) — positive.
- The deal already cash-flows at list — no discount required.
- To meet the 1% rule (rent ≥ 1% of price), the offer needs to be $237k (14.0% below list).
- Recommended offer: $237k (14.0% below list) — sets the bar for 1% rule.
- Cap rate 6.3% vs local median 4.7% in Chesapeake Ranch Estates — top-decile yield for the area; either an underpriced asset or a hidden risk that comps aren't pricing in. Stress-test before assuming the spread holds.
Location & tenants
- Location reads 66/100 on livability (#240 in MD) — a middle-class / working-renter tenant base. Strengths: employment A+, housing A+; Watch: cost of living C-, crime D+, amenities F.
- Calvert County Public Schools (rural): math 23% / reading 44% proficiency, ranked #5 of 24 in MD (top 21%) — families likely to look elsewhere, expect single-tenant / working-renter base with shorter leases; only 19% free/reduced lunch — higher-income household profile.
- Zoned schools: Patuxent Appeal Elementary Campus (math 8% / reading 17%, grade F, #535 of 860 statewide, top 62%, 712 students, 55% FRL); Mill Creek Middle (math 12% / reading 37%, grade F, #108 of 225 statewide, top 50%, 446 students, 42% FRL); Patuxent High (math 52% / reading 81%, grade B, #53 of 222 statewide, top 24%, 1,029 students, 34% FRL) — zoned schools average 43% FRL vs 19% district-wide (24 pts higher); higher-poverty schools than district average — tighter screening recommended.
- Market conditions: 174 active listings in the ZIP; 5 comparable units currently listed for rent nearby; rentals at typical pace (median 22d on market — plan ~3-4 weeks tenant-placement turnaround); 40% of comp listings sitting > 30 days — soft ceiling on asking rent; high-income renter base; 101 units permitted in Calvert County in 2024 (0 in 5+ unit buildings).
Forward outlook
- Local home prices are declining (-3.0%/yr); year-one equity from $2k of loan paydown is wiped out by about $8k of value loss. Plan a longer hold.
Negotiation context
- Only 7 days on market — expect competitive offers; lowballing is unlikely to land.
Risks & watch-outs
- Climate carrying-cost: major wind risk, 79% chance of damaging wind over 30y; extreme-heat days projected 7→17/yr by 2055 (HVAC capex compounding) — expect insurance premiums to compound above CPI over the hold.
Questions for the listing agent
- What does the HOA fee cover, when was the last increase, and are there any pending special assessments or reserve-fund shortfalls?
- Is there a deadline driving the sale (1031 exchange, divorce, estate, relocation)? That informs how much negotiation room exists.
- Schools are D-rated, which usually means shorter tenancies and higher turnover. Who's the typical renter profile here, and what's been the actual vacancy rate?
- Crime grade is D in this area — have there been break-ins, vandalism, or insurance claims at this property in the last 3 years? What carrier currently insures it and at what premium?
- The area grade is low — what's the realistic commute time and amenity access for the typical tenant pool here? Any planned neighborhood developments (good or bad) we should know about?
- What's the average days-on-market for RENTAL listings here right now (not sales)? A rising rental-DOM trend means longer vacancies and softer asking-rent achievability than the comps imply.
- What's the recent tenant-quality profile in this submarket — average credit score on applications, eviction rate, late-payment / NSF rate, and stable-employment percentage? A property-management company in the area should have these aggregated.
- How much new for-sale + rental construction is in the pipeline within 1–3 miles? Heavy new supply typically softens prices + rents 12–24 months out; constrained supply supports both.
Investment metrics
- 1% rule
- 0.86% ✗
- Cap rate
- 6.34%
- Cash-on-cash
- 0.18%
- DSCR
- 1.01
- GRM
- 9.7
CMA / ARV
- ARV (on-the-fly)
- $351,808
- Comps found
- 12
Show comp detail 12 sales within ~0.75 mi
| Address | Dist | Beds/Ba | Sqft | Sold | Price | $/sf | Match |
|---|---|---|---|---|---|---|---|
| 12504 Algonquin Trl | 0.30mi | 3/1.0 | 1,432 (-3%) | 4mo | $315,000 | $220 | 78 |
| 1024 Gringo Ln | 0.54mi | 3/2.5 | 1,518 (+3%) | 4mo | $375,000 | $247 | 60 |
| 1049 Golden West Way | 0.43mi | 3/2.0 | 1,633 (+11%) | 3mo | $329,000 | $201 | 56 |
| 1110 El Paso Trl | 0.41mi | 3/2.0 | 1,363 (-7%) | 15mo | $472,000 | $346 | 52 |
| 980 Silverton | 0.26mi | 3/2.5 | 1,692 (+15%) | 7mo | $370,000 | $219 | 51 |
| 12148 Pine Tree Ln | 0.41mi | 4/2.0 (+1) | 1,440 (-2%) | 20mo | $350,000 | $243 | 51 |
| 1006 Golden West Way | 0.34mi | 3/2.5 | 1,344 (-9%) | 17mo | $375,000 | $279 | 50 |
| 1020 Gringo Ct | 0.57mi | 3/2.0 | 1,296 (-12%) | 1mo | $363,000 | $280 | 48 |
| 12370 Algonquin Trl | 0.13mi | 2/2.5 (-1) | 1,296 (-12%) | 20mo | $310,000 | $239 | 46 |
| 970 Crystal Rock Rd | 0.66mi | 3/1.0 | 1,344 (-9%) | 10mo | $315,000 | $234 | 46 |
| 12305 Catalina Dr | 0.37mi | 4/3.0 (+1) | 1,569 (+7%) | 17mo | $372,500 | $237 | 44 |
| 12407 Tahoe Ct | 0.69mi | 3/2.0 | 1,326 (-10%) | 6mo | $315,000 | $238 | 42 |
Match score weights: distance 35% · size 25% · config 20% · recency 20%. Top-matched comps best support the ARV.
Projected returns pro-forma
-3.0% appreciation · 3.0% rent growth · sell at horizon
- IRR
- -16.0%
- Equity multiple
- 0.43×
- Total profit
- $-43,967
- Equity at exit
- $41,152
- IRR
- -7.6%
- Equity multiple
- 0.52×
- Total profit
- $-37,286
- Equity at exit
- $23,863
Cash invested: $77,280 (down + closing). Projections, not guarantees.
Landlord ↔ Tenant lean methodology
- Overall (STATE)
- 27 Tenant-Leaning
- State Maryland
- 27 Tenant-Leaning · D+14
- County
- — inherits STATE
- City
- — inherits STATE
ZIP-level market 20657
- Home prices YoY
- -7.1%
- Active inventory
- 174
- Price-to-rent
- 9.7×
Monthly cashflow live
- Estimated rent
- $2,374 high interval (Pro) →
- Mortgage (P&I)
- −$1,447
- Tax from tax record
- −$249 /mo · $2,989/yr
- Insurance
- −$115
- HOA
- −$52
- Vacancy / Maint / Mgmt
- −$498
- Net cashflow
- $12
Break-even live
UW: 25.0% down · 7.5% · 30yr · 1.5% tax · 5.0% vac · 8.0% maint · 8.0% mgmt
Financing live
Cash to close
- Down payment
- $69,000
- Closing costs
- $8,280
- Reserves months
- —
- Total cash needed
- —
Loan-product check · same deal, 3 products live
Conventional
25% down · 7.5% · 30yr
- Down + closing
- —
- Monthly P&I
- —
- Monthly cashflow
- —
- DSCR
- —
- Eligible?
- —
Personal DTI + credit; lowest rate.
DSCR
20% down · 8.5% · 30yr
- Down + closing
- —
- Monthly P&I
- —
- Monthly cashflow
- —
- DSCR
- —
- Eligible?
- —
No personal income docs; deal must DSCR.
Hard money
10% down · 12.0% · 12mo
- Down + closing
- —
- Monthly P&I
- —
- Monthly cashflow
- —
- DSCR
- —
- Eligible?
- —
Short-term bridge; refi at stabilization.
Rent comps 5 comps
| Address | Beds | Baths | Sqft | Rent | $/sqft | DOM | Units | Dist |
|---|---|---|---|---|---|---|---|---|
| 12443 San Jose Ln Lusby, MD | 3.0 | 3.0 | 1164 | $2,350 | $2.02 | 22d | 1 | 0.54mi |
| 915 Crystal Rock Rd Lusby, MD | 3.0 | 2.0 | 1056 | $2,100 | $1.99 | 43d | 1 | 0.65mi |
| 12627 Hilltop Rd Lusby, MD | 3.0 | 2.0 | 1108 | $2,400 | $2.17 | 16d | 1 | 0.84mi |
| 11530 Tomahawk Trl W Lusby, MD | 3.0 | 2.0 | 1440 | $2,550 | $1.77 | 5d | 1 | 1.30mi |
| 12433 Cree Ln Lusby, MD | 3.0 | 2.0 | 1448 | $1,850 | $1.28 | 43d | 1 | 1.34mi |
HOA detail
- Monthly dues
- $52 · $624/yr
Listing history 9 events
-
2026-06-18days on market $276,000 Active 7 DOM
-
2026-06-17days on market $276,000 Active 6 DOM
-
2026-06-16statusdays on market $276,000 Active 5 DOM
-
2026-06-10status $276,000 Pending 4 DOM
-
2026-06-09days on market $276,000 Active 4 DOM
-
2026-06-08days on market $276,000 Active 3 DOM
-
2026-06-07statusdays on market $276,000 Active 2 DOM
-
2026-06-04remarks 689-char remark
-
2026-06-04$276,000 Coming Soon 1 DOM
ⓘ Source: listings_history table (triggers on properties + properties_extension) + one-shot
backfill from property_details.listing_events for pre-trigger history.
Tax reassessment forecast MD · Partial reset (capped growth)
- Current annual tax
- $2,989 · $249/mo
- Projected year-2 tax
- $2,999 · $250/mo
- Expected delta
- +$9/yr (+$1/mo · 0.3%)
ⓘ Screening estimate from a state-policy table — verify with the county assessor before closing.
Climate risk First Street
- Flood 1/10 Low FEMA zone X (unshaded) · 0% chance over 30 yrs
- Wildfire 3/10 Moderate
- Heat 9/10 Extreme 7 d/yr ≥101°F today · 17 d/yr by 30 yrs out
- Wind 7/10 Severe 79% chance of damaging wind over 30 yrs
- Air quality 3/10 Moderate 2 unhealthy d/yr today · 3 by 30 yrs out
Nearby sold comps map
Loading sold comps map…
Walkable amenities ~0.75 mi
Loading nearby amenities…
Taxation est. · year 1
- Rental income
- $28,485
- − Mortgage interest
- −$15,460
- − Property taxes
- −$2,989
- − Insurance
- −$1,380
- − Repairs & maintenance
- −$2,279
- − Management
- −$2,279
- − HOA
- −$624
- − Depreciation
- −$8,029
- Taxable loss
- −$4,556
- Est. tax savings @ 24.0%
- +$1,093
- After-tax cash flow
- $1,234/yr
For passive investors: Depreciation is non-cash, so a rental often shows a tax loss while cash-flowing — sheltering income. Rental losses are passive: they offset passive income freely, and up to $25,000/yr can offset ordinary (W-2) income if you actively participate and your MAGI is under $100k (phasing out to $0 by $150k); unused losses carry forward. On sale, claimed depreciation is recaptured at up to 25%, and gains may owe capital-gains tax (a 1031 exchange can defer both). Figures are a year-1 estimate at your 24.0% rate — not tax advice; consult a CPA.
Schools (NCES district)
- District
- Calvert County Public Schools
- NCES district ID
- 2400150
- Math proficiency
- 23% ▼ -29.00%
- Reading proficiency
- 44% ▼ -15.00%
- Median HH income
- $94,392
- Composite
- 33.27/100
- National rank
- #5511
- State rank
- #5 of 24 in MD
Livability — Chesapeake Ranch Estates
- Score
- 66/100
- State rank
- #240
- US rank
- #11959
Category grades
Schools grade is shown separately in the Schools card above.
Census & demographics
- Census place
- Chesapeake Ranch Estates, MD
- County
- Calvert County · 33,451 people
- Metro
- Washington-Arlington-Alexandria, DC-VA-MD-WV
- Population (ZIP)
- 20,699
- Household income
- $115,748
- Rent vs Own
- Severe rent burden
- 136.0
Population outlook (Calvert County) Hauer SSP2
- Today (2025)
- 94,825 people
- By 2030
- 96,197 · +1.4%
- By 2040
- 96,954 · +2.2%
- By 2050
- 94,628 · -0.2%
- By 2075
- 91,576 · -3.4%
- By 2100
- 83,431 · -12.0%
Race, ethnicity, and origin ACS 2023
- Neighborhood character
- Predominantly White (71%)
- Race & ethnicity
- White 71% Black 15% Two or more races 7% Hispanic / Latino 6% Asian 2%
- Hispanic origin (detail)
- Mexican 1% Puerto Rican 3%
- Common ancestry
- Lithuanian 3% Slovak 3% Romanian 1%
- Foreign-born
- 4% · Canada
- Languages at home
- 93% English-only · Spanish 3% Other Indo-European 1% Tagalog/Filipino 1%
Political lean MEDSL · Calvert
- 2024 margin
- R (+11.0) · D 43.5% · R 54.5% · Other 2.0%
- 2008→2024 swing
- -4.6pp toward R · 2008: -6.3pp · 2024: -11.0pp
- All cycles
- 2024: R+11.0 2020: R+5.6 2016: R+18.4 2012: R+8.2 2008: R+6.3
Not yet ingested
- Civics
- —
Market trends
- HPI YoY
- ▼ -20.88%
- Current HPI
- 274.4909
- Rent YoY
- —
- Metro
- Washington-Arlington-Alexandria, DC-VA-MD-WV
- State GDP YoY
- ▲ 2.97%
- F500 in state
- 12
Industry mix (Fortune 500 HQ in MD)
| Industry | F500 HQs | Revenue |
|---|---|---|
| Aerospace / Defense | 1 | $71B |
|
||
| Utilities | 1 | $25B |
|
||
| Hotels | 1 | $24B |
|
||
| Consumer Goods | 1 | $7B |
|
||
| Real Estate | 1 | $6B |
|
||
| Chemicals | 1 | $2B |
|
||
Price history
1 event — show timeline
- 2026-06-03 Coming Soon $276,000 BRIGHT MLS
Property tax history
+5.2%/yrLatest (2025): $2,989 · +8.6% YoY. Source: county tax records.
Cash-flow waterfall
monthlySold comps — $/sqft
last 12 mo · ≤1 miLoading sold comps…