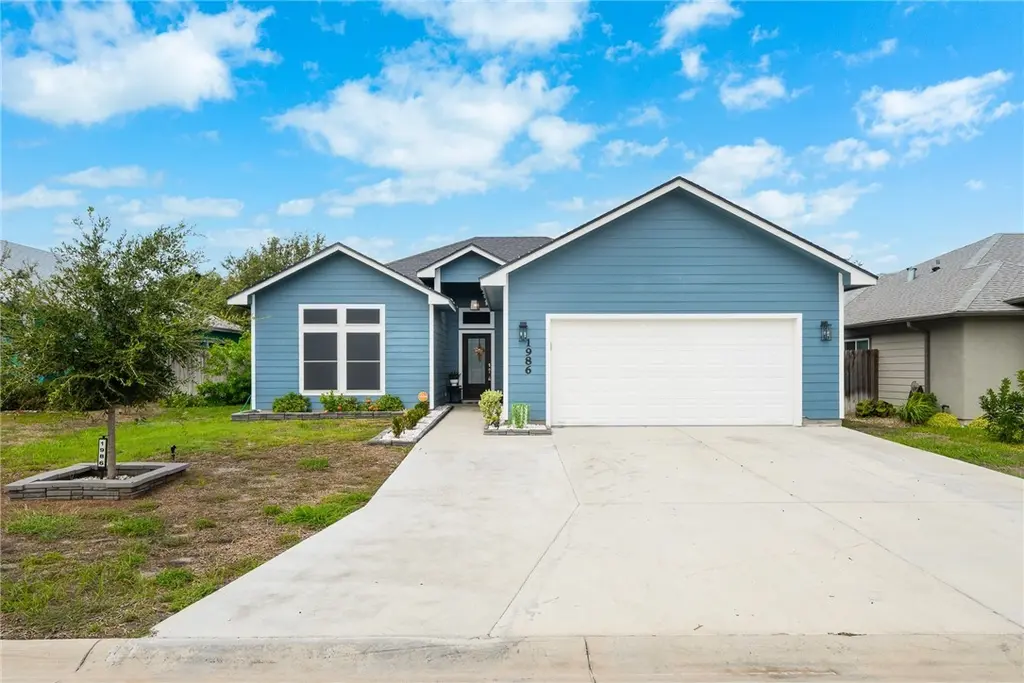
1986 Admiral · Aransas Pass, TX
Flood risk 1/10 · Minimal
- FEMA flood zone
- X (unshaded)
- Chance of flooding over 30 yrs
- 0.0%
- Est. flood insurance / yr
- $507 – $1,088
Fire risk 4/10 · Minor
- Est. fire insurance / yr
- $1,222 – $2,270
Heat risk 10/10 · Severe
- Hot days now (above 106°F)
- 7 days/yr
- Hot days in 30 yrs
- 30 days/yr
Wind risk 9/10 · Severe
- Chance of severe wind over 30 yrs
- 99.0%
Air-quality risk 1/10 · Minimal
- Unhealthy air days now
- 0 days/yr
- Unhealthy air days in 30 yrs
- 0 days/yr
Risk factors via First Street. Map © Google.
Why this score? — see what drove the C grade
The composite is a weighted blend of 9 inputs, each scored 0–100. Each bar is that input's sub-score; the figure is the points it added to the 100-point composite (weight × sub-score).
- Cash flow +27.1/30.0
- DSCR +9.4/10.0
- 1% rule +8.0/10.0
- Livability +3.6/5.0
- Schools +2.7/10.0
- Rent growth +2.5/5.0
- Condition / age +2.5/5.0
- ARV discount +0.7/15.0
- Appreciation +0.0/10.0
$315,000
🖨 Deal sheet (PDF) 📄 Offer letter ✓ Due diligence
Listing remarks MLS
Welcome to this beautiful coastal retreat offering 4 spacious bedrooms and 2 full bathrooms in a thoughtfully designed open-concept floor plan. The split-bedroom layout provides privacy, while the heart of the home features a stunning kitchen with a large island, ample cabinetry, and stylish accent details that elevate the space. The generous primary suite is a true sanctuary, complete with a private ensuite bathroom and comfortable proportions. Additional designer touches throughout add warmth and character, making this home truly move-in ready. Ideally located near some of the area’s best fishing spots, local eateries, and coastal attractions, this property perfectly blends comfort, style, and location—perfect for full-time living, a weekend getaway, or an investment opportunity.
Key facts
- Split-bedroom layout
- Ample cabinetry
- Large island
Tags
Neighborhood map
What this means for you Summary
Snapshot
- This is a 4-bed/2.0-bath single-family listed at $315k.
Deal economics
- At list price, monthly cash flow is $896 ($11k/yr) — positive.
- The deal already cash-flows at list — no discount required.
- Meets the 1% rule at list price ($4k rent vs $315k).
- Recommended offer: $277k (12.0% below list) — sets the bar for market timing.
- Cap rate 9.7% vs local median 4.6% in Aransas Pass — top-decile yield for the area; either an underpriced asset or a hidden risk that comps aren't pricing in. Stress-test before assuming the spread holds.
Location & tenants
- Location reads 72/100 on livability (#253 in TX) — a middle-class / working-renter tenant base. Strengths: cost of living A+, housing A+, health & safety A+; Watch: amenities F, commute F, employment F.
- Aransas Pass ISD (town): math 28% / reading 35% proficiency, ranked #597 of 826 in TX (top 72%) — families likely to look elsewhere, expect single-tenant / working-renter base with shorter leases; 64% free/reduced lunch — lower-income household profile, screen leases tightly.
- Zoned schools: H T Faulk El (483 students, 74% FRL); A C Blunt Middle (math 23% / reading 34%, grade F, #1,122 of 1,662 statewide, top 69%, 387 students, 64% FRL); Aransas Pass H S (math 37% / reading 37%, grade F, #897 of 1,632 statewide, top 57%, 457 students, 56% FRL) — zoned schools at 65% FRL track the district average.
- Market conditions: 275 active listings in the ZIP; 1 comparable units currently listed for rent nearby; 344 units permitted in San Patricio County in 2024 (0 in 5+ unit buildings).
Forward outlook
- Local home prices are declining (-3.0%/yr); year-one equity from $2k of loan paydown is wiped out by about $9k of value loss. Plan a longer hold.
- San Patricio County population projected at +27% by 2050 — long-run rental-demand tailwind backs the buy-and-hold thesis.
- At projected returns (-3.0% appreciation + 3.0% rent growth), your $88k cash investment doubles in ~10 years — after that, you're playing with house money.
Negotiation context
- It's been on market 146 days — a 12% lower offer ($277k) is reasonable based on typical stale-listing flexibility.
- 5 sale attempts since 5y ago with the ask held roughly flat each time — persistent listings suggest the price (not the market) is what's stuck; bring a comps-based counter.
Risks & watch-outs
- Climate carrying-cost: severe wind risk, 99% chance of damaging wind over 30y; extreme-heat days projected 7→30/yr by 2055 (HVAC capex compounding) — expect insurance premiums to compound above CPI over the hold.
Questions for the listing agent
- It's been on market 146 days. Have you received any prior offers? Is the seller open to a 12% concession, seller financing, or rate buy-down credit?
- Why hasn't it sold? Are there any deal-killer items the seller is aware of (foundation, flood, title, zoning, code violations)?
- Is there a deadline driving the sale (1031 exchange, divorce, estate, relocation)? That informs how much negotiation room exists.
- Schools are D-rated, which usually means shorter tenancies and higher turnover. Who's the typical renter profile here, and what's been the actual vacancy rate?
- What's the average days-on-market for RENTAL listings here right now (not sales)? A rising rental-DOM trend means longer vacancies and softer asking-rent achievability than the comps imply.
- What's the recent tenant-quality profile in this submarket — average credit score on applications, eviction rate, late-payment / NSF rate, and stable-employment percentage? A property-management company in the area should have these aggregated.
- How much new for-sale + rental construction is in the pipeline within 1–3 miles? Heavy new supply typically softens prices + rents 12–24 months out; constrained supply supports both.
Investment metrics
- 1% rule
- 1.30% ✓
- Cap rate
- 9.71%
- Cash-on-cash
- 12.19%
- DSCR
- 1.54
- GRM
- 6.4
CMA / ARV
- ARV (median comp)
- $273,505
- List price
- $315,000
- Delta
- 15.17%
- Verdict
- OVERPRICED
- Comps
- 20 within 1.0 mi
Show comp detail 7 sales within ~0.75 mi
| Address | Dist | Beds/Ba | Sqft | Sold | Price | $/sf | Match |
|---|---|---|---|---|---|---|---|
| 704 Starboard | 0.12mi | 4/2.0 | 1,655 (-1%) | 18mo | $355,000 | $215 | 78 |
| 1003 W Rhodes Ave | 0.37mi | 4/2.0 | 1,608 (-4%) | 3mo | $484,500 | $301 | 74 |
| 2058 Admiral | 0.10mi | 4/2.0 | 1,572 (-6%) | 17mo | $319,000 | $203 | 72 |
| 1962 Admiral Ln | 0.03mi | 3/2.0 (-1) | 1,525 (-8%) | 18mo | $289,900 | $190 | 65 |
| 1384 Morgan | 0.35mi | 3/3.0 (-1) | 1,586 (-5%) | 8mo | $379,900 | $240 | 60 |
| 1838 S Saunders St | 0.25mi | 3/2.0 (-1) | 1,482 (-11%) | 22mo | $325,000 | $219 | 46 |
| 1689 Mooney Ln | 0.53mi | 3/2.0 (-1) | 1,434 (-14%) | 10mo | $315,000 | $220 | 39 |
Match score weights: distance 35% · size 25% · config 20% · recency 20%. Top-matched comps best support the ARV.
Projected returns pro-forma
-3.0% appreciation · 3.0% rent growth · sell at horizon
- IRR
- 1.8%
- Equity multiple
- 1.07×
- Total profit
- $6,175
- Equity at exit
- $46,968
- IRR
- 11.5%
- Equity multiple
- 1.90×
- Total profit
- $79,517
- Equity at exit
- $27,235
Cash invested: $88,200 (down + closing). Projections, not guarantees.
Landlord ↔ Tenant lean methodology
- Overall (STATE)
- 87 Strongly Landlord-Friendly
- State Texas
- 87 Strongly Landlord-Friendly · R+5
- County
- — inherits STATE
- City
- — inherits STATE
ZIP-level market 78336
- Home prices YoY
- -29.5%
- Active inventory
- 275
- Price-to-rent
- 6.4×
Monthly cashflow live
- Estimated rent
- $4,105 medium interval (Pro) →
- Mortgage (P&I)
- −$1,652
- Tax from tax record
- −$564 /mo · $6,768/yr
- Insurance
- −$131
- HOA
- −$0
- Vacancy / Maint / Mgmt
- −$862
- Net cashflow
- $896
Break-even live
Sensitivity live
| Price | -10% $1,074 | -5% $985 | +0% $896 | +5% $807 | +10% $717 |
|---|---|---|---|---|---|
| Rent | -10% $571 | -5% $734 | +0% $896 | +5% $1,058 | +10% $1,220 |
| Rate | -1.0pp $1,054 | -0.5pp $976 | base $896 | +0.5pp $814 | +1.0pp $731 |
UW: 25.0% down · 7.5% · 30yr · 1.5% tax · 5.0% vac · 8.0% maint · 8.0% mgmt
Financing live
Cash to close
- Down payment
- $78,750
- Closing costs
- $9,450
- Reserves months
- —
- Total cash needed
- —
Loan-product check · same deal, 3 products live
Conventional
25% down · 7.5% · 30yr
- Down + closing
- —
- Monthly P&I
- —
- Monthly cashflow
- —
- DSCR
- —
- Eligible?
- —
Personal DTI + credit; lowest rate.
DSCR
20% down · 8.5% · 30yr
- Down + closing
- —
- Monthly P&I
- —
- Monthly cashflow
- —
- DSCR
- —
- Eligible?
- —
No personal income docs; deal must DSCR.
Hard money
10% down · 12.0% · 12mo
- Down + closing
- —
- Monthly P&I
- —
- Monthly cashflow
- —
- DSCR
- —
- Eligible?
- —
Short-term bridge; refi at stabilization.
Rent comps 1 comps
| Address | Beds | Baths | Sqft | Rent | $/sqft | DOM | Units | Dist |
|---|---|---|---|---|---|---|---|---|
| 1131 S 8th St Unit 1268400P Aransas Pass, TX | 3.0 | 2.0 | 1280 | $4,105 | $3.21 | 45d | 1 | 1.19mi |
Listing history 31 events
-
2026-06-19days on market $315,000 Active 146 DOM
-
2026-06-18days on market $315,000 Active 145 DOM
-
2026-06-17days on market $315,000 Active 144 DOM
-
2026-06-16days on market $315,000 Active 143 DOM
-
2026-06-15days on market $315,000 Active 142 DOM
-
2026-06-14days on market $315,000 Active 140 DOM
-
2026-06-12days on market $315,000 Active 139 DOM
-
2026-06-09days on market $315,000 Active 136 DOM
-
2026-06-08days on market $315,000 Active 135 DOM
-
2026-06-07days on market $315,000 Active 134 DOM
-
2026-06-07days on market $315,000 Active 133 DOM
-
2026-06-04days on market $315,000 Active 130 DOM
-
2026-06-02days on market $315,000 Active 129 DOM
-
2026-06-01days on market $315,000 Active 128 DOM
-
2026-05-31days on market $315,000 Active 127 DOM
-
2026-05-31days on market $315,000 Active 126 DOM
-
2026-01-24$315,000 Active 804-char remark
Show marketing remark (804 chars)
Welcome to this beautiful coastal retreat offering 4 spacious bedrooms and 2 full bathrooms in a thoughtfully designed open-concept floor plan. The split-bedroom layout provides privacy, while the heart of the home features a stunning kitchen with a large island, ample cabinetry, and stylish accent details that elevate the space. The generous primary suite is a true sanctuary, complete with a private ensuite bathroom and comfortable proportions. Additional designer touches throughout add warmth and character, making this home truly move-in ready. Ideally located near some of the area’s best fishing spots, local eateries, and coastal attractions, this property perfectly blends comfort, style, and location—perfect for full-time living, a weekend getaway, or an investment opportunity.
-
2025-10-24price $329,900
-
2025-09-27$340,000 Active
-
2025-07-13historical $2,600
-
2025-06-12$2,600
-
2022-08-03historical
-
2022-08-02soldstatus Closed
-
2022-06-21status Pending
-
2022-06-18price $287,900
-
2022-06-14price $279,900
-
2022-06-14status Active
-
2022-04-13status Pending
-
2022-02-23price $286,500
-
2022-01-06soldstatus
-
2021-12-17$269,900 Active
ⓘ Source: listings_history table (triggers on properties + properties_extension) + one-shot
backfill from property_details.listing_events for pre-trigger history.
Tax reassessment forecast TX · Resets to sale price
- Current annual tax
- $6,768 · $564/mo
- Projected year-2 tax
- $6,768 · $564/mo
- Expected delta
- $0/yr ($0/mo · 0.0%)
ⓘ Screening estimate from a state-policy table — verify with the county assessor before closing.
Climate risk First Street
- Flood 1/10 Low FEMA zone X (unshaded) · 0% chance over 30 yrs
- Wildfire 4/10 Moderate
- Heat 10/10 Extreme 7 d/yr ≥106°F today · 30 d/yr by 30 yrs out
- Wind 9/10 Extreme 99% chance of damaging wind over 30 yrs
- Air quality 1/10 Low 0 unhealthy d/yr today · 0 by 30 yrs out
Nearby sold comps map
Loading sold comps map…
Walkable amenities ~0.75 mi
Loading nearby amenities…
Taxation est. · year 1
- Rental income
- $49,260
- − Mortgage interest
- −$17,645
- − Property taxes
- −$6,768
- − Insurance
- −$1,575
- − Repairs & maintenance
- −$3,941
- − Management
- −$3,941
- − Depreciation
- −$9,164
- Taxable income
- $6,226
- Est. tax owed @ 24.0%
- −$1,494
- After-tax cash flow
- $9,255/yr
For passive investors: Depreciation is non-cash, so a rental often shows a tax loss while cash-flowing — sheltering income. Rental losses are passive: they offset passive income freely, and up to $25,000/yr can offset ordinary (W-2) income if you actively participate and your MAGI is under $100k (phasing out to $0 by $150k); unused losses carry forward. On sale, claimed depreciation is recaptured at up to 25%, and gains may owe capital-gains tax (a 1031 exchange can defer both). Figures are a year-1 estimate at your 24.0% rate — not tax advice; consult a CPA.
Schools (NCES district)
- District
- Aransas Pass ISD
- NCES district ID
- 4808580
- Math proficiency
- 28% ▼ -16.00%
- Reading proficiency
- 35% ▼ -4.00%
- Median HH income
- $40,869
- Composite
- 26.55/100
- National rank
- #7191
- State rank
- #597 of 826 in TX
Livability — Aransas Pass
- Score
- 72/100
- State rank
- #253
- US rank
- #5980
Category grades
Schools grade is shown separately in the Schools card above.
Census & demographics
- Census place
- Aransas Pass, TX
- Population (ZIP)
- 12,146
Population outlook (San Patricio County) Hauer SSP2
- Today (2025)
- 75,538 people
- By 2030
- 79,575 · +5.3%
- By 2040
- 87,670 · +16.1%
- By 2050
- 96,107 · +27.2%
- By 2075
- 117,984 · +56.2%
- By 2100
- 130,010 · +72.1%
Race, ethnicity, and origin ACS 2023
- Neighborhood character
- Diverse neighborhood (Simpson 0.58)
- Race & ethnicity
- White 49% Hispanic / Latino 43% Two or more races 21% Asian 2% Native American 2% Black 2%
- Hispanic origin (detail)
- Mexican 36% Puerto Rican 2%
- Common ancestry
- Italian 2% Lithuanian 2% Slovak 1%
- Foreign-born
- 9% · Canada, Jamaica, China
- Languages at home
- 77% English-only · Spanish 21% Tagalog/Filipino 1%
Political lean MEDSL · San Patricio
- 2024 margin
- Solid R (+36.4) · D 31.4% · R 67.8%
- 2008→2024 swing
- -19.8pp toward R · 2008: -16.6pp · 2024: -36.4pp
- All cycles
- 2024: R+36.4 2020: R+29.1 2016: R+24.1 2012: R+20.6 2008: R+16.6
Not yet ingested
- Civics
- —
Market trends
- HPI YoY
- ▼ -78.56%
- Current HPI
- 187.8443
- Rent YoY
- —
- Metro
- —
- State GDP YoY
- ▲ 3.95%
- F500 in state
- 110
Industry mix (Fortune 500 HQ in TX)
| Industry | F500 HQs | Revenue |
|---|---|---|
| Energy | 16 | $1,198B |
|
||
| Technology | 5 | $198B |
|
||
| Engineering / Construction | 4 | $72B |
|
||
| Energy Services | 3 | $60B |
|
||
| Utilities | 3 | $41B |
|
||
| Healthcare | 2 | $330B |
|
||
Price history
+16.7% since first listed15 events — show timeline
- 2026-01-24 Listed $315,000 CBMLS
- 2025-10-24 Price Changed $329,900 CBMLS
- 2025-09-27 Listed $340,000 CBMLS
- 2025-07-13 Rental Removed $2,600 Avail
- 2025-06-12 Listed for Rent $2,600 Avail
- 2022-08-03 Delisted — CBMLS
- 2022-08-02 Sold (MLS) — CBMLS
- 2022-06-21 Pending — CBMLS
- 2022-06-18 Price Changed $287,900 CBMLS
- 2022-06-14 Price Changed $279,900 CBMLS
- 2022-06-14 Relisted — CBMLS
- 2022-04-13 Pending — CBMLS
- 2022-02-23 Price Changed $286,500 CBMLS
- 2022-01-06 Sold (Public Records) — Public Records
- 2021-12-17 Listed $269,900 CBMLS
Property tax history
+55.5%/yrLatest (2025): $6,768 · +10.5% YoY. Source: county tax records.
Cash-flow waterfall
monthlySold comps — $/sqft
last 12 mo · ≤1 miLoading sold comps…