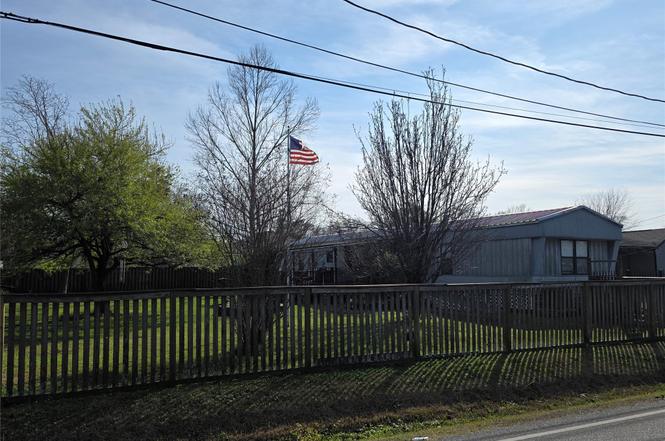
14134 Brownsville St · Cloverleaf, TX
Flood risk 1/10 · Minimal
- FEMA flood zone
- X (unshaded)
- Chance of flooding over 30 yrs
- 0.0%
- Est. flood insurance / yr
- $507 – $1,088
Fire risk 3/10 · Minor
- Est. fire insurance / yr
- $1,222 – $2,270
Heat risk 9/10 · Severe
- Hot days now (above 109°F)
- 7 days/yr
- Hot days in 30 yrs
- 24 days/yr
Wind risk 9/10 · Severe
- Chance of severe wind over 30 yrs
- 99.0%
Air-quality risk 2/10 · Minimal
- Unhealthy air days now
- 2 days/yr
- Unhealthy air days in 30 yrs
- 2 days/yr
Risk factors via First Street. Map © Google.
Why this score? — see what drove the D grade
The composite is a weighted blend of 9 inputs, each scored 0–100. Each bar is that input's sub-score; the figure is the points it added to the 100-point composite (weight × sub-score).
- Cash flow +13.8/30.0
- ARV discount +7.4/15.0
- DSCR +4.2/10.0
- 1% rule +4.1/10.0
- Livability +3.2/5.0
- Schools +2.8/10.0
- Condition / age +2.5/5.0
- Rent growth +2.3/5.0
- Appreciation +0.0/10.0
$159,000
🖨 Deal sheet (PDF) 📄 Offer letter ✓ Due diligence
Listing remarks
3 Bedroom 2 bath Mobile Home with Large Carport and Workshop/Shed! Located on 2 Lots! Possibly move another Mobile Home on second lot! Completely Fenced! Electric Driveway Gate! Large Covered Patio! Handicap Accessible! Great opportunity for family residence or rent properties!
Key facts
- Workshop shed
- Completely fenced
- 2 lots
Tags
Neighborhood map
What this means for you Summary
Snapshot
- This is a 3-bed/2.0-bath manufactured listed at $159k.
Deal economics
- At list price, monthly cash flow is $15 ($184/yr) — positive.
- The deal already cash-flows at list — no discount required.
- To meet the 1% rule (rent ≥ 1% of price), the offer needs to be $144k (9.4% below list).
- Recommended offer: $144k (9.4% below list) — sets the bar for 1% rule.
- Cap rate 6.4% vs local median 3.8% in Cloverleaf — top-decile yield for the area; either an underpriced asset or a hidden risk that comps aren't pricing in. Stress-test before assuming the spread holds.
Location & tenants
- Location reads 63/100 on livability (#886 in TX) — a middle-class / working-renter tenant base. Strengths: cost of living A+, housing A+; Watch: crime F, amenities F, commute F.
- Galena Park ISD (suburban): math 32% / reading 33% proficiency, ranked #578 of 826 in TX (top 70%) — families likely to look elsewhere, expect single-tenant / working-renter base with shorter leases; 74% free/reduced lunch — lower-income household profile, screen leases tightly.
- Zoned schools: North Shore El (math 32% / reading 34%, grade F, #2,208 of 4,322 statewide, top 52%, 951 students, 89% FRL); North Shore Middle (math 35% / reading 35%, grade F, #842 of 1,662 statewide, top 51%, 1,260 students, 87% FRL); North Shore Senior High (math 35% / reading 40%, grade F, #888 of 1,632 statewide, top 55%, 4,569 students, 86% FRL).
- Market conditions: Rents soft (-0.8%/yr); 164 active listings in the ZIP; 12 comparable units currently listed for rent nearby; rentals at typical pace (median 25d on market — plan ~3-4 weeks tenant-placement turnaround); 42% of comp listings sitting > 30 days — soft ceiling on asking rent; 29,883 units permitted in Harris County in 2024 (8,621 in 5+ unit buildings).
Forward outlook
- Local home prices are declining (-3.0%/yr); year-one equity from $1k of loan paydown is wiped out by about $5k of value loss. Plan a longer hold.
- Harris County population projected at +47% by 2050 — long-run rental-demand tailwind backs the buy-and-hold thesis.
Negotiation context
- Only 11 days on market — expect competitive offers; lowballing is unlikely to land.
Risks & watch-outs
- Climate carrying-cost: severe wind risk, 99% chance of damaging wind over 30y; extreme-heat days projected 7→24/yr by 2055 (HVAC capex compounding) — expect insurance premiums to compound above CPI over the hold.
Questions for the listing agent
- Is there a deadline driving the sale (1031 exchange, divorce, estate, relocation)? That informs how much negotiation room exists.
- Schools are F-rated, which usually means shorter tenancies and higher turnover. Who's the typical renter profile here, and what's been the actual vacancy rate?
- Crime grade is F in this area — have there been break-ins, vandalism, or insurance claims at this property in the last 3 years? What carrier currently insures it and at what premium?
- The area grade is low — what's the realistic commute time and amenity access for the typical tenant pool here? Any planned neighborhood developments (good or bad) we should know about?
- What's the average days-on-market for RENTAL listings here right now (not sales)? A rising rental-DOM trend means longer vacancies and softer asking-rent achievability than the comps imply.
- What's the recent tenant-quality profile in this submarket — average credit score on applications, eviction rate, late-payment / NSF rate, and stable-employment percentage? A property-management company in the area should have these aggregated.
- How much new for-sale + rental construction is in the pipeline within 1–3 miles? Heavy new supply typically softens prices + rents 12–24 months out; constrained supply supports both.
Investment metrics
- 1% rule
- 0.91% ✗
- Cap rate
- 6.41%
- Cash-on-cash
- 0.41%
- DSCR
- 1.02
- GRM
- 9.2
CMA / ARV
- ARV (on-the-fly)
- $158,496
- Comps found
- 1
Show comp detail 1 sale within ~0.75 mi
| Address | Dist | Beds/Ba | Sqft | Sold | Price | $/sf | Match |
|---|---|---|---|---|---|---|---|
| 14134 Brownsville St | 0.00mi | 3/2.0 | 1,248 (0%) | 0mo | $159,000 | $127 | 100 |
Match score weights: distance 35% · size 25% · config 20% · recency 20%. Top-matched comps best support the ARV.
Projected returns pro-forma
-3.0% appreciation · 0.0% rent growth · sell at horizon
- IRR
- -19.1%
- Equity multiple
- 0.35×
- Total profit
- $-28,973
- Equity at exit
- $23,707
- IRR
- -19.7%
- Equity multiple
- 0.10×
- Total profit
- $-40,135
- Equity at exit
- $13,747
Cash invested: $44,520 (down + closing). Projections, not guarantees.
Landlord ↔ Tenant lean methodology
- Overall (STATE)
- 87 Strongly Landlord-Friendly
- State Texas
- 87 Strongly Landlord-Friendly · R+5
- County
- — inherits STATE
- City
- — inherits STATE
ZIP-level market 77015
- Home prices YoY
- -10.8%
- Rents YoY
- -0.8%
- Active inventory
- 164
- Price-to-rent
- 9.2×
Monthly cashflow live
- Estimated rent
- $1,440 high interval (Pro) →
- Mortgage (P&I)
- −$834
- Tax from tax record
- −$222 /mo · $2,666/yr
- Insurance
- −$66
- HOA
- −$0
- Vacancy / Maint / Mgmt
- −$302
- Net cashflow
- $15
Break-even live
Sensitivity live
| Price | -10% $105 | -5% $60 | +0% $15 | +5% $-30 | +10% $-75 |
|---|---|---|---|---|---|
| Rent | -10% $-98 | -5% $-42 | +0% $15 | +5% $72 | +10% $129 |
| Rate | -1.0pp $95 | -0.5pp $56 | base $15 | +0.5pp $-26 | +1.0pp $-68 |
UW: 25.0% down · 7.5% · 30yr · 1.5% tax · 5.0% vac · 8.0% maint · 8.0% mgmt
Financing live
Cash to close
- Down payment
- $39,750
- Closing costs
- $4,770
- Reserves months
- —
- Total cash needed
- —
Loan-product check · same deal, 3 products live
Conventional
25% down · 7.5% · 30yr
- Down + closing
- —
- Monthly P&I
- —
- Monthly cashflow
- —
- DSCR
- —
- Eligible?
- —
Personal DTI + credit; lowest rate.
DSCR
20% down · 8.5% · 30yr
- Down + closing
- —
- Monthly P&I
- —
- Monthly cashflow
- —
- DSCR
- —
- Eligible?
- —
No personal income docs; deal must DSCR.
Hard money
10% down · 12.0% · 12mo
- Down + closing
- —
- Monthly P&I
- —
- Monthly cashflow
- —
- DSCR
- —
- Eligible?
- —
Short-term bridge; refi at stabilization.
Rent comps 12 comps
| Address | Beds | Baths | Sqft | Rent | $/sqft | DOM | Units | Dist |
|---|---|---|---|---|---|---|---|---|
| 13925 Alderson St Houston, TX | 2.0 | 1.0 | 700 | $1,234 | $1.76 | 0d | 1 | 0.53mi |
| 353 Audrey Ln Unit 383 Houston, TX | 2.0 | 2.5 | 1224 | $1,400 | $1.14 | 44d | 1 | 0.95mi |
| 353 Audrey Ln Unit 365 1/2 Houston, TX | 2.0 | 1.0 | 800 | $1,375 | $1.72 | 44d | 1 | 0.95mi |
| 13433 Topeka St Unit 1510879P Houston, TX | 2.0 | 2.0 | 1420 | $1,760 | $1.24 | 0d | 1 | 0.97mi |
| 316 White Cedar St Houston, TX | 3.0 | 2.0 | 1158 | $1,496 | $1.29 | 44d | 1 | 1.18mi |
| 316 White Cedar St Houston, TX | 3.0 | 2.0 | 1158 | $1,496 | $1.29 | 20d | 1 | 1.18mi |
| 316 White Cedar St Houston, TX | 2.0 | 2.0 | 1028 | $1,306 | $1.27 | 25d | 1 | 1.18mi |
| 250 Uvalde Rd Houston, TX | 1.0–3.0 | 1.0–2.0 | 909 | $1,339 | $1.47 | 3d | 26 | 1.27mi |
| 13025 Joliet St Unit B Houston, TX | 3.0 | 1.0 | 1000 | $2,098 | $2.10 | 11d | 1 | 1.34mi |
| 13161 Woodforest Blvd Houston, TX | 2.0 | 2.0 | 965 | $1,058 | $1.10 | 44d | 1 | 1.35mi |
| 13464 Castilian Dr #2 Houston, TX | 3.0 | 1.5 | 1440 | $1,195 | $0.83 | 13d | 1 | 1.35mi |
| 13726 Rampchester Ln Houston, TX | 4.0 | 2.0 | 1492 | $1,900 | $1.27 | 44d | 1 | 1.37mi |
Listing history 4 events
-
2026-03-22status Pending
-
2026-03-12status Pending
-
2026-03-10$159,000 Active
-
1988-01-02soldstatus
ⓘ Source: listings_history table (triggers on properties + properties_extension) + one-shot
backfill from property_details.listing_events for pre-trigger history.
Tax reassessment forecast TX · Resets to sale price
- Current annual tax
- $2,666 · $222/mo
- Projected year-2 tax
- $2,910 · $242/mo
- Expected delta
- +$244/yr (+$20/mo · 9.1%)
ⓘ Screening estimate from a state-policy table — verify with the county assessor before closing.
Climate risk First Street
- Flood 1/10 Low FEMA zone X (unshaded) · 0% chance over 30 yrs
- Wildfire 3/10 Moderate
- Heat 9/10 Extreme 7 d/yr ≥109°F today · 24 d/yr by 30 yrs out
- Wind 9/10 Extreme 99% chance of damaging wind over 30 yrs
- Air quality 2/10 Low 2 unhealthy d/yr today · 2 by 30 yrs out
Nearby sold comps map
Loading sold comps map…
Walkable amenities ~0.75 mi
Loading nearby amenities…
Taxation est. · year 1
- Rental income
- $17,279
- − Mortgage interest
- −$8,906
- − Property taxes
- −$2,666
- − Insurance
- −$795
- − Repairs & maintenance
- −$1,382
- − Management
- −$1,382
- − Depreciation
- −$4,625
- Taxable loss
- −$2,479
- Est. tax savings @ 24.0%
- +$595
- After-tax cash flow
- $779/yr
For passive investors: Depreciation is non-cash, so a rental often shows a tax loss while cash-flowing — sheltering income. Rental losses are passive: they offset passive income freely, and up to $25,000/yr can offset ordinary (W-2) income if you actively participate and your MAGI is under $100k (phasing out to $0 by $150k); unused losses carry forward. On sale, claimed depreciation is recaptured at up to 25%, and gains may owe capital-gains tax (a 1031 exchange can defer both). Figures are a year-1 estimate at your 24.0% rate — not tax advice; consult a CPA.
Schools (NCES district)
- District
- Galena Park ISD
- NCES district ID
- 4820250
- Math proficiency
- 32% ▼ -20.00%
- Reading proficiency
- 33% ▼ -7.00%
- Median HH income
- $43,158
- Composite
- 27.62/100
- National rank
- #6927
- State rank
- #578 of 826 in TX
Livability — Cloverleaf
- Score
- 63/100
- State rank
- #886
- US rank
- #15938
Category grades
Schools grade is shown separately in the Schools card above.
Census & demographics
- Census place
- Cloverleaf, TX
- County
- Harris County · 4,702,590 people
- Metro
- Houston-The Woodlands-Sugar Land, TX
- Population (ZIP)
- 58,415
- Household income
- $57,753
- Rent vs Own
- Severe rent burden
- 1816.0
Population outlook (Harris County) Hauer SSP2
- Today (2025)
- 5,571,493 people
- By 2030
- 6,089,821 · +9.3%
- By 2040
- 7,142,806 · +28.2%
- By 2050
- 8,185,864 · +46.9%
- By 2075
- 10,574,329 · +89.8%
- By 2100
- 12,109,958 · +117.4%
Race, ethnicity, and origin ACS 2023
- Neighborhood character
- Predominantly Hispanic (77%)
- Race & ethnicity
- Hispanic / Latino 77% Two or more races 54% Black 14% White 6% Asian 1% Native American 1%
- Hispanic origin (detail)
- Mexican 60% Cuban 2%
- Foreign-born
- 33% · Canada, Vietnam
- Languages at home
- 31% English-only · Spanish 68% Vietnamese 1%
Political lean MEDSL · Harris
- 2024 margin
- Lean D (+5.5) · D 52.0% · R 46.4% · Other 1.6%
- 2008→2024 swing
- +3.9pp toward D · 2008: 1.6pp · 2024: 5.5pp
- All cycles
- 2024: D+5.5 2020: D+13.3 2016: D+12.4 2012: D+0.1 2008: D+1.6
Not yet ingested
- Civics
- —
Market trends
- HPI YoY
- ▼ -36.47%
- Current HPI
- 300.1821
- Rent YoY
- ▼ -0.83%
- Metro
- Houston-The Woodlands-Sugar Land, TX
- State GDP YoY
- ▲ 3.95%
- F500 in state
- 110
Industry mix (Fortune 500 HQ in TX)
| Industry | F500 HQs | Revenue |
|---|---|---|
| Energy | 16 | $1,198B |
|
||
| Technology | 5 | $198B |
|
||
| Engineering / Construction | 4 | $72B |
|
||
| Energy Services | 3 | $60B |
|
||
| Utilities | 3 | $41B |
|
||
| Healthcare | 2 | $330B |
|
||
Price history
4 events — show timeline
- 2026-03-22 Pending — HARMLS
- 2026-03-12 Pending — HARMLS
- 2026-03-10 Listed $159,000 HARMLS
- 1988-01-02 Sold (Public Records) — Public Records
Property tax history
+3.4%/yrLatest (2025): $2,666 · +14.5% YoY. Source: county tax records.
Cash-flow waterfall
monthlySold comps — $/sqft
last 12 mo · ≤1 miLoading sold comps…