22 Independence Grn #22 · Montpelier, VT
Flood risk No data
- FEMA flood zone
- —
- Chance of flooding over 30 yrs
- —
- Est. flood insurance / yr
- —
Fire risk No data
- Est. fire insurance / yr
- —
Heat risk No data
- Hot days now (above threshold)
- —
- Hot days in 30 yrs
- —
Wind risk No data
- Chance of severe wind over 30 yrs
- —
Air-quality risk No data
- Unhealthy air days now
- —
- Unhealthy air days in 30 yrs
- —
Risk factors via First Street. Map © Google.
Why this score? — see what drove the D- grade
The composite is a weighted blend of 9 inputs, each scored 0–100. Each bar is that input's sub-score; the figure is the points it added to the 100-point composite (weight × sub-score).
- Cash flow +11.1/30.0
- ARV discount +7.5/15.0
- Schools +5.0/10.0
- Livability +4.2/5.0
- 1% rule +4.0/10.0
- DSCR +3.2/10.0
- Rent growth +2.5/5.0
- Condition / age +2.5/5.0
- Appreciation +0.0/10.0
$312,500
🖨 Deal sheet 📄 Offer letter ✓ Due diligence
Listing remarks MLS
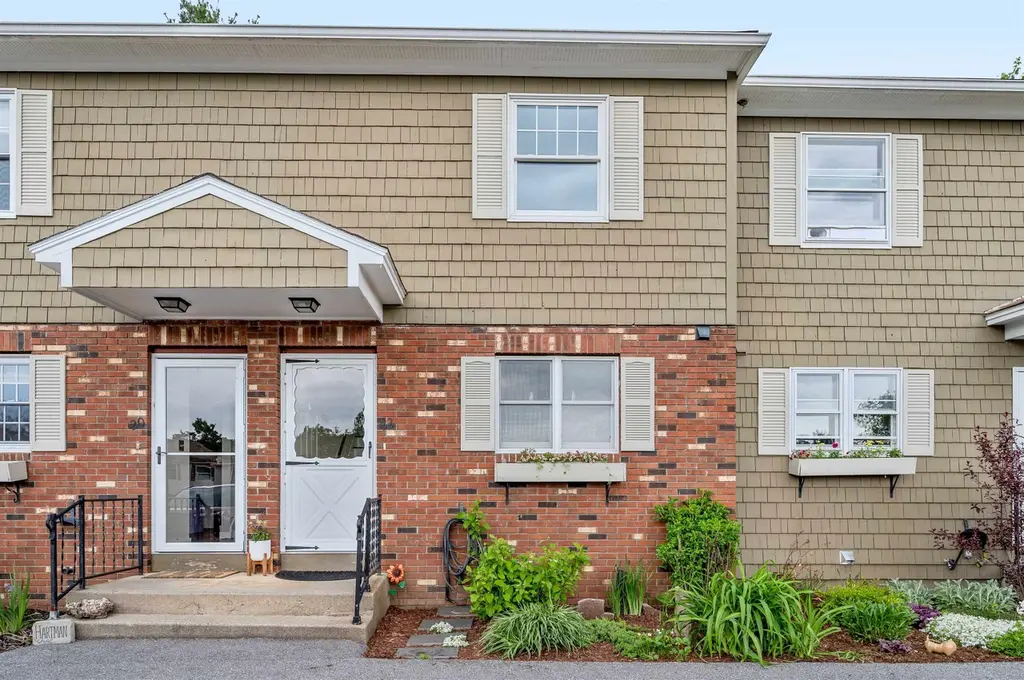
Who is looking for a cute and affordable condo in Montpelier? With a coat of fresh paint from top to bottom and a lot of the fiddly homeowner things already taken care of (that no one wants to do) like installing new toilets and GFCI outlets, for example, you’ll be able to move right in. You’ll love the light-filled living room that opens out on to the private back deck and the abundant storage and bonus space the basement provides. With a traditional layout and years of proven great resale values in this association community, you can choose to live in this home as-is or update it as you best see fit and build some sweat equity. So whether you’re looking for an easy place to live long term or something modest to hold you over until you land your “forever home, ” this condo is sure to check a lot of boxes. Easy and flexible showing times offered so don’t wait to see this condo as it surely won’t last long.
Key facts
- Mature flower beds
- Private oasis
- Stone patio
Tags
Property features AI
Finance
- Other: Surveyed
- HOA & community: Condo association with a one-time buy-in fee of $1,000; Monthly HOA fee of $338 covering landscaping, plowing, trash, and general HOA services; Association amenities include a playground
Exterior
- Parking: Common/shared paved driveway
- Utilities: Public water; Public sewer; Circuit breaker electrical service; High-speed internet available; Cable and telephone available
- Home design: Townhouse style; Unit number 22; Sage and brick exterior color; Shingle - asphalt roof; Existing construction
- Construction: Built in 1976; Wood frame with brick veneer exterior and shingle siding
- Exterior features: Condo development setting with landscaped grounds and sidewalks; Common/shared paved driveway; Association-maintained common land (approximately 10.1 acres)
Interior
- Bathrooms: One full bathroom; One half bathroom
- Heating & cooling: Heat pump and electric baseboard heating; Mini-split cooling
- Interior features: Five total rooms; Daylight, partially finished basement with interior stair access and storage; Interior access to basement; Insulated basement
Neighborhood map
What this means for you Summary
Snapshot
- This is a 2-bed/1.5-bath condo listed at $312k.
Deal economics
- At list price, monthly cash flow is $-127 ($-2k/yr) — negative.
- To cash-flow at today's rent, offer at most $290k (7.2% below list).
- To meet the 1% rule (rent ≥ 1% of price), the offer needs to be $280k (10.4% below list).
- Recommended offer: $280k (10.4% below list) — sets the bar for 1% rule.
- Cap rate 5.8% vs local median 2.4% in Montpelier — top-decile yield for the area; either an underpriced asset or a hidden risk that comps aren't pricing in. Stress-test before assuming the spread holds.
Location & tenants
- Location reads 84/100 on livability (#3 in VT, #670 nationally) — a professional / high-income tenant draw. Strengths: amenities A+, housing A+, health & safety A+; Watch: crime C-.
- Zoned schools: Union Elementary School (math 52% / reading 57%, grade C, #31 of 192 statewide, top 21%, 448 students, 13% FRL).
- Market conditions: 65 active listings in the ZIP; 1 comparable units currently listed for rent nearby; 185 units permitted in Washington County in 2024 (30 in 5+ unit buildings).
Forward outlook
- Local home prices are declining (-3.0%/yr); year-one equity from $2k of loan paydown is wiped out by about $9k of value loss. Plan a longer hold.
- Washington County population projected at -19% by 2050 — secular population decline; favor cash flow + early exit over multi-decade hold.
Negotiation context
- It's been on market 18 days — a 2% lower offer ($308k) is reasonable based on typical stale-listing flexibility.
- 2 sale attempts since 4y ago with the ask held roughly flat each time — persistent listings suggest the price (not the market) is what's stuck; bring a comps-based counter.
- Current owner paid $222k; 40% above their basis — modest negotiation headroom, anchor on the comps not their cost.
Questions for the listing agent
- What do current leases actually rent for vs. the listed asking? Can we see a recent rent roll and the last 12 months of T-12 income?
- Built in 1976 — when were the roof, HVAC, electrical panel, plumbing, and water heater last replaced?
- What does the HOA fee cover, when was the last increase, and are there any pending special assessments or reserve-fund shortfalls?
- Any open or pending special assessments — roof, HVAC, plumbing, elevator, façade? What's the per-unit balance and payoff schedule, and is the seller paying it off at close or rolling it to the buyer?
- Is there a deadline driving the sale (1031 exchange, divorce, estate, relocation)? That informs how much negotiation room exists.
- Schools are A-rated — typically a magnet for longer-tenancy family renters. What's the average tenant stay here, and is there a school-zone premium baked into asking?
- The area grade is low — what's the realistic commute time and amenity access for the typical tenant pool here? Any planned neighborhood developments (good or bad) we should know about?
- What's the average days-on-market for RENTAL listings here right now (not sales)? A rising rental-DOM trend means longer vacancies and softer asking-rent achievability than the comps imply.
- What's the recent tenant-quality profile in this submarket — average credit score on applications, eviction rate, late-payment / NSF rate, and stable-employment percentage? A property-management company in the area should have these aggregated.
- How much new apartment / multifamily construction is in the pipeline within 1–3 miles? Heavy new supply (>2% of stock underway) typically softens rents 12–24 months out; light construction supports rent growth.
Investment metrics
- 1% rule
- 0.90% ✗
- Cap rate
- 5.81%
- Cash-on-cash
- -1.74%
- DSCR
- 0.92
- GRM
- 9.3
CMA / ARV
No comps found within radius.
Projected returns pro-forma
-3.0% appreciation · 3.0% rent growth · sell at horizon
- IRR
- -19.1%
- Equity multiple
- 0.33×
- Total profit
- $-58,571
- Equity at exit
- $46,595
- IRR
- -11.6%
- Equity multiple
- 0.31×
- Total profit
- $-60,794
- Equity at exit
- $27,019
Cash invested: $87,500 (down + closing). Projections, not guarantees.
Landlord ↔ Tenant lean methodology
- Overall (STATE)
- 41 Moderately Tenant-Leaning
- State Vermont
- 41 Moderately Tenant-Leaning · D+15
- County
- — inherits STATE
- City
- — inherits STATE
ZIP-level market 05602
- Active inventory
- 65
- Price-to-rent
- 9.3×
Monthly cashflow live
- Estimated rent
- $2,800 medium interval (Pro) →
- Mortgage (P&I)
- −$1,639
- Tax from tax record
- −$232 /mo · $2,783/yr
- Insurance
- −$130
- HOA
- −$338
- Vacancy / Maint / Mgmt
- −$588
- Net cashflow
- $-127
Break-even live
UW: 25.0% down · 7.5% · 30yr · 1.5% tax · 5.0% vac · 8.0% maint · 8.0% mgmt
Financing live
Cash to close
- Down payment
- $78,125
- Closing costs
- $9,375
- Reserves months
- —
- Total cash needed
- —
Loan-product check · same deal, 3 products live
Conventional
25% down · 7.5% · 30yr
- Down + closing
- —
- Monthly P&I
- —
- Monthly cashflow
- —
- DSCR
- —
- Eligible?
- —
Personal DTI + credit; lowest rate.
DSCR
20% down · 8.5% · 30yr
- Down + closing
- —
- Monthly P&I
- —
- Monthly cashflow
- —
- DSCR
- —
- Eligible?
- —
No personal income docs; deal must DSCR.
Hard money
10% down · 12.0% · 12mo
- Down + closing
- —
- Monthly P&I
- —
- Monthly cashflow
- —
- DSCR
- —
- Eligible?
- —
Short-term bridge; refi at stabilization.
Rent comps 1 comps
| Address | Beds | Baths | Sqft | Rent | $/sqft | DOM | Units | Dist |
|---|---|---|---|---|---|---|---|---|
| 205 Forest Dr #3 Montpelier, VT | 2.0 | 1.0 | 972 | $2,800 | $2.88 | 44d | 1 | 1.41mi |
HOA detail condo
- Monthly dues
- $338 · $4,056/yr
- Assessments
- None detected in remarks — confirm with the listing agent.
Listing history 14 events
-
2026-06-19days on market $312,500 Active 18 DOM
-
2026-06-18days on market $312,500 Active 17 DOM
-
2026-06-17price $312,500 Active 16 DOM
-
2026-06-17days on market $315,000 Active 16 DOM
-
2026-06-16days on market $315,000 Active 15 DOM
-
2026-06-15days on market $315,000 Active 14 DOM
-
2026-06-14days on market $315,000 Active 12 DOM
-
2026-06-12days on market $315,000 Active 11 DOM
-
2026-06-09days on market $315,000 Active 8 DOM
-
2026-06-08days on market $315,000 Active 7 DOM
-
2026-06-07days on market $315,000 Active 6 DOM
-
2026-06-04days on market $315,000 Active 2 DOM
-
2026-06-01remarks 699-char remark
-
2026-06-01$315,000 Active 1 DOM
ⓘ Source: listings_history table (triggers on properties + properties_extension) + one-shot
backfill from property_details.listing_events for pre-trigger history.
Tax reassessment forecast VT · Partial reset (capped growth)
- Current annual tax
- $2,783 · $232/mo
- Projected year-2 tax
- $4,360 · $363/mo
- Expected delta
- +$1,577/yr (+$131/mo · 56.7%)
ⓘ Screening estimate from a state-policy table — verify with the county assessor before closing.
Nearby sold comps map
Loading sold comps map…
Walkable amenities ~0.75 mi
Loading nearby amenities…
Taxation est. · year 1
- Rental income
- $33,600
- − Mortgage interest
- −$17,505
- − Property taxes
- −$2,783
- − Insurance
- −$1,562
- − Repairs & maintenance
- −$2,688
- − Management
- −$2,688
- − HOA
- −$4,056
- − Depreciation
- −$9,091
- Taxable loss
- −$6,774
- Est. tax savings @ 24.0%
- +$1,626
- After-tax cash flow
- $102/yr
For passive investors: Depreciation is non-cash, so a rental often shows a tax loss while cash-flowing — sheltering income. Rental losses are passive: they offset passive income freely, and up to $25,000/yr can offset ordinary (W-2) income if you actively participate and your MAGI is under $100k (phasing out to $0 by $150k); unused losses carry forward. On sale, claimed depreciation is recaptured at up to 25%, and gains may owe capital-gains tax (a 1031 exchange can defer both). Figures are a year-1 estimate at your 24.0% rate — not tax advice; consult a CPA.
Schools (NCES district)
No district data.
Livability — Montpelier
- Score
- 84/100
- State rank
- #3
- US rank
- #670
Category grades
Schools grade is shown separately in the Schools card above.
Census & demographics
- Census place
- Montpelier, VT
- Population (ZIP)
- 12,491
Population outlook (Washington County) Hauer SSP2
- Today (2025)
- 56,608 people
- By 2030
- 54,731 · -3.3%
- By 2040
- 50,227 · -11.3%
- By 2050
- 45,893 · -18.9%
- By 2075
- 36,818 · -35.0%
- By 2100
- 28,143 · -50.3%
Race, ethnicity, and origin ACS 2023
- Neighborhood character
- Predominantly White (89%)
- Race & ethnicity
- White 89% Two or more races 6% Hispanic / Latino 3% Asian 1% Black 1%
- Common ancestry
- Lithuanian 6% Slovak 4% Romanian 3%
- Foreign-born
- 4% · Canada
- Languages at home
- 95% English-only · French/Haitian/Cajun 2% Spanish 1% Russian/Polish/Slavic 1%
Political lean MEDSL · Washington
- 2024 margin
- Solid D (+43.4) · D 70.0% · R 26.6% · Other 3.4%
- 2008→2024 swing
- +2.4pp toward D · 2008: 41.0pp · 2024: 43.4pp
- All cycles
- 2024: D+43.4 2020: D+46.1 2016: D+37.0 2012: D+42.2 2008: D+41.0
Not yet ingested
- Civics
- —
Market trends
- HPI YoY
- ▼ -195.34%
- Current HPI
- 344.3382
- Rent YoY
- —
- Metro
- —
- State GDP YoY
- —
- F500 in state
- 0
Price history
+58.3% since first listed5 events — show timeline
- 2026-06-01 Listed $315,000 PrimeMLS
- 2022-05-23 Sold (Public Records) $222,500 Public Records
- 2022-05-18 Sold (MLS) $222,500 PrimeMLS
- 2022-03-28 Contingent — PrimeMLS
- 2022-03-22 Listed $199,000 PrimeMLS
Property tax history
+18.1%/yrLatest (2024): $2,783 · +15.0% YoY. Source: county tax records.
Cash-flow waterfall
monthlySold comps — $/sqft
last 12 mo · ≤1 miLoading sold comps…