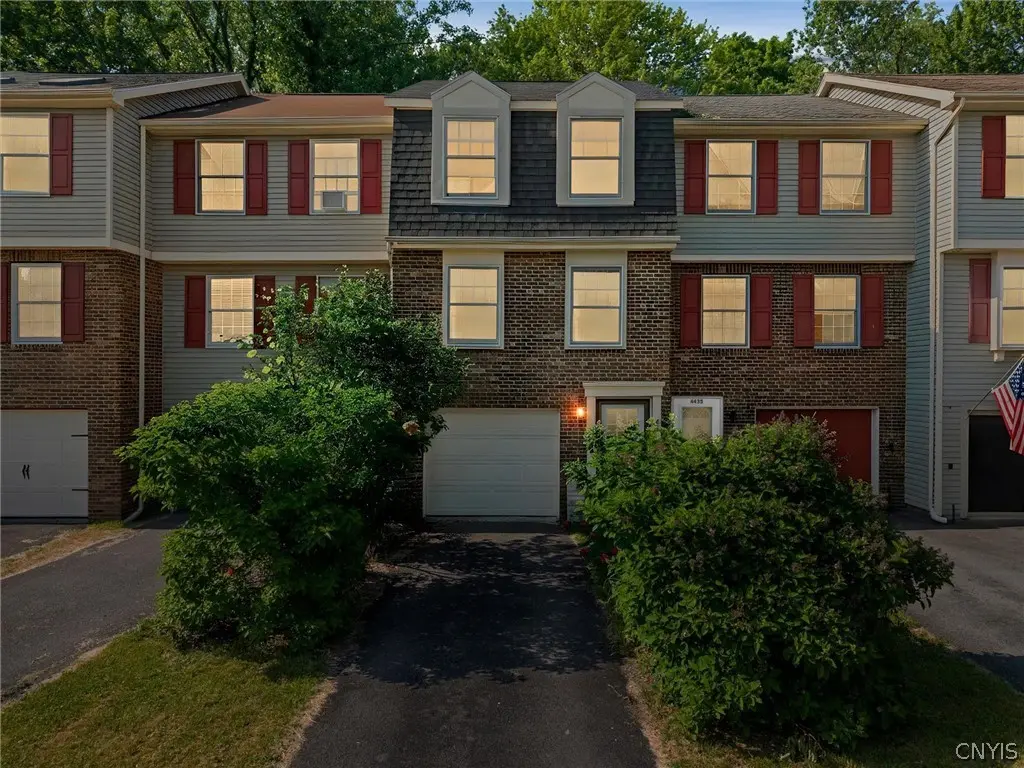
4433 Heritage Dr · Liverpool, NY
Flood risk 1/10 · Minimal
- FEMA flood zone
- X (unshaded)
- Chance of flooding over 30 yrs
- 0.0%
- Est. flood insurance / yr
- $473 – $860
Fire risk 2/10 · Minimal
- Est. fire insurance / yr
- $691 – $1,283
Heat risk 3/10 · Minor
- Hot days now (above 95°F)
- 7 days/yr
- Hot days in 30 yrs
- 16 days/yr
Wind risk 1/10 · Minimal
- Chance of severe wind over 30 yrs
- 1.0%
Air-quality risk 2/10 · Minimal
- Unhealthy air days now
- 1 days/yr
- Unhealthy air days in 30 yrs
- 1 days/yr
Risk factors via First Street. Map © Google.
Why this score? — see what drove the C- grade
The composite is a weighted blend of 9 inputs, each scored 0–100. Each bar is that input's sub-score; the figure is the points it added to the 100-point composite (weight × sub-score).
- Cash flow +17.4/30.0
- ARV discount +8.8/15.0
- 1% rule +5.8/10.0
- DSCR +5.4/10.0
- Schools +4.3/10.0
- Livability +4.3/5.0
- Rent growth +2.5/5.0
- Condition / age +2.5/5.0
- Appreciation +0.0/10.0
$179,000
🖨 Deal sheet (PDF) 📄 Offer letter ✓ Due diligence
Listing remarks MLS
Move right in to this lovely townhome boasting a private yard and new deck to enjoy it. New roof and central air and truly ready to place your furniture. Showings Wednesday April 13 at 10 am til Sunday April 17 at noon and any offers will be reviewed Monday April 18 at noon. All offers need to be in by noon on Sunday April 17, 2022
Key facts
- Private deck
- Peaceful yard
- Open layout
Tags
Property features AI
Finance
- Financial info: Pets allowed
Exterior
- Parking: Attached garage; Underground garage with garage door opener; 1 garage space; See remarks regarding parking
- Utilities: Public water connected; Sewer connected; Cable available; High-speed internet available; Circuit breaker electrical service
- Home design: Two-story property; Resale condition
- Construction: Brick and vinyl siding exterior; Shingle roof; Existing structure
- Exterior features: Deck; Barbecue
Interior
- Kitchen: Gas oven and gas range; Microwave; Range hood; Dishwasher; Garbage disposal; Refrigerator; Exhaust fan
- Bedrooms: Total rooms: 6 (includes living, laundry, storage — bedroom count not specified)
- Flooring: Carpet; Laminate; Tile; Various flooring types
- Bathrooms: One full bathroom; One half bathroom; One main-level bathroom
- Heating & cooling: Gas heating with forced air; Central air conditioning
- Interior features: Breakfast bar; Separate/formal living room; Kitchen/family room combo; Open living/dining area; Sliding glass door(s); Storage; Sliding doors
- Laundry & utility: Washer and dryer; Laundry located in basement
Neighborhood map
What this means for you Summary
Snapshot
- This is a 2-bed/1.5-bath townhouse listed at $179k.
Deal economics
- At list price, monthly cash flow is $133 ($2k/yr) — positive.
- The deal already cash-flows at list — no discount required.
- Meets the 1% rule at list price ($2k rent vs $179k).
- Cap rate 7.2% vs local median 5.0% in Liverpool — top-decile yield for the area; either an underpriced asset or a hidden risk that comps aren't pricing in. Stress-test before assuming the spread holds.
Location & tenants
- Location reads 86/100 on livability (#16 in NY, #363 nationally) — a professional / high-income tenant draw. Strengths: commute A+, housing A+, health & safety A+.
- Liverpool Central School District (suburban): math 49% / reading 49% proficiency, ranked #381 of 590 in NY (top 65%) — families likely to look elsewhere, expect single-tenant / working-renter base with shorter leases.
- Zoned schools: Long Branch Elementary School (math 42% / reading 47%, grade F, #1,277 of 2,108 statewide, top 64%, 354 students, 54% FRL); Liverpool Middle School (math 47% / reading 62%, grade B-, #214 of 729 statewide, top 31%, 313 students, 51% FRL); Liverpool High School (math 94% / reading 54%, grade B+, #658 of 1,100 statewide, top 60%, 2,124 students, 42% FRL) — zoned schools average 49% FRL vs 28% district-wide (21 pts higher); higher-poverty schools than district average — tighter screening recommended.
- Market conditions: 94 active listings in the ZIP; 2 comparable units currently listed for rent nearby; solid renter incomes; 616 units permitted in Onondaga County in 2024 (256 in 5+ unit buildings).
Forward outlook
- Local home prices are declining (-3.0%/yr); year-one equity from $1k of loan paydown is wiped out by about $5k of value loss. Plan a longer hold.
- Onondaga County population projected to shrink 9% by 2050 — rents likely to lag national; underwrite the cash flow, not the appreciation.
Negotiation context
- Only 4 days on market — expect competitive offers; lowballing is unlikely to land.
- 4 sale attempts since 15y ago with the ask held roughly flat each time — persistent listings suggest the price (not the market) is what's stuck; bring a comps-based counter.
- Current owner paid $135k; 33% above their basis — modest negotiation headroom, anchor on the comps not their cost.
Risks & watch-outs
- Watch-outs: property tax is 2.6% of price.
Questions for the listing agent
- Property tax is high relative to price — has the assessment been appealed recently, and will the sale trigger a re-assessment?
- Is there a deadline driving the sale (1031 exchange, divorce, estate, relocation)? That informs how much negotiation room exists.
- What's the average days-on-market for RENTAL listings here right now (not sales)? A rising rental-DOM trend means longer vacancies and softer asking-rent achievability than the comps imply.
- What's the recent tenant-quality profile in this submarket — average credit score on applications, eviction rate, late-payment / NSF rate, and stable-employment percentage? A property-management company in the area should have these aggregated.
- How much new for-sale + rental construction is in the pipeline within 1–3 miles? Heavy new supply typically softens prices + rents 12–24 months out; constrained supply supports both.
Investment metrics
- 1% rule
- 1.08% ✓
- Cap rate
- 7.19%
- Cash-on-cash
- 3.19%
- DSCR
- 1.14
- GRM
- 7.7
CMA / ARV
- ARV (on-the-fly)
- $184,464
- Comps found
- 5
Show comp detail 5 sales within ~0.75 mi
| Address | Dist | Beds/Ba | Sqft | Sold | Price | $/sf | Match |
|---|---|---|---|---|---|---|---|
| 4429 Heritage Dr | 0.00mi | 2/1.5 | 976 (0%) | 7mo | $178,000 | $182 | 94 |
| 4407 Heritage Dr | 0.06mi | 2/1.5 | 944 (-3%) | 12mo | $185,000 | $196 | 82 |
| 4423 Heritage Dr | 0.02mi | 2/1.5 | 976 (0%) | 24mo | $166,000 | $170 | 79 |
| 4363 Heritage Dr | 0.16mi | 2/1.5 | 960 (-2%) | 20mo | $181,025 | $189 | 74 |
| 4431 Heritage Dr | 0.00mi | 2/1.5 | 864 (-12%) | 22mo | $166,280 | $192 | 63 |
Match score weights: distance 35% · size 25% · config 20% · recency 20%. Top-matched comps best support the ARV.
Projected returns pro-forma
-3.0% appreciation · 3.0% rent growth · sell at horizon
- IRR
- -11.2%
- Equity multiple
- 0.59×
- Total profit
- $-20,400
- Equity at exit
- $26,689
- IRR
- -1.8%
- Equity multiple
- 0.87×
- Total profit
- $-6,331
- Equity at exit
- $15,477
Cash invested: $50,120 (down + closing). Projections, not guarantees.
Landlord ↔ Tenant lean methodology
- Overall (STATE)
- 15 Strongly Tenant-Friendly
- State New York
- 15 Strongly Tenant-Friendly · D+10
- County
- — inherits STATE
- City
- — inherits STATE
ZIP-level market 13090
- Active inventory
- 94
- Price-to-rent
- 7.7×
Monthly cashflow live
- Estimated rent
- $1,935 medium interval (Pro) →
- Mortgage (P&I)
- −$939
- Tax from tax record
- −$382 /mo · $4,587/yr
- Insurance
- −$75
- HOA
- −$0
- Vacancy / Maint / Mgmt
- −$406
- Net cashflow
- $133
Break-even live
Sensitivity live
| Price | -10% $234 | -5% $184 | +0% $133 | +5% $82 | +10% $32 |
|---|---|---|---|---|---|
| Rent | -10% $-20 | -5% $57 | +0% $133 | +5% $210 | +10% $286 |
| Rate | -1.0pp $223 | -0.5pp $179 | base $133 | +0.5pp $87 | +1.0pp $40 |
UW: 25.0% down · 7.5% · 30yr · 1.5% tax · 5.0% vac · 8.0% maint · 8.0% mgmt
Financing live
Cash to close
- Down payment
- $44,750
- Closing costs
- $5,370
- Reserves months
- —
- Total cash needed
- —
Loan-product check · same deal, 3 products live
Conventional
25% down · 7.5% · 30yr
- Down + closing
- —
- Monthly P&I
- —
- Monthly cashflow
- —
- DSCR
- —
- Eligible?
- —
Personal DTI + credit; lowest rate.
DSCR
20% down · 8.5% · 30yr
- Down + closing
- —
- Monthly P&I
- —
- Monthly cashflow
- —
- DSCR
- —
- Eligible?
- —
No personal income docs; deal must DSCR.
Hard money
10% down · 12.0% · 12mo
- Down + closing
- —
- Monthly P&I
- —
- Monthly cashflow
- —
- DSCR
- —
- Eligible?
- —
Short-term bridge; refi at stabilization.
Rent comps 2 comps
| Address | Beds | Baths | Sqft | Rent | $/sqft | DOM | Units | Dist |
|---|---|---|---|---|---|---|---|---|
| 4314 Wetzel Rd Liverpool, NY | 2.0 | 1.0 | 900 | $1,200 | $1.33 | 45d | 1 | 0.42mi |
| 7648 Autumnal Ln Liverpool, NY | 3.0 | 1.5 | 1100 | $2,500 | $2.27 | 15d | 1 | 1.37mi |
Listing history 5 events
-
2026-06-15status $179,000 Pending 4 DOM
-
2026-06-15days on market $179,000 Active 4 DOM
-
2026-06-14days on market $179,000 Active 2 DOM
-
2026-06-13remarks 577-char remark
-
2026-06-13$179,000 Active 1 DOM
ⓘ Source: listings_history table (triggers on properties + properties_extension) + one-shot
backfill from property_details.listing_events for pre-trigger history.
Tax reassessment forecast NY · Partial reset (capped growth)
- Current annual tax
- $4,587 · $382/mo
- Projected year-2 tax
- $4,587 · $382/mo
- Expected delta
- $0/yr ($0/mo · 0.0%)
ⓘ Screening estimate from a state-policy table — verify with the county assessor before closing.
Climate risk First Street
- Flood 1/10 Low FEMA zone X (unshaded) · 0% chance over 30 yrs
- Wildfire 2/10 Low
- Heat 3/10 Moderate 7 d/yr ≥95°F today · 16 d/yr by 30 yrs out
- Wind 1/10 Low 100% chance of damaging wind over 30 yrs
- Air quality 2/10 Low 1 unhealthy d/yr today · 1 by 30 yrs out
Nearby sold comps map
Loading sold comps map…
Walkable amenities ~0.75 mi
Loading nearby amenities…
Taxation est. · year 1
- Rental income
- $23,220
- − Mortgage interest
- −$10,027
- − Property taxes
- −$4,587
- − Insurance
- −$895
- − Repairs & maintenance
- −$1,858
- − Management
- −$1,858
- − Depreciation
- −$5,207
- Taxable loss
- −$1,211
- Est. tax savings @ 24.0%
- +$291
- After-tax cash flow
- $1,888/yr
For passive investors: Depreciation is non-cash, so a rental often shows a tax loss while cash-flowing — sheltering income. Rental losses are passive: they offset passive income freely, and up to $25,000/yr can offset ordinary (W-2) income if you actively participate and your MAGI is under $100k (phasing out to $0 by $150k); unused losses carry forward. On sale, claimed depreciation is recaptured at up to 25%, and gains may owe capital-gains tax (a 1031 exchange can defer both). Figures are a year-1 estimate at your 24.0% rate — not tax advice; consult a CPA.
Schools (NCES district)
- District
- Liverpool Central School District
- NCES district ID
- 3617520
- Math proficiency
- 49% ▼ -6.00%
- Reading proficiency
- 49% ▲ 1.00%
- Median HH income
- $59,134
- Composite
- 42.84/100
- National rank
- #3134
- State rank
- #381 of 590 in NY
Livability — Liverpool
- Score
- 86/100
- State rank
- #16
- US rank
- #363
Category grades
Schools grade is shown separately in the Schools card above.
Census & demographics
- County
- Onondaga County · 247,257 people
- City population
- 29,004
- Metro
- Syracuse, NY
- Population (ZIP)
- 29,004
- Household income
- $88,492
- Rent vs Own
- Severe rent burden
- 733.0
Population outlook (Onondaga County) Hauer SSP2
- Today (2025)
- 467,894 people
- By 2030
- 463,381 · -1.0%
- By 2040
- 447,697 · -4.3%
- By 2050
- 426,399 · -8.9%
- By 2075
- 373,661 · -20.1%
- By 2100
- 307,967 · -34.2%
Race, ethnicity, and origin ACS 2023
- Neighborhood character
- Predominantly White (79%)
- Race & ethnicity
- White 79% Two or more races 9% Hispanic / Latino 7% Black 6% Asian 3%
- Hispanic origin (detail)
- Mexican 1% Puerto Rican 4%
- Common ancestry
- Romanian 7% Lithuanian 4% Italian 2%
- Foreign-born
- 6% · Canada, China, South Korea
- Languages at home
- 93% English-only · Other Indo-European 2% Spanish 1% Russian/Polish/Slavic 1%
Political lean MEDSL · Onondaga
- 2024 margin
- D (+17.3) · D 58.6% · R 41.4%
- 2008→2024 swing
- -3.0pp toward R · 2008: 20.3pp · 2024: 17.3pp
- All cycles
- 2024: D+17.3 2020: D+20.6 2016: D+12.8 2012: D+21.1 2008: D+20.3
Not yet ingested
- Civics
- —
Market trends
- HPI YoY
- ▼ -228.53%
- Current HPI
- 320.4989
- Rent YoY
- —
- Metro
- Syracuse, NY
- State GDP YoY
- ▲ 2.60%
- F500 in state
- 92
Industry mix (Fortune 500 HQ in NY)
| Industry | F500 HQs | Revenue |
|---|---|---|
| Financial Services | 10 | $950B |
|
||
| Consumer Goods | 9 | $162B |
|
||
| Insurance | 4 | $225B |
|
||
| Telecommunications | 2 | $144B |
|
||
| Pharmaceuticals | 2 | $112B |
|
||
| Media / Entertainment | 2 | $69B |
|
||
Price history
+297.8% since first listed14 events — show timeline
- 2026-06-11 Listed $179,000 CNYIS
- 2022-06-13 Sold (Public Records) $135,000 Public Records
- 2022-06-10 Sold (MLS) $135,000 CNYIS
- 2022-04-21 Pending — CNYIS
- 2022-04-18 Contingent — CNYIS
- 2022-04-11 Listed $129,900 CNYIS
- 2016-09-16 Sold (Public Records) $70,500 Public Records
- 2016-09-15 Sold (MLS) $70,150 CNYIS
- 2016-08-08 Contingent — CNYIS
- 2016-05-19 Price Changed $73,900 CNYIS
- 2016-03-16 Listed $74,900 CNYIS
- 2011-09-06 Listed $79,900 WNYREIS
- 2001-11-05 Sold (Public Records) $55,000 Public Records
- 1995-02-09 Sold (Public Records) $45,000 Public Records
Property tax history
+1.6%/yrLatest (2025): $4,587 · +4.1% YoY. Source: county tax records.
Cash-flow waterfall
monthlySold comps — $/sqft
last 12 mo · ≤1 miLoading sold comps…