 Triplex
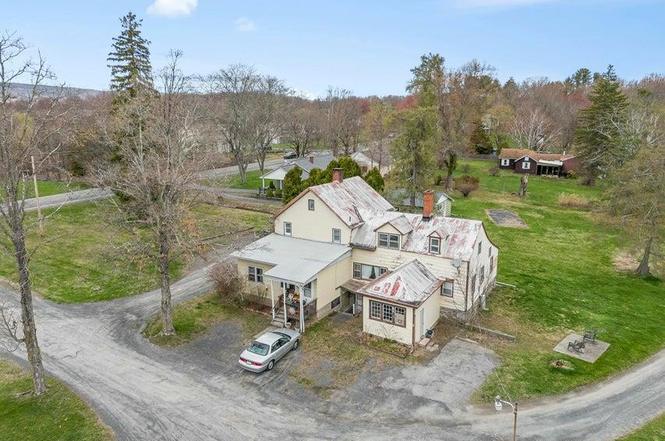
236 State Route 32 S · New Paltz, NY
Flood risk 1/10 · Minimal
- FEMA flood zone
- X (unshaded)
- Chance of flooding over 30 yrs
- 0.0%
- Est. flood insurance / yr
- $473 – $860
Fire risk 4/10 · Minor
- Est. fire insurance / yr
- $691 – $1,283
Heat risk 4/10 · Minor
- Hot days now (above 96°F)
- 7 days/yr
- Hot days in 30 yrs
- 15 days/yr
Wind risk 4/10 · Minor
- Chance of severe wind over 30 yrs
- 10.0%
Air-quality risk 2/10 · Minimal
- Unhealthy air days now
- 1 days/yr
- Unhealthy air days in 30 yrs
- 2 days/yr
Risk factors via First Street. Map © Google.
Why this score? — see what drove the B- grade
The composite is a weighted blend of 9 inputs, each scored 0–100. Each bar is that input's sub-score; the figure is the points it added to the 100-point composite (weight × sub-score).
- Cash flow +26.4/30.0
- DSCR +9.0/10.0
- ARV discount +7.5/15.0
- 1% rule +7.0/10.0
- Schools +6.7/10.0
- Livability +4.0/5.0
- Rent growth +2.5/5.0
- Condition / age +2.5/5.0
- Appreciation +0.0/10.0
$475,000
🖨 Deal sheet 📄 Offer letter ✓ Due diligence
Multi-family units
County records classify this as Multi-Family (2-4 Unit). Listing-text estimate: 3 units. confirmed
Listing remarks
Excellent Investment Opportunity - Fully Occupied 3-Family with Expansion Potential This income-generating 3-family property is fully occupied and currently bringing in 4,350 per month, with tenants responsible for all utilities. The building features two 1-bedroom units and one 2-bedroom unit, with an unfinished 4th unit that offers excellent potential for added value. The entire floor is included in the tax-recorded square footage and can be reconverted into a legal unit with the proper permits—unlocking even more income potential. Highlights include a durable metal roof, ample off-street parking with space for more vehicles than needed, and a solid rental history. While the exterio
Key facts
- Durable metal roof
- Unfinished unit
- Off street parking
Tags
Neighborhood map
What this means for you Summary
Snapshot
- This is a 2×1bd/1.0ba + 1×2bd/1.0ba units multifamily listed at $475k.
Deal economics
- At list price, monthly cash flow is $1k ($15k/yr) — positive. Per door: $413/mo.
- The deal already cash-flows at list — no discount required.
- Meets the 1% rule at list price ($6k rent vs $475k).
- Recommended offer: $418k (12.0% below list) — sets the bar for market timing.
- Cap rate 9.4% vs local median 1.8% in New Paltz — top-decile yield for the area; either an underpriced asset or a hidden risk that comps aren't pricing in. Stress-test before assuming the spread holds.
Location & tenants
- Location reads 79/100 on livability (#128 in NY, #2,042 nationally) — a middle-class / working-renter tenant base. Strengths: amenities A+, commute A+, health & safety A+; Watch: crime C-, housing D+, employment D-.
- New Paltz Central School District (suburban): math 67% / reading 88% proficiency, ranked #70 of 590 in NY (top 12%) — strong family-tenant draw, lease renewals of 3-5y typical; only 19% free/reduced lunch — higher-income household profile.
- Zoned schools: Duzine School (317 students, 27% FRL); New Paltz Middle School (math 24% / reading 74%, grade C, #280 of 729 statewide, top 40%, 421 students, 28% FRL); New Paltz Senior High School (math 97% / reading 100%, grade A+, #10 of 1,100 statewide, top 1%, 668 students, 27% FRL).
- Market conditions: 92 active listings in the ZIP; 464 units permitted in Ulster County in 2024 (170 in 5+ unit buildings).
Forward outlook
- Local home prices are declining (-3.0%/yr); year-one equity from $3k of loan paydown is wiped out by about $14k of value loss. Plan a longer hold.
- Ulster County population projected at -14% by 2050 — secular population decline; favor cash flow + early exit over multi-decade hold.
- At projected returns (-3.0% appreciation + 3.0% rent growth), your $133k cash investment doubles in ~10 years — after that, you're playing with house money.
Negotiation context
- It's been on market 176 days — a 12% lower offer ($418k) is reasonable based on typical stale-listing flexibility.
- 2 sale attempts with the ask held roughly flat each time — persistent listings suggest the price (not the market) is what's stuck; bring a comps-based counter.
- Current owner paid $290k; list at $475k implies a 64% gain — meaningful room to come down on a strong offer.
Risks & watch-outs
- Watch-outs: built in 1900 — expect roof / HVAC / electrical / plumbing capex.
Questions for the listing agent
- It's been on market 176 days. Have you received any prior offers? Is the seller open to a 12% concession, seller financing, or rate buy-down credit?
- Can we see the unit-by-unit rent roll, current vacancy, and any below-market leases? What's the average tenancy length?
- What capital expenditures (roof, boiler, parking lot, exteriors) have been made in the last 5 years, and what's planned in the next 2?
- Built in 1900 — when were the roof, HVAC, electrical panel, plumbing, and water heater last replaced?
- Why hasn't it sold? Are there any deal-killer items the seller is aware of (foundation, flood, title, zoning, code violations)?
- Is there a deadline driving the sale (1031 exchange, divorce, estate, relocation)? That informs how much negotiation room exists.
- Schools are A-rated — typically a magnet for longer-tenancy family renters. What's the average tenant stay here, and is there a school-zone premium baked into asking?
- What's the average days-on-market for RENTAL listings here right now (not sales)? A rising rental-DOM trend means longer vacancies and softer asking-rent achievability than the comps imply.
- What's the recent tenant-quality profile in this submarket — average credit score on applications, eviction rate, late-payment / NSF rate, and stable-employment percentage? A property-management company in the area should have these aggregated.
- How much new apartment / multifamily construction is in the pipeline within 1–3 miles? Heavy new supply (>2% of stock underway) typically softens rents 12–24 months out; light construction supports rent growth.
Investment metrics
- 1% rule
- 1.20% ✓
- Cap rate
- 9.43%
- Cash-on-cash
- 11.19%
- DSCR
- 1.50
- GRM
- 6.9
CMA / ARV
No comps found within radius.
Projected returns pro-forma
-3.0% appreciation · 3.0% rent growth · sell at horizon
- IRR
- 0.4%
- Equity multiple
- 1.02×
- Total profit
- $2,071
- Equity at exit
- $70,824
- IRR
- 10.1%
- Equity multiple
- 1.78×
- Total profit
- $103,793
- Equity at exit
- $41,069
Cash invested: $133,000 (down + closing). Projections, not guarantees.
Landlord ↔ Tenant lean methodology
- Overall (STATE)
- 15 Strongly Tenant-Friendly
- State New York
- 15 Strongly Tenant-Friendly · D+10
- County
- — inherits STATE
- City
- — inherits STATE
ZIP-level market 12561
- Active inventory
- 92
- Price-to-rent
- 21.3×
Monthly cashflow live
- Estimated rent
- $5,704 medium interval (Pro) →
- Mortgage (P&I)
- −$2,491
- Tax from tax record
- −$577 /mo · $6,930/yr
- Insurance
- −$198
- HOA
- −$0
- Vacancy / Maint / Mgmt
- −$1,198
- Net cashflow
- $1,240
Break-even live
3-unit breakdown (identical units grouped — click to expand)
| Units | Beds | Baths | Est. rent |
|---|---|---|---|
| 2× units | 1 | 1 | $3,718 |
| #1 | 1 | 1 | $1,859 |
| #2 | 1 | 1 | $1,859 |
| 1× unit | 2 | 1 | $1,985 |
| Total (3 units) | $5,704 | ||
UW: 25.0% down · 7.5% · 30yr · 1.5% tax · 5.0% vac · 8.0% maint · 8.0% mgmt
Financing live
Cash to close
- Down payment
- $118,750
- Closing costs
- $14,250
- Reserves months
- —
- Total cash needed
- —
Loan-product check · same deal, 3 products live
Conventional
25% down · 7.5% · 30yr
- Down + closing
- —
- Monthly P&I
- —
- Monthly cashflow
- —
- DSCR
- —
- Eligible?
- —
Personal DTI + credit; lowest rate.
DSCR
20% down · 8.5% · 30yr
- Down + closing
- —
- Monthly P&I
- —
- Monthly cashflow
- —
- DSCR
- —
- Eligible?
- —
No personal income docs; deal must DSCR.
Hard money
10% down · 12.0% · 12mo
- Down + closing
- —
- Monthly P&I
- —
- Monthly cashflow
- —
- DSCR
- —
- Eligible?
- —
Short-term bridge; refi at stabilization.
Listing history 7 events
-
2025-10-15status Pending
-
2025-10-15status Pending
-
2025-06-09historical Active Under Contract
-
2025-04-22$475,000 Active
-
2025-04-21$475,000 Active
-
2022-12-02soldstatus $290,000
-
1983-11-03soldstatus $120,000
ⓘ Source: listings_history table (triggers on properties + properties_extension) + one-shot
backfill from property_details.listing_events for pre-trigger history.
Tax reassessment forecast NY · Partial reset (capped growth)
- Current annual tax
- $6,930 · $577/mo
- Projected year-2 tax
- $7,479 · $623/mo
- Expected delta
- +$549/yr (+$46/mo · 7.9%)
ⓘ Screening estimate from a state-policy table — verify with the county assessor before closing.
Climate risk First Street
- Flood 1/10 Low FEMA zone X (unshaded) · 0% chance over 30 yrs
- Wildfire 4/10 Moderate
- Heat 4/10 Moderate 7 d/yr ≥96°F today · 15 d/yr by 30 yrs out
- Wind 4/10 Moderate 10% chance of damaging wind over 30 yrs
- Air quality 2/10 Low 1 unhealthy d/yr today · 2 by 30 yrs out
Nearby sold comps map
Loading sold comps map…
Walkable amenities ~0.75 mi
Loading nearby amenities…
Taxation est. · year 1
- Rental income
- $68,448
- − Mortgage interest
- −$26,607
- − Property taxes
- −$6,930
- − Insurance
- −$2,375
- − Repairs & maintenance
- −$5,476
- − Management
- −$5,476
- − Depreciation
- −$13,818
- Taxable income
- $7,766
- Est. tax owed @ 24.0%
- −$1,864
- After-tax cash flow
- $13,014/yr
For passive investors: Depreciation is non-cash, so a rental often shows a tax loss while cash-flowing — sheltering income. Rental losses are passive: they offset passive income freely, and up to $25,000/yr can offset ordinary (W-2) income if you actively participate and your MAGI is under $100k (phasing out to $0 by $150k); unused losses carry forward. On sale, claimed depreciation is recaptured at up to 25%, and gains may owe capital-gains tax (a 1031 exchange can defer both). Figures are a year-1 estimate at your 24.0% rate — not tax advice; consult a CPA.
Schools (NCES district)
- District
- New Paltz Central School District
- NCES district ID
- 3620460
- Math proficiency
- 67% ▲ 5.00%
- Reading proficiency
- 88% ▲ 28.00%
- Median HH income
- $68,223
- Composite
- 67.25/100
- National rank
- #386
- State rank
- #70 of 590 in NY
Livability — New Paltz
- Score
- 79/100
- State rank
- #128
- US rank
- #2042
Category grades
Schools grade is shown separately in the Schools card above.
Census & demographics
- Population (ZIP)
- 18,531
Population outlook (Ulster County) Hauer SSP2
- Today (2025)
- 175,887 people
- By 2030
- 171,876 · -2.3%
- By 2040
- 161,771 · -8.0%
- By 2050
- 151,470 · -13.9%
- By 2075
- 133,023 · -24.4%
- By 2100
- 113,504 · -35.5%
Race, ethnicity, and origin ACS 2023
- Neighborhood character
- Predominantly White (73%)
- Race & ethnicity
- White 73% Hispanic / Latino 11% Two or more races 9% Black 6% Asian 4%
- Hispanic origin (detail)
- Mexican 1% Puerto Rican 4% Dominican 1%
- Common ancestry
- Romanian 3% Slovak 3% Scotch-Irish 3%
- Foreign-born
- 9% · Canada, China
- Languages at home
- 87% English-only · Spanish 5% Other Asian/Pacific 2% Chinese 1%
Political lean MEDSL · Ulster
- 2024 margin
- D (+18.7) · D 59.3% · R 40.7%
- 2008→2024 swing
- -4.9pp toward R · 2008: 23.6pp · 2024: 18.7pp
- All cycles
- 2024: D+18.7 2020: D+20.9 2016: D+9.1 2012: D+21.9 2008: D+23.6
Not yet ingested
- Civics
- —
Market trends
- HPI YoY
- ▼ -203.50%
- Current HPI
- 331.5122
- Rent YoY
- —
- Metro
- —
- State GDP YoY
- ▲ 2.60%
- F500 in state
- 92
Industry mix (Fortune 500 HQ in NY)
| Industry | F500 HQs | Revenue |
|---|---|---|
| Financial Services | 10 | $950B |
|
||
| Consumer Goods | 9 | $162B |
|
||
| Insurance | 4 | $225B |
|
||
| Telecommunications | 2 | $144B |
|
||
| Pharmaceuticals | 2 | $112B |
|
||
| Media / Entertainment | 2 | $69B |
|
||
Price history
+295.8% since first listed7 events — show timeline
- 2025-10-15 Pending — HVCRMLS
- 2025-10-15 Pending — OneKey® MLS as Distributed by MLS Grid
- 2025-06-09 Contingent — HVCRMLS
- 2025-04-22 Listed $475,000 HVCRMLS
- 2025-04-21 Listed $475,000 OneKey® MLS as Distributed by MLS Grid
- 2022-12-02 Sold (Public Records) $290,000 Public Records
- 1983-11-03 Sold (Public Records) $120,000 Public Records
Property tax history
+2.0%/yrLatest (2025): $6,930 · +1.5% YoY. Source: county tax records.
Cash-flow waterfall
monthlySold comps — $/sqft
last 12 mo · ≤1 miLoading sold comps…