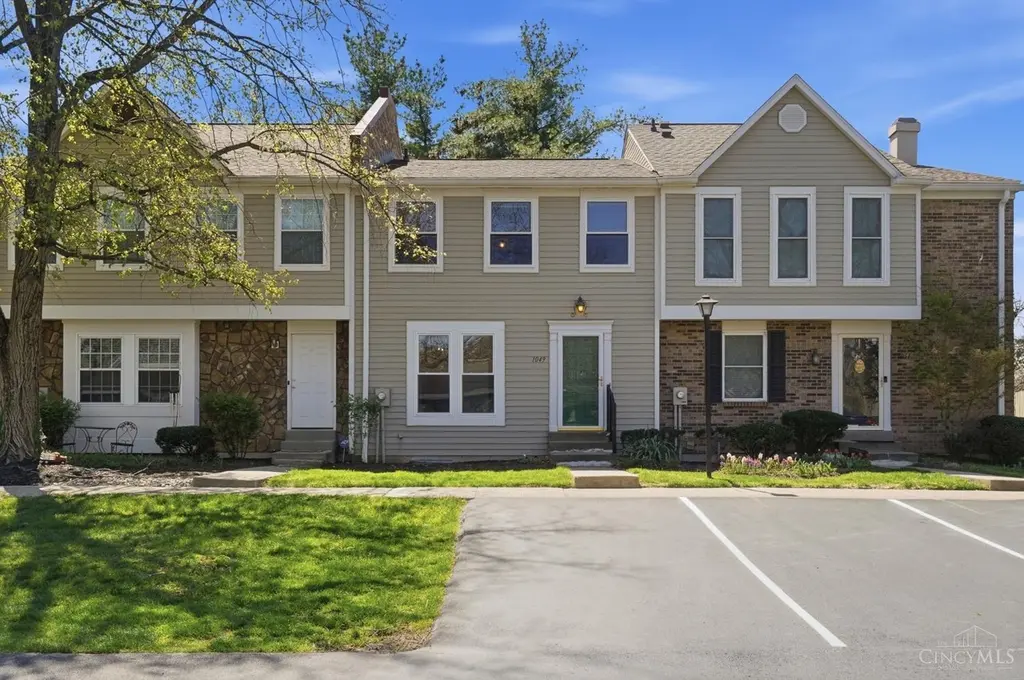
1049 Stratford Ct · Loveland, OH
Flood risk 1/10 · Minimal
- FEMA flood zone
- X (unshaded)
- Chance of flooding over 30 yrs
- 0.0%
- Est. flood insurance / yr
- $473 – $860
Fire risk 1/10 · Minimal
- Est. fire insurance / yr
- $713 – $1,323
Heat risk 4/10 · Minor
- Hot days now (above 102°F)
- 7 days/yr
- Hot days in 30 yrs
- 19 days/yr
Wind risk 2/10 · Minimal
- Chance of severe wind over 30 yrs
- 1.0%
Air-quality risk 4/10 · Minor
- Unhealthy air days now
- 5 days/yr
- Unhealthy air days in 30 yrs
- 7 days/yr
Risk factors via First Street. Map © Google.
Why this score? — see what drove the D+ grade
The composite is a weighted blend of 9 inputs, each scored 0–100. Each bar is that input's sub-score; the figure is the points it added to the 100-point composite (weight × sub-score).
- ARV discount +14.6/15.0
- Cash flow +8.9/30.0
- Schools +6.9/10.0
- 1% rule +5.9/10.0
- Livability +4.2/5.0
- Rent growth +3.6/5.0
- DSCR +2.5/10.0
- Condition / age +2.2/5.0
- Appreciation +0.0/10.0
$184,900
🖨 Deal sheet 📄 Offer letter ✓ Due diligence
Listing remarks MLS
Wonderful Opportunity to buy WELL BELOW the Market.Gain instant equity with new paint and carpet! Great 2-bedroom townhome in Hidden Creek Community just waiting for your touches! Large Family Room! Charming Dining Room! Equipped Kitchen as Stove & Refrigerator Stay! 2 Large Bedrooms w/ Full Bath! Finished Lower Level w/ Rec Rm, Full Bath & Laundry Room! Deck, Patio & Privacy Fence! Gilkey Windows! HOA includes water, sewer, trash, mature-tree lined setting, access to the pool and walking trails! Condo within walking distance to the Loveland Bike Trail! Great Location.
Key facts
- Privacy fence
- Gilkey windows
- Access to the pool
Tags
Neighborhood map
What this means for you Summary
Snapshot
- This is a 2-bed/2.5-bath townhouse listed at $185k. Condition is rated fair.
Deal economics
- At list price, monthly cash flow is $-148 ($-2k/yr) — negative.
- To cash-flow at today's rent, offer at most $164k (11.6% below list).
- Meets the 1% rule at list price ($2k rent vs $185k).
- Recommended offer: $164k (11.6% below list) — sets the bar for cash-flow.
- Cap rate 5.3% vs local median 3.1% in Loveland — top-decile yield for the area; either an underpriced asset or a hidden risk that comps aren't pricing in. Stress-test before assuming the spread holds.
Location & tenants
- Location reads 84/100 on livability (#49 in OH, #696 nationally) — a professional / high-income tenant draw. Strengths: schools A+, crime A+, amenities A+; Watch: commute F.
- Loveland City (suburban): math 76% / reading 78% proficiency, ranked #50 of 656 in OH (top 8%) — strong family-tenant draw, lease renewals of 3-5y typical; only 12% free/reduced lunch — higher-income household profile.
- Market conditions: Rents rising fast (+4.4%/yr); 161 active listings in the ZIP; 14 comparable units currently listed for rent nearby; rentals leasing fast (median 2d on market — plan ~1-2 weeks tenant-placement turnaround); high-income renter base; 801 units permitted in Hamilton County in 2024 (190 in 5+ unit buildings).
Forward outlook
- Local home prices are declining (-3.0%/yr); year-one equity from $1k of loan paydown is wiped out by about $6k of value loss. Plan a longer hold.
Negotiation context
- It's been on market 85 days — a 6% lower offer ($174k) is reasonable based on typical stale-listing flexibility.
Risks & watch-outs
- Watch-outs: HOA is 23% of rent.
Questions for the listing agent
- What do current leases actually rent for vs. the listed asking? Can we see a recent rent roll and the last 12 months of T-12 income?
- It's been on market 85 days. Have you received any prior offers? Is the seller open to a 12% concession, seller financing, or rate buy-down credit?
- Have any recent inspections been done? Can we get a copy of the seller's disclosures and any deferred-maintenance estimates?
- What does the HOA fee cover, when was the last increase, and are there any pending special assessments or reserve-fund shortfalls?
- Why hasn't it sold? Are there any deal-killer items the seller is aware of (foundation, flood, title, zoning, code violations)?
- Is there a deadline driving the sale (1031 exchange, divorce, estate, relocation)? That informs how much negotiation room exists.
- Schools are A-rated — typically a magnet for longer-tenancy family renters. What's the average tenant stay here, and is there a school-zone premium baked into asking?
- The area grade is low — what's the realistic commute time and amenity access for the typical tenant pool here? Any planned neighborhood developments (good or bad) we should know about?
- What's the average days-on-market for RENTAL listings here right now (not sales)? A rising rental-DOM trend means longer vacancies and softer asking-rent achievability than the comps imply.
- What's the recent tenant-quality profile in this submarket — average credit score on applications, eviction rate, late-payment / NSF rate, and stable-employment percentage? A property-management company in the area should have these aggregated.
- How much new for-sale + rental construction is in the pipeline within 1–3 miles? Heavy new supply typically softens prices + rents 12–24 months out; constrained supply supports both.
Investment metrics
- 1% rule
- 1.09% ✓
- Cap rate
- 5.33%
- Cash-on-cash
- -3.42%
- DSCR
- 0.85
- GRM
- 7.7
CMA / ARV
- ARV (median comp)
- $219,392
- List price
- $184,900
- Delta
- -15.72%
- Verdict
- UNDERPRICED
- Comps
- 20 within 1.0 mi
Show comp detail 12 sales within ~0.75 mi
| Address | Dist | Beds/Ba | Sqft | Sold | Price | $/sf | Match |
|---|---|---|---|---|---|---|---|
| 4044 White Chapel Ln | 0.15mi | 2/2.0 | 1,315 (+5%) | 2mo | $206,000 | $157 | 82 |
| 3016 Stratford Ct | 0.16mi | 2/2.5 | 1,200 (-4%) | 9mo | $189,000 | $158 | 78 |
| 3029 Stratford Ct #164 | 0.14mi | 3/2.0 (+1) | 1,315 (+5%) | 2mo | $193,000 | $147 | 76 |
| 5022 Bristol Ct | 0.16mi | 2/2.5 | 1,334 (+6%) | 7mo | $210,000 | $157 | 76 |
| 1059 Stratford Ct #35 | 0.03mi | 2/1.5 | 1,174 (-6%) | 13mo | $235,000 | $200 | 73 |
| 4019 White Chapel Ln #141 | 0.12mi | 2/2.0 | 1,065 (-15%) | 0mo | $167,500 | $157 | 67 |
| 3023 Stratford Ct #157 | 0.14mi | 3/2.0 (+1) | 1,315 (+5%) | 14mo | $237,500 | $181 | 66 |
| 4015 White Chapel Ln #139 | 0.12mi | 2/2.0 | 1,065 (-15%) | 8mo | $205,000 | $192 | 61 |
| 220 Carrington Pl #104 | 0.71mi | 2/2.0 | 1,112 (-11%) | 0mo | $188,000 | $169 | 46 |
| 220 Carrington Pl #312 | 0.71mi | 2/2.0 | 1,112 (-11%) | 2mo | $196,000 | $176 | 44 |
| 220 Carrington Ln #311 | 0.71mi | 2/2.0 | 1,112 (-11%) | 2mo | $201,000 | $181 | 44 |
| 210 Carrington Ln #207 | 0.71mi | 2/2.0 | 1,112 (-11%) | 5mo | $200,000 | $180 | 42 |
Match score weights: distance 35% · size 25% · config 20% · recency 20%. Top-matched comps best support the ARV.
Projected returns pro-forma
-3.0% appreciation · 4.36% rent growth · sell at horizon
- IRR
- -19.7%
- Equity multiple
- 0.30×
- Total profit
- $-36,267
- Equity at exit
- $27,569
- IRR
- -8.8%
- Equity multiple
- 0.41×
- Total profit
- $-30,662
- Equity at exit
- $15,987
Cash invested: $51,772 (down + closing). Projections, not guarantees.
Landlord ↔ Tenant lean methodology
- Overall (STATE)
- 73 Landlord-Friendly
- State Ohio
- 73 Landlord-Friendly · R+6
- County
- — inherits STATE
- City
- — inherits STATE
ZIP-level market 45140
- Rents YoY
- 4.4%
- Active inventory
- 161
- Price-to-rent
- 7.7×
Monthly cashflow live
- Estimated rent
- $2,010 high interval (Pro) →
- Mortgage (P&I)
- −$970
- Tax est. 1.5%
- −$231 /mo · $2,774/yr
- Insurance
- −$77
- HOA
- −$458
- Vacancy / Maint / Mgmt
- −$422
- Net cashflow
- $-148
Break-even live
UW: 25.0% down · 7.5% · 30yr · 1.5% tax · 5.0% vac · 8.0% maint · 8.0% mgmt
Financing live
Cash to close
- Down payment
- $46,225
- Closing costs
- $5,547
- Reserves months
- —
- Total cash needed
- —
Loan-product check · same deal, 3 products live
Conventional
25% down · 7.5% · 30yr
- Down + closing
- —
- Monthly P&I
- —
- Monthly cashflow
- —
- DSCR
- —
- Eligible?
- —
Personal DTI + credit; lowest rate.
DSCR
20% down · 8.5% · 30yr
- Down + closing
- —
- Monthly P&I
- —
- Monthly cashflow
- —
- DSCR
- —
- Eligible?
- —
No personal income docs; deal must DSCR.
Hard money
10% down · 12.0% · 12mo
- Down + closing
- —
- Monthly P&I
- —
- Monthly cashflow
- —
- DSCR
- —
- Eligible?
- —
Short-term bridge; refi at stabilization.
Rent comps 14 comps
| Address | Beds | Baths | Sqft | Rent | $/sqft | DOM | Units | Dist |
|---|---|---|---|---|---|---|---|---|
| 2071 Stratford Ct Loveland, OH | 3.0 | 1.5 | 1120 | $1,895 | $1.69 | 44d | 1 | 0.09mi |
| 3029 Stratford Ct Loveland, OH | 3.0 | 2.0 | 1315 | $2,250 | $1.71 | 17d | 1 | 0.14mi |
| 3021 Stratford Ct Unit 1 Loveland, OH | 3.0 | 2.0 | 1550 | $2,125 | $1.37 | 23d | 1 | 0.15mi |
| 3030 Stratford Ct Loveland, OH | 2.0 | 2.5 | 1500 | $2,100 | $1.40 | 14d | 1 | 0.16mi |
| 8713 Harper Point Dr Cincinnati, OH | 1.0–3.0 | 1.0–2.5 | 1050 | $1,948 | $1.85 | 1d | 19 | 0.61mi |
| 120 Carrington Ln Apt 208 Loveland, OH | 2.0 | 2.0 | 1200 | $2,095 | $1.75 | 1d | 1 | 0.82mi |
| 9169 Dominion Cir Cincinnati, OH | 2.0 | 2.5 | 1486 | $2,100 | $1.41 | 23d | 1 | 0.92mi |
| 9124 Dominion Cir Cincinnati, OH | 3.0 | 2.5 | 1646 | $2,250 | $1.37 | 44d | 1 | 0.94mi |
| 9110 Dominion Cir Cincinnati, OH | 2.0 | 2.5 | 1646 | $2,100 | $1.28 | 1d | 1 | 0.96mi |
| 11513 Village Brook Dr Cincinnati, OH | 1.0–3.0 | 1.0–2.0 | 1088 | $2,297 | $2.11 | 1d | 34 | 0.96mi |
| 9630 Waterford Pl Loveland, OH | 1.0–2.0 | 1.0–2.0 | 1084 | $2,105 | $1.94 | 1d | 30 | 1.20mi |
| 8650 Governors Hill Dr Cincinnati, OH | 2.0 | 1.0–2.0 | 948 | $2,492 | $2.63 | 1d | 23 | 1.24mi |
| 8770 Wales Dr Cincinnati, OH | 1.0–2.0 | 2.5 | 1100 | $1,695 | $1.54 | 1d | 10 | 1.40mi |
| 12131 Sycamore Terrace Dr Cincinnati, OH | 1.0–3.0 | 1.0–2.0 | 1000 | $1,532 | $1.53 | 1d | 10 | 1.44mi |
HOA detail
- Monthly dues
- $458 · $5,496/yr
- Likely covers
- watersewertrashpool
Listing history 16 events
-
2026-06-18days on market $184,900 Active 85 DOM
-
2026-06-17days on market $184,900 Active 84 DOM
-
2026-06-16days on market $184,900 Active 83 DOM
-
2026-06-15days on market $184,900 Active 82 DOM
-
2026-06-13days on market $184,900 Active 80 DOM
-
2026-06-13days on market $184,900 Active 79 DOM
-
2026-06-09days on market $184,900 Active 76 DOM
-
2026-06-08days on market $184,900 Active 75 DOM
-
2026-06-07days on market $184,900 Active 74 DOM
-
2026-06-05days on market $184,900 Active 71 DOM
-
2026-06-03days on market $184,900 Active 70 DOM
-
2026-06-02days on market $184,900 Active 69 DOM
-
2026-06-01days on market $184,900 Active 68 DOM
-
2026-05-31days on market $184,900 Active 67 DOM
-
2026-04-29price $184,900 587-char remark
Show marketing remark (587 chars)
Wonderful Opportunity to buy WELL BELOW the Market.Gain instant equity with new paint and carpet! Great 2-bedroom townhome in Hidden Creek Community just waiting for your touches! Large Family Room! Charming Dining Room! Equipped Kitchen as Stove & Refrigerator Stay! 2 Large Bedrooms w/ Full Bath! Finished Lower Level w/ Rec Rm, Full Bath & Laundry Room! Deck, Patio & Privacy Fence! Gilkey Windows! HOA includes water, sewer, trash, mature-tree lined setting, access to the pool and walking trails! Condo within walking distance to the Loveland Bike Trail! Great Location.
-
2026-03-25$189,900 Active 587-char remark
Show marketing remark (587 chars)
Wonderful Opportunity to buy WELL BELOW the Market.Gain instant equity with new paint and carpet! Great 2-bedroom townhome in Hidden Creek Community just waiting for your touches! Large Family Room! Charming Dining Room! Equipped Kitchen as Stove & Refrigerator Stay! 2 Large Bedrooms w/ Full Bath! Finished Lower Level w/ Rec Rm, Full Bath & Laundry Room! Deck, Patio & Privacy Fence! Gilkey Windows! HOA includes water, sewer, trash, mature-tree lined setting, access to the pool and walking trails! Condo within walking distance to the Loveland Bike Trail! Great Location.
ⓘ Source: listings_history table (triggers on properties + properties_extension) + one-shot
backfill from property_details.listing_events for pre-trigger history.
Climate risk First Street
- Flood 1/10 Low FEMA zone X (unshaded) · 0% chance over 30 yrs
- Wildfire 1/10 Low
- Heat 4/10 Moderate 7 d/yr ≥102°F today · 19 d/yr by 30 yrs out
- Wind 2/10 Low 100% chance of damaging wind over 30 yrs
- Air quality 4/10 Moderate 5 unhealthy d/yr today · 7 by 30 yrs out
Nearby sold comps map
Loading sold comps map…
Walkable amenities ~0.75 mi
Loading nearby amenities…
Taxation est. · year 1
- Rental income
- $24,124
- − Mortgage interest
- −$10,357
- − Property taxes
- −$2,774
- − Insurance
- −$924
- − Repairs & maintenance
- −$1,930
- − Management
- −$1,930
- − HOA
- −$5,496
- − Depreciation
- −$5,379
- Taxable loss
- −$4,666
- Est. tax savings @ 24.0%
- +$1,120
- After-tax cash flow
- $-652/yr
For passive investors: Depreciation is non-cash, so a rental often shows a tax loss while cash-flowing — sheltering income. Rental losses are passive: they offset passive income freely, and up to $25,000/yr can offset ordinary (W-2) income if you actively participate and your MAGI is under $100k (phasing out to $0 by $150k); unused losses carry forward. On sale, claimed depreciation is recaptured at up to 25%, and gains may owe capital-gains tax (a 1031 exchange can defer both). Figures are a year-1 estimate at your 24.0% rate — not tax advice; consult a CPA.
Condition & rehab AI · 12 photos
This townhouse requires moderate renovations, including painting, flooring, and kitchen/bathroom updates, to significantly increase its resale and rental value.
Repairs flagged
- Major Paint — Peeling wallpaper and worn carpet indicate significant paint issues.
- Major Flooring — Worn carpet and outdated wallpaper suggest the need for new flooring and paint.
- Moderate Kitchen — Outdated cabinets and countertops indicate the need for a kitchen renovation.
- Moderate Bathrooms — Outdated fixtures and finishes suggest the need for bathroom renovations.
- Minor Landscaping — Basic landscaping could be improved to enhance curb appeal.
Value-add opportunities
- Both Paint and wallpaper removal — Updating the interior with fresh paint and removing outdated wallpaper will improve both resale and rental value.
- Both New flooring — Replacing worn carpet with modern flooring will enhance both resale and rental value.
- Both Kitchen renovation — Updating the kitchen with new cabinets, countertops, and appliances will significantly increase both resale and rental value.
- Both Bathroom renovations — Upgrading bathroom fixtures and finishes will improve both resale and rental value.
- Both Landscaping improvements — Enhancing the landscaping will improve curb appeal and potentially increase both resale and rental value.
Renovation cost estimate screening
| Repair item | Severity | Est. cost |
|---|---|---|
| Paint · Peeling wallpaper and worn carpet indicate significant paint issues. | Major | $15,000–50,000 |
| Flooring · Worn carpet and outdated wallpaper suggest the need for new flooring and paint. | Major | $15,000–50,000 |
| Kitchen · Outdated cabinets and countertops indicate the need for a kitchen renovation. | Moderate | $3,000–15,000 |
| Bathrooms · Outdated fixtures and finishes suggest the need for bathroom renovations. | Moderate | $3,000–15,000 |
| Landscaping · Basic landscaping could be improved to enhance curb appeal. | Minor | $500–3,000 |
| Total estimated repair cost · 5 items | $36,500–133,000 |
Value-add ROI direction
- Both Paint and wallpaper removal — Updating the interior with fresh paint and removing outdated wallpaper will improve both resale and rental value. ↑
- Both New flooring — Replacing worn carpet with modern flooring will enhance both resale and rental value. ↑
- Both Kitchen renovation — Updating the kitchen with new cabinets, countertops, and appliances will significantly increase both resale and rental value. ↑
- Both Bathroom renovations — Upgrading bathroom fixtures and finishes will improve both resale and rental value. ↑
- Both Landscaping improvements — Enhancing the landscaping will improve curb appeal and potentially increase both resale and rental value. ↑
ⓘ Cost ranges are severity-bucket heuristics (US national rule-of-thumb). Get contractor quotes + a written scope before underwriting a rehab budget.
Schools (NCES district)
- District
- Loveland City
- NCES district ID
- 3904427
- Math proficiency
- 76% ▼ -8.00%
- Reading proficiency
- 78% ▼ -5.00%
- Median HH income
- $93,598
- Composite
- 69.34/100
- National rank
- #314
- State rank
- #50 of 656 in OH
Livability — Loveland
- Score
- 84/100
- State rank
- #49
- US rank
- #696
Category grades
Schools grade is shown separately in the Schools card above.
Census & demographics
- Census place
- Loveland, OH
- County
- Clermont County · 173,169 people
- City population
- 57,211
- Metro
- Cincinnati, OH-KY-IN
- Population (ZIP)
- 57,211
- Household income
- $114,827
- Rent vs Own
- Severe rent burden
- 928.0
Population outlook (Hamilton County) Hauer SSP2
- Today (2025)
- 826,054 people
- By 2030
- 830,947 · +0.6%
- By 2040
- 832,319 · +0.8%
- By 2050
- 822,428 · -0.4%
- By 2075
- 788,688 · -4.5%
- By 2100
- 710,674 · -14.0%
Race, ethnicity, and origin ACS 2023
- Neighborhood character
- Predominantly White (87%)
- Race & ethnicity
- White 87% Two or more races 5% Hispanic / Latino 4% Asian 4% Black 2%
- Common ancestry
- Slovak 3% Romanian 3% Italian 3%
- Foreign-born
- 6% · Canada, South Korea
- Languages at home
- 92% English-only · Other Asian/Pacific 2% Spanish 2% Russian/Polish/Slavic 1%
Political lean MEDSL · Hamilton
- 2024 margin
- D (+14.9) · D 57.0% · R 42.1%
- 2008→2024 swing
- +7.9pp toward D · 2008: 7.0pp · 2024: 14.9pp
- All cycles
- 2024: D+14.9 2020: D+15.9 2016: D+9.5 2012: D+4.9 2008: D+7.0
Not yet ingested
- Civics
- —
Market trends
- HPI YoY
- ▼ -240.61%
- Current HPI
- 243.9481
- Rent YoY
- ▲ 4.36%
- Metro
- Cincinnati, OH-KY-IN
- State GDP YoY
- ▲ 1.98%
- F500 in state
- 48
Industry mix (Fortune 500 HQ in OH)
| Industry | F500 HQs | Revenue |
|---|---|---|
| Insurance | 3 | $145B |
|
||
| Industrial Machinery | 3 | $49B |
|
||
| Financial Services | 3 | $24B |
|
||
| Consumer Goods | 2 | $93B |
|
||
| Aerospace / Defense | 2 | $47B |
|
||
| Utilities | 2 | $33B |
|
||
Price history
-2.6% since first listed2 events — show timeline
- 2026-04-29 Price Changed $184,900 Cincy MLS
- 2026-03-25 Listed $189,900 Cincy MLS
Cash-flow waterfall
monthlySold comps — $/sqft
last 12 mo · ≤1 miLoading sold comps…