155 Shoups Branch Rd · Liberty, PA
Flood risk 1/10 · Minimal
- FEMA flood zone
- X (unshaded)
- Chance of flooding over 30 yrs
- 0.0%
- Est. flood insurance / yr
- $507 – $1,088
Fire risk 3/10 · Minor
- Est. fire insurance / yr
- $511 – $949
Heat risk 4/10 · Minor
- Hot days now (above 94°F)
- 8 days/yr
- Hot days in 30 yrs
- 18 days/yr
Wind risk 2/10 · Minimal
- Chance of severe wind over 30 yrs
- 0.0%
Air-quality risk 2/10 · Minimal
- Unhealthy air days now
- 1 days/yr
- Unhealthy air days in 30 yrs
- 2 days/yr
Risk factors via First Street. Map © Google.
Why this score? — see what drove the B grade
The composite is a weighted blend of 9 inputs, each scored 0–100. Each bar is that input's sub-score; the figure is the points it added to the 100-point composite (weight × sub-score).
- Cash flow +27.1/30.0
- DSCR +9.4/10.0
- ARV discount +7.5/15.0
- 1% rule +7.3/10.0
- Appreciation +6.4/10.0
- Condition / age +4.0/5.0
- Livability +3.6/5.0
- Schools +3.0/10.0
- Rent growth +2.5/5.0
$79,900
🖨 Deal sheet (PDF) 📄 Offer letter ✓ Due diligence
Listing remarks
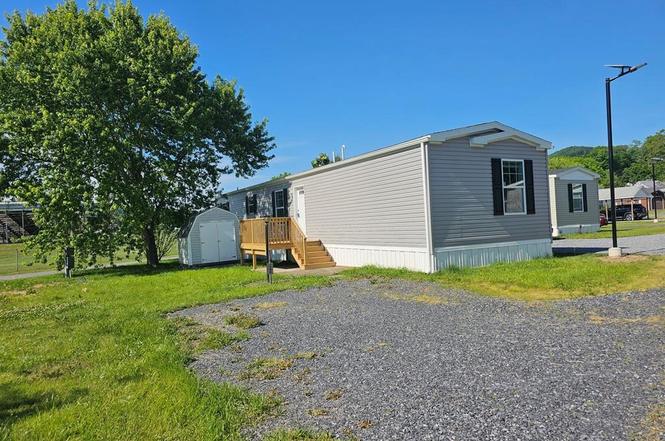
This brand-new 3-bedroom, 2-bathroom manufactured home by Champion Home Builders offers approximately 1,001 sq. ft. of turnkey living space at an attractive price point. The home features upgraded vinyl flooring throughout, stainless steel kitchen appliances, and a spacious primary suite with a walk-in shower. Additional highlights include an energy-efficient propane furnace, a 7 & acirc; & euro; & trade; x 10 & acirc; & euro; & trade; front deck, an included 8 & acirc; & euro; & trade; x 8 & acirc; & euro; & trade; vinyl-sided shed, and two dedicated off-street parking spaces. Seamless gutters and central air conditioning will be installed so
Key facts
- Off street parking
- Primary suite
- Walk-in shower
Tags
Neighborhood map
What this means for you Summary
Snapshot
- This is a 3-bed/2.0-bath manufactured listed at $80k. Condition is rated good.
Deal economics
- At list price, monthly cash flow is $227 ($3k/yr) — positive.
- The deal already cash-flows at list — no discount required.
- Meets the 1% rule at list price ($986 rent vs $80k).
- Cap rate 9.7% vs local median 5.8% in Liberty — top-decile yield for the area; either an underpriced asset or a hidden risk that comps aren't pricing in. Stress-test before assuming the spread holds.
Location & tenants
- Location reads 72/100 on livability (#659 in PA) — a middle-class / working-renter tenant base. Strengths: crime A+, cost of living A+, housing A+; Watch: employment C-, health & safety D, amenities F.
- Tussey Mountain SD (rural): math 26% / reading 46% proficiency, ranked #412 of 539 in PA (top 76%) — families likely to look elsewhere, expect single-tenant / working-renter base with shorter leases.
- Zoned schools: Tussey Mountain El (math 37% / reading 37%, grade F, #1,004 of 1,518 statewide, top 68%, 374 students, 100% FRL); Tussey Mountain Ms (math 15% / reading 50%, grade F, #355 of 512 statewide, top 70%, 270 students, 100% FRL); Tussey Mountain Hs (math 64%, 291 students, 90% FRL) — zoned schools average 97% FRL vs 51% district-wide (46 pts higher); higher-poverty schools than district average — tighter screening recommended.
- Market conditions: 22 active listings in the ZIP; 54 units permitted in Bedford County in 2024 (0 in 5+ unit buildings).
Forward outlook
- In year one you build about $3k of equity ($552 loan paydown + $2k appreciation (2.7% local appreciation)).
- Bedford County population projected at -25% by 2050 — secular population decline; favor cash flow + early exit over multi-decade hold.
- At projected returns (2.7% appreciation + 3.0% rent growth), your $22k cash investment doubles in ~4 years — after that, you're playing with house money.
Negotiation context
- Only 13 days on market — expect competitive offers; lowballing is unlikely to land.
Questions for the listing agent
- Is there a deadline driving the sale (1031 exchange, divorce, estate, relocation)? That informs how much negotiation room exists.
- Schools are B-rated — typically a magnet for longer-tenancy family renters. What's the average tenant stay here, and is there a school-zone premium baked into asking?
- What's the average days-on-market for RENTAL listings here right now (not sales)? A rising rental-DOM trend means longer vacancies and softer asking-rent achievability than the comps imply.
- What's the recent tenant-quality profile in this submarket — average credit score on applications, eviction rate, late-payment / NSF rate, and stable-employment percentage? A property-management company in the area should have these aggregated.
- How much new for-sale + rental construction is in the pipeline within 1–3 miles? Heavy new supply typically softens prices + rents 12–24 months out; constrained supply supports both.
Investment metrics
- 1% rule
- 1.23% ✓
- Cap rate
- 9.70%
- Cash-on-cash
- 12.15%
- DSCR
- 1.54
- GRM
- 6.8
CMA / ARV
No comps found within radius.
Projected returns pro-forma
2.71% appreciation · 3.0% rent growth · sell at horizon
- IRR
- 18.2%
- Equity multiple
- 2.02×
- Total profit
- $22,871
- Equity at exit
- $34,651
- IRR
- 19.8%
- Equity multiple
- 3.80×
- Total profit
- $62,736
- Equity at exit
- $52,430
Cash invested: $22,372 (down + closing). Projections, not guarantees.
Landlord ↔ Tenant lean methodology
- Overall (STATE)
- 62 Landlord-Friendly
- State Pennsylvania
- 62 Landlord-Friendly · EVEN
- County
- — inherits STATE
- City
- — inherits STATE
ZIP-level market 16678
- Home prices YoY
- 1.8%
- Active inventory
- 22
- Price-to-rent
- 6.8×
Monthly cashflow live
- Estimated rent
- $986 medium interval (Pro) →
- Mortgage (P&I)
- −$419
- Tax est. 1.5%
- −$100 /mo · $1,198/yr
- Insurance
- −$33
- HOA
- −$0
- Vacancy / Maint / Mgmt
- −$207
- Net cashflow
- $227
Break-even live
Sensitivity live
| Price | -10% $282 | -5% $254 | +0% $227 | +5% $199 | +10% $171 |
|---|---|---|---|---|---|
| Rent | -10% $149 | -5% $188 | +0% $227 | +5% $266 | +10% $304 |
| Rate | -1.0pp $267 | -0.5pp $247 | base $227 | +0.5pp $206 | +1.0pp $185 |
UW: 25.0% down · 7.5% · 30yr · 1.5% tax · 5.0% vac · 8.0% maint · 8.0% mgmt
Financing live
Cash to close
- Down payment
- $19,975
- Closing costs
- $2,397
- Reserves months
- —
- Total cash needed
- —
Loan-product check · same deal, 3 products live
Conventional
25% down · 7.5% · 30yr
- Down + closing
- —
- Monthly P&I
- —
- Monthly cashflow
- —
- DSCR
- —
- Eligible?
- —
Personal DTI + credit; lowest rate.
DSCR
20% down · 8.5% · 30yr
- Down + closing
- —
- Monthly P&I
- —
- Monthly cashflow
- —
- DSCR
- —
- Eligible?
- —
No personal income docs; deal must DSCR.
Hard money
10% down · 12.0% · 12mo
- Down + closing
- —
- Monthly P&I
- —
- Monthly cashflow
- —
- DSCR
- —
- Eligible?
- —
Short-term bridge; refi at stabilization.
Listing history 17 events
-
2026-06-21days on market $79,900 Active 13 DOM
-
2026-06-21days on market $79,900 Active 12 DOM
-
2026-06-18days on market $79,900 Active 10 DOM
-
2026-06-17days on market $79,900 Active 9 DOM
-
2026-06-16days on market $79,900 Active 8 DOM
-
2026-06-15days on market $79,900 Active 7 DOM
-
2026-06-13days on market $79,900 Active 5 DOM
-
2026-06-12days on market $79,900 Active 4 DOM
-
2026-06-09days on market $79,900 Active 1 DOM
-
2026-06-08days on market $79,900 Active 13 DOM
-
2026-06-08days on market $79,900 Active 12 DOM
-
2026-06-07days on market $79,900 Active 11 DOM
-
2026-06-04days on market $79,900 Active 8 DOM
-
2026-06-02days on market $79,900 Active 7 DOM
-
2026-06-01days on market $79,900 Active 6 DOM
-
2026-05-31days on market $79,900 Active 5 DOM
-
2026-05-26$79,900 Active
ⓘ Source: listings_history table (triggers on properties + properties_extension) + one-shot
backfill from property_details.listing_events for pre-trigger history.
Climate risk First Street
- Flood 1/10 Low FEMA zone X (unshaded) · 0% chance over 30 yrs
- Wildfire 3/10 Moderate
- Heat 4/10 Moderate 8 d/yr ≥94°F today · 18 d/yr by 30 yrs out
- Wind 2/10 Low 0% chance of damaging wind over 30 yrs
- Air quality 2/10 Low 1 unhealthy d/yr today · 2 by 30 yrs out
Nearby sold comps map
Loading sold comps map…
Walkable amenities ~0.75 mi
Loading nearby amenities…
Taxation est. · year 1
- Rental income
- $11,829
- − Mortgage interest
- −$4,476
- − Property taxes
- −$1,198
- − Insurance
- −$400
- − Repairs & maintenance
- −$946
- − Management
- −$946
- − Depreciation
- −$2,324
- Taxable income
- $1,538
- Est. tax owed @ 24.0%
- −$369
- After-tax cash flow
- $2,350/yr
For passive investors: Depreciation is non-cash, so a rental often shows a tax loss while cash-flowing — sheltering income. Rental losses are passive: they offset passive income freely, and up to $25,000/yr can offset ordinary (W-2) income if you actively participate and your MAGI is under $100k (phasing out to $0 by $150k); unused losses carry forward. On sale, claimed depreciation is recaptured at up to 25%, and gains may owe capital-gains tax (a 1031 exchange can defer both). Figures are a year-1 estimate at your 24.0% rate — not tax advice; consult a CPA.
Condition & rehab AI · 1 photo
This brand-new 3-bedroom, 2-bathroom manufactured home is in excellent condition with no visible repairs or maintenance needed. It offers a turnkey living space with upgraded features and is ready for immediate occupancy.
Value-add opportunities
- Both Painting the exterior and interior — Fresh paint can enhance the home's curb appeal and interior aesthetics, making it more attractive to potential buyers and renters.
- Both Landscaping improvements — Well-maintained landscaping can significantly increase the home's curb appeal and property value.
- Both Upgrading the kitchen appliances — Upgrading to modern, energy-efficient appliances can improve the home's functionality and appeal to potential buyers and renters.
- Both Upgrading the HVAC system — A more efficient HVAC system can improve comfort and energy efficiency, making the home more attractive to potential buyers and renters.
- Both Upgrading the windows — Upgrading to energy-efficient windows can improve energy efficiency and reduce utility costs, making the home more attractive to potential buyers and renters.
Renovation cost estimate screening
Value-add ROI direction
- Both Painting the exterior and interior — Fresh paint can enhance the home's curb appeal and interior aesthetics, making it more attractive to potential buyers and renters. ↑
- Both Landscaping improvements — Well-maintained landscaping can significantly increase the home's curb appeal and property value. ↑
- Both Upgrading the kitchen appliances — Upgrading to modern, energy-efficient appliances can improve the home's functionality and appeal to potential buyers and renters. ↑
- Both Upgrading the HVAC system — A more efficient HVAC system can improve comfort and energy efficiency, making the home more attractive to potential buyers and renters. ↑
- Both Upgrading the windows — Upgrading to energy-efficient windows can improve energy efficiency and reduce utility costs, making the home more attractive to potential buyers and renters. ↑
ⓘ Cost ranges are severity-bucket heuristics (US national rule-of-thumb). Get contractor quotes + a written scope before underwriting a rehab budget.
Schools (NCES district)
- District
- Tussey Mountain SD
- NCES district ID
- 4223970
- Math proficiency
- 26% ▼ -8.00%
- Reading proficiency
- 46% ▼ -10.00%
- Median HH income
- $40,095
- Composite
- 30.15/100
- National rank
- #6329
- State rank
- #412 of 539 in PA
Livability — Liberty
- Score
- 72/100
- State rank
- #659
- US rank
- #6444
Category grades
Schools grade is shown separately in the Schools card above.
Census & demographics
- City population
- 6,139
- Population (ZIP)
- 2,461
Population outlook (Bedford County) Hauer SSP2
- Today (2025)
- 45,395 people
- By 2030
- 43,353 · -4.5%
- By 2040
- 38,858 · -14.4%
- By 2050
- 34,162 · -24.7%
- By 2075
- 24,868 · -45.2%
- By 2100
- 16,910 · -62.7%
Race, ethnicity, and origin ACS 2023
- Neighborhood character
- Predominantly White (94%)
- Race & ethnicity
- White 94% Two or more races 4% Hispanic / Latino 1%
- Common ancestry
- Romanian 2% Polish 2% Slovak 2%
- Foreign-born
- 1% · Canada
Political lean MEDSL · Bedford
- 2024 margin
- Solid R (+68.6) · D 15.4% · R 84.0%
- 2008→2024 swing
- -23.8pp toward R · 2008: -44.8pp · 2024: -68.6pp
- All cycles
- 2024: R+68.6 2020: R+67.7 2016: R+67.4 2012: R+54.9 2008: R+44.8
Not yet ingested
- Civics
- —
Market trends
- HPI YoY
- ▲ 2.71%
- Current HPI
- 150.9539
- Rent YoY
- —
- Metro
- —
- State GDP YoY
- ▲ 1.68%
- F500 in state
- 34
Industry mix (Fortune 500 HQ in PA)
| Industry | F500 HQs | Revenue |
|---|---|---|
| Healthcare | 2 | $309B |
|
||
| Insurance | 2 | $27B |
|
||
| Telecommunications / Media | 1 | $124B |
|
||
| Industrial Distribution | 1 | $22B |
|
||
| Financial Services | 1 | $20B |
|
||
| Chemicals / Materials | 1 | $18B |
|
||
Price history
1 event — show timeline
- 2026-05-26 Listed $79,900 FSBO.com
Cash-flow waterfall
monthlySold comps — $/sqft
last 12 mo · ≤1 miLoading sold comps…