None · Squaw Valley, CA
Flood risk 9/10 · Severe
- FEMA flood zone
- X (unshaded)
- Chance of flooding over 30 yrs
- 0.99%
- Est. flood insurance / yr
- $507 – $1,088
Fire risk 10/10 · Severe
- Est. fire insurance / yr
- $659 – $1,223
Heat risk 7/10 · Major
- Hot days now (above 102°F)
- 8 days/yr
- Hot days in 30 yrs
- 20 days/yr
Wind risk 1/10 · Minimal
- Chance of severe wind over 30 yrs
- —
Air-quality risk 10/10 · Severe
- Unhealthy air days now
- 56 days/yr
- Unhealthy air days in 30 yrs
- 60 days/yr
Risk factors via First Street. Map © Google.
Why this score? — see what drove the B- grade
The composite is a weighted blend of 9 inputs, each scored 0–100. Each bar is that input's sub-score; the figure is the points it added to the 100-point composite (weight × sub-score).
- Cash flow +30.0/30.0
- 1% rule +10.0/10.0
- DSCR +10.0/10.0
- ARV discount +7.5/15.0
- Livability +3.0/5.0
- Schools +2.9/10.0
- Rent growth +2.5/5.0
- Condition / age +2.5/5.0
- Appreciation +1.2/10.0
$140,000
🖨 Deal sheet 📄 Offer letter ✓ Due diligence
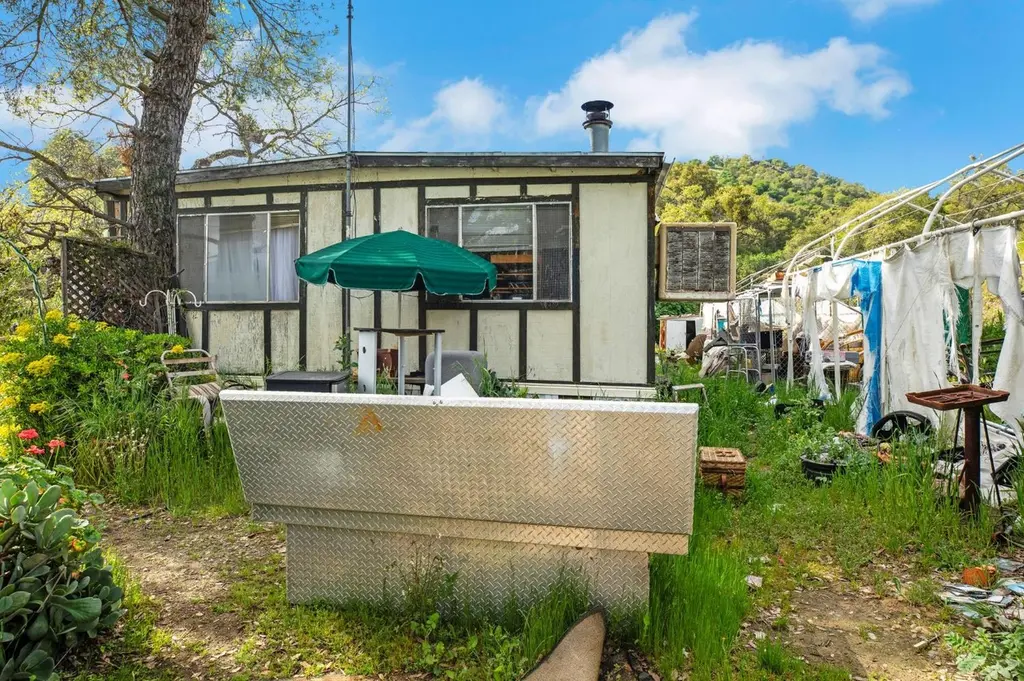
Listing remarks
Double-wide mobile home on a large rural lot. Other simple structures on the lot. Probate, short sale. Buyer to verify all details.
Key facts
- 7.71 acre lot
- 10 parking spots
- Built 1976
Neighborhood map
What this means for you Summary
Snapshot
- This is a 3-bed/2.0-bath manufactured listed at $140k.
Deal economics
- At list price, monthly cash flow is $809 ($10k/yr) — positive.
- The deal already cash-flows at list — no discount required.
- Meets the 1% rule at list price ($2k rent vs $140k).
- Recommended offer: $127k (9.0% below list) — sets the bar for market timing.
- Cap rate 13.8% vs local median 3.7% in Squaw Valley — top-decile yield for the area; either an underpriced asset or a hidden risk that comps aren't pricing in. Stress-test before assuming the spread holds.
Location & tenants
- Location reads 60/100 on livability (#583 in CA) — a middle-class / working-renter tenant base. Strengths: housing A+, employment A-; Watch: schools F, amenities F, commute F.
- Kings Canyon Joint Unified (town): math 26% / reading 43% proficiency, ranked #288 of 517 in CA (top 56%) — families likely to look elsewhere, expect single-tenant / working-renter base with shorter leases; 73% free/reduced lunch — lower-income household profile, screen leases tightly.
- Market conditions: 75 active listings in the ZIP; 2,426 units permitted in Fresno County in 2024 (296 in 5+ unit buildings).
Forward outlook
- Local home prices are declining (-3.0%/yr); year-one equity from $968 of loan paydown is wiped out by about $4k of value loss. Plan a longer hold.
- Fresno County population projected at +11% by 2050 — modest demand growth; plan on rents tracking national, not racing it.
- At projected returns (-3.0% appreciation + 3.0% rent growth), your $39k cash investment doubles in ~5 years — after that, you're playing with house money.
Negotiation context
- It's been on market 99 days — a 9% lower offer ($127k) is reasonable based on typical stale-listing flexibility.
- Current owner paid $24k; list at $140k implies a 496% gain — meaningful room to come down on a strong offer.
Risks & watch-outs
- Watch-outs: flood insurance adds $66/mo.
- Climate carrying-cost: severe flood risk; severe wildfire risk; extreme-heat days projected 8→20/yr by 2055 (HVAC capex compounding) — expect insurance premiums to compound above CPI over the hold.
Questions for the listing agent
- It's been on market 99 days. Have you received any prior offers? Is the seller open to a 9% concession, seller financing, or rate buy-down credit?
- Built in 1976 — when were the roof, HVAC, electrical panel, plumbing, and water heater last replaced?
- What's the actual annual flood-insurance premium (NFIP or private), and is the property in a SFHA with mandatory coverage?
- Why hasn't it sold? Are there any deal-killer items the seller is aware of (foundation, flood, title, zoning, code violations)?
- Is there a deadline driving the sale (1031 exchange, divorce, estate, relocation)? That informs how much negotiation room exists.
- Schools are F-rated, which usually means shorter tenancies and higher turnover. Who's the typical renter profile here, and what's been the actual vacancy rate?
- What's the average days-on-market for RENTAL listings here right now (not sales)? A rising rental-DOM trend means longer vacancies and softer asking-rent achievability than the comps imply.
- What's the recent tenant-quality profile in this submarket — average credit score on applications, eviction rate, late-payment / NSF rate, and stable-employment percentage? A property-management company in the area should have these aggregated.
- How much new for-sale + rental construction is in the pipeline within 1–3 miles? Heavy new supply typically softens prices + rents 12–24 months out; constrained supply supports both.
Investment metrics
- 1% rule
- 1.57% ✓
- Cap rate
- 13.80%
- Cash-on-cash
- 26.79%
- DSCR
- 2.19
- GRM
- 5.3
CMA / ARV
No comps found within radius.
Projected returns pro-forma
-3.0% appreciation · 3.0% rent growth · sell at horizon
- IRR
- 18.2%
- Equity multiple
- 1.74×
- Total profit
- $28,837
- Equity at exit
- $20,874
- IRR
- 26.6%
- Equity multiple
- 3.33×
- Total profit
- $91,482
- Equity at exit
- $12,105
Cash invested: $39,200 (down + closing). Projections, not guarantees.
Landlord ↔ Tenant lean methodology
- Overall (STATE)
- 18 Strongly Tenant-Friendly
- State California
- 18 Strongly Tenant-Friendly · D+13
- County
- — inherits STATE
- City
- — inherits STATE
ZIP-level market 93675
- Home prices YoY
- -2.1%
- Active inventory
- 75
- Price-to-rent
- 5.3×
Monthly cashflow live
- Estimated rent
- $2,200 medium interval (Pro) →
- Mortgage (P&I)
- −$734
- Tax from tax record
- −$70 /mo · $844/yr
- Insurance
- −$58
- Flood insurance flood zone
- −$66 /mo · $798/yr
- HOA
- −$0
- Vacancy / Maint / Mgmt
- −$462
- Net cashflow
- $809
Break-even live
UW: 25.0% down · 7.5% · 30yr · 1.5% tax · 5.0% vac · 8.0% maint · 8.0% mgmt
Financing live
Cash to close
- Down payment
- $35,000
- Closing costs
- $4,200
- Reserves months
- —
- Total cash needed
- —
Loan-product check · same deal, 3 products live
Conventional
25% down · 7.5% · 30yr
- Down + closing
- —
- Monthly P&I
- —
- Monthly cashflow
- —
- DSCR
- —
- Eligible?
- —
Personal DTI + credit; lowest rate.
DSCR
20% down · 8.5% · 30yr
- Down + closing
- —
- Monthly P&I
- —
- Monthly cashflow
- —
- DSCR
- —
- Eligible?
- —
No personal income docs; deal must DSCR.
Hard money
10% down · 12.0% · 12mo
- Down + closing
- —
- Monthly P&I
- —
- Monthly cashflow
- —
- DSCR
- —
- Eligible?
- —
Short-term bridge; refi at stabilization.
Listing history 15 events
-
2026-06-18days on market $140,000 Active 99 DOM
-
2026-06-17days on market $140,000 Active 98 DOM
-
2026-06-16days on market $140,000 Active 97 DOM
-
2026-06-15days on market $140,000 Active 96 DOM
-
2026-06-13days on market $140,000 Active 94 DOM
-
2026-06-13days on market $140,000 Active 93 DOM
-
2026-06-10days on market $140,000 Active 91 DOM
-
2026-06-09days on market $140,000 Active 90 DOM
-
2026-06-08days on market $140,000 Active 89 DOM
-
2026-06-07days on market $140,000 Active 88 DOM
-
2026-06-03days on market $140,000 Active 84 DOM
-
2026-06-02days on market $140,000 Active 83 DOM
-
2026-06-01days on market $140,000 Active 82 DOM
-
2026-05-31days on market $140,000 Active 81 DOM
-
1982-03-18soldstatus $23,500
ⓘ Source: listings_history table (triggers on properties + properties_extension) + one-shot
backfill from property_details.listing_events for pre-trigger history.
Tax reassessment forecast CA · Resets to sale price
- Current annual tax
- $844 · $70/mo
- Projected year-2 tax
- $1,064 · $89/mo
- Expected delta
- +$220/yr (+$18/mo · 26.1%)
ⓘ Screening estimate from a state-policy table — verify with the county assessor before closing.
Climate risk First Street
- Flood 9/10 Extreme FEMA zone X (unshaded) · 99% chance over 30 yrs
- Wildfire 10/10 Extreme
- Heat 7/10 Severe 8 d/yr ≥102°F today · 20 d/yr by 30 yrs out
- Wind 1/10 Low
- Air quality 10/10 Extreme 56 unhealthy d/yr today · 60 by 30 yrs out
Nearby sold comps map
Loading sold comps map…
Walkable amenities ~0.75 mi
Loading nearby amenities…
Taxation est. · year 1
- Rental income
- $26,401
- − Mortgage interest
- −$7,842
- − Property taxes
- −$844
- − Insurance
- −$1,498
- − Repairs & maintenance
- −$2,112
- − Management
- −$2,112
- − Depreciation
- −$4,073
- Taxable income
- $7,921
- Est. tax owed @ 24.0%
- −$1,901
- After-tax cash flow
- $7,805/yr
For passive investors: Depreciation is non-cash, so a rental often shows a tax loss while cash-flowing — sheltering income. Rental losses are passive: they offset passive income freely, and up to $25,000/yr can offset ordinary (W-2) income if you actively participate and your MAGI is under $100k (phasing out to $0 by $150k); unused losses carry forward. On sale, claimed depreciation is recaptured at up to 25%, and gains may owe capital-gains tax (a 1031 exchange can defer both). Figures are a year-1 estimate at your 24.0% rate — not tax advice; consult a CPA.
Schools (NCES district)
- District
- Kings Canyon Joint Unified
- NCES district ID
- 0619700
- Math proficiency
- 26% ▼ -14.00%
- Reading proficiency
- 43% ▼ -9.00%
- Median HH income
- $42,406
- Composite
- 29.14/100
- National rank
- #6582
- State rank
- #288 of 517 in CA
Livability — Squaw Valley
- Score
- 60/100
- State rank
- #583
- US rank
- #18982
Category grades
Schools grade is shown separately in the Schools card above.
Census & demographics
- Census place
- Squaw Valley, CA
- City population
- 3,739
- Population (ZIP)
- 3,739
Population outlook (Fresno County) Hauer SSP2
- Today (2025)
- 1,042,971 people
- By 2030
- 1,072,198 · +2.8%
- By 2040
- 1,122,408 · +7.6%
- By 2050
- 1,157,251 · +11.0%
- By 2075
- 1,182,575 · +13.4%
- By 2100
- 1,105,899 · +6.0%
Race, ethnicity, and origin ACS 2023
- Neighborhood character
- Diverse neighborhood (Simpson 0.63)
- Race & ethnicity
- White 45% Hispanic / Latino 39% Asian 11% Two or more races 10%
- Hispanic origin (detail)
- Mexican 38%
- Common ancestry
- Serbian 1% Slovak 1%
- Foreign-born
- 22% · Canada, China
- Languages at home
- 61% English-only · Spanish 30% Other Asian/Pacific 5% Chinese 2%
Political lean MEDSL · Fresno
- 2024 margin
- Toss-up / Even · D 46.5% · R 50.9% · Other 2.6%
- 2008→2024 swing
- -6.5pp toward R · 2008: 2.1pp · 2024: -4.4pp
- All cycles
- 2024: R+4.4 2020: D+7.8 2016: D+3.9 2012: R+2.9 2008: D+2.1
Not yet ingested
- Civics
- —
Market trends
- HPI YoY
- ▼ -7.56%
- Current HPI
- 343.5472
- Rent YoY
- —
- Metro
- —
- State GDP YoY
- ▲ 3.21%
- F500 in state
- 116
Industry mix (Fortune 500 HQ in CA)
| Industry | F500 HQs | Revenue |
|---|---|---|
| Technology | 27 | $1,492B |
|
||
| Financial Services | 3 | $174B |
|
||
| Retail | 3 | $44B |
|
||
| Insurance | 3 | $26B |
|
||
| Media / Entertainment | 2 | $115B |
|
||
| Pharmaceuticals / Biotech | 2 | $62B |
|
||
Price history
1 event — show timeline
- 1982-03-18 Sold (Public Records) $23,500 Public Records
Property tax history
+2.6%/yrLatest (2025): $844 · +1.9% YoY. Source: county tax records.
Cash-flow waterfall
monthlySold comps — $/sqft
last 12 mo · ≤1 miLoading sold comps…