4918 Ellsworth Dr · Fayetteville, NC
Flood risk 1/10 · Minimal
- FEMA flood zone
- X (unshaded)
- Chance of flooding over 30 yrs
- 0.0%
- Est. flood insurance / yr
- $507 – $1,088
Fire risk 3/10 · Minor
- Est. fire insurance / yr
- $906 – $1,684
Heat risk 7/10 · Major
- Hot days now (above 106°F)
- 7 days/yr
- Hot days in 30 yrs
- 16 days/yr
Wind risk 7/10 · Major
- Chance of severe wind over 30 yrs
- 78.0%
Air-quality risk 1/10 · Minimal
- Unhealthy air days now
- 0 days/yr
- Unhealthy air days in 30 yrs
- 0 days/yr
Risk factors via First Street. Map © Google.
Why this score? — see what drove the D grade
The composite is a weighted blend of 9 inputs, each scored 0–100. Each bar is that input's sub-score; the figure is the points it added to the 100-point composite (weight × sub-score).
- Cash flow +12.8/30.0
- ARV discount +8.0/15.0
- DSCR +3.8/10.0
- Livability +3.8/5.0
- 1% rule +3.3/10.0
- Rent growth +3.3/5.0
- Schools +3.1/10.0
- Condition / age +2.5/5.0
- Appreciation +0.0/10.0
$165,000
🖨 Deal sheet (PDF) 📄 Offer letter ✓ Due diligence
Listing remarks
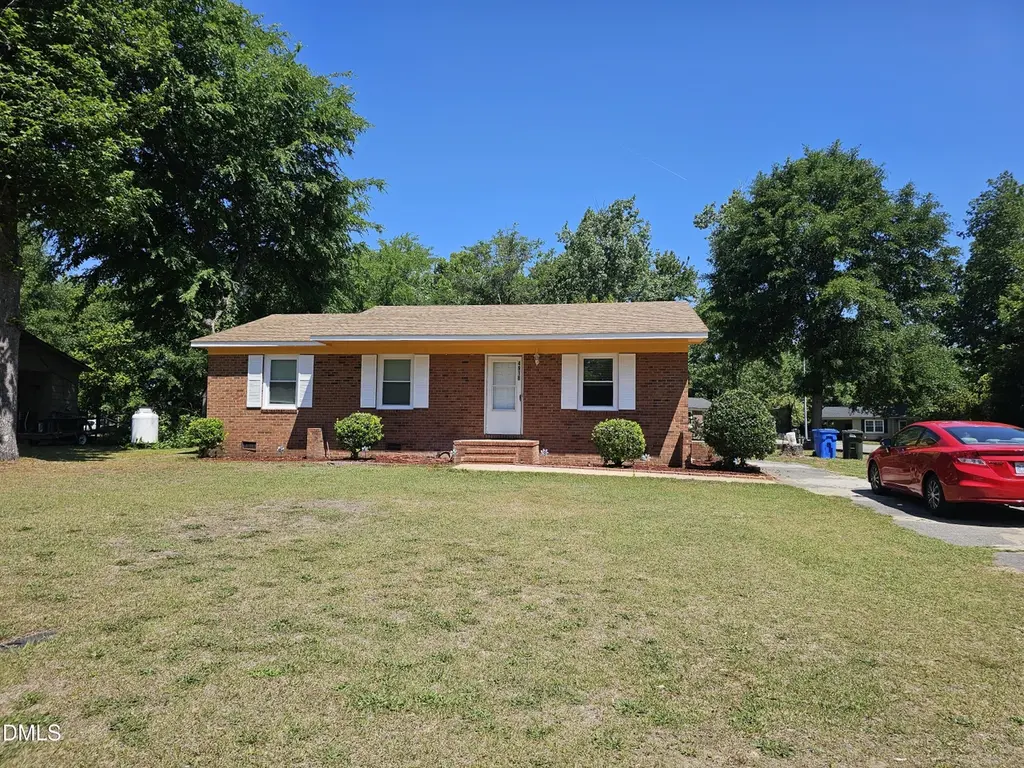
Fantastic & inviting 3 BR & 2 bath all BRICK ranch in the highly sought after Douglas Byrd school district!! Home features hardwood floors, GRANITE counters, newly built bonus room, and spacious back yard . . . come see!!
Key facts
- 0.3 acre lot
- Built 1971
- Listed 31 days
Property features AI
Finance
- HOA & community: No homeowners association
Exterior
- Utilities: Public water; Public sewer
- Home design: Single-story, site-built house
- Construction: Brick, brick veneer, masonite and wood siding construction
- Exterior features: Shingle roof; Lot approximately 0.3 acres; Publicly maintained road access; Zoned SF10
Interior
- Bedrooms: Three bedrooms (all on the main level)
- Flooring: Hardwood; Laminate; Tile; Vinyl
- Bathrooms: Two full bathrooms
- Heating & cooling: Forced air heating; Heat pump; Central air conditioning
- Interior features: Hardwood, laminate, tile and vinyl flooring
Neighborhood map
What this means for you Summary
Snapshot
- This is a 3-bed/2.0-bath single-family listed at $165k.
Deal economics
- At list price, monthly cash flow is $-16 ($-197/yr) — negative.
- To cash-flow at today's rent, offer at most $162k (1.8% below list).
- To meet the 1% rule (rent ≥ 1% of price), the offer needs to be $137k (17.1% below list).
- Recommended offer: $137k (17.1% below list) — sets the bar for 1% rule.
- Cap rate 6.2% vs local median 4.8% in Fayetteville — meaningfully above typical; check what's discounted (condition, days-on-market, listing class) to confirm the premium yield is real.
Location & tenants
- Location reads 75/100 on livability (#45 in NC, #4,031 nationally) — a middle-class / working-renter tenant base. Strengths: commute A+, cost of living A+, housing A+; Watch: crime F, employment D-.
- Cumberland County Schools (urban): math 32% / reading 41% proficiency, ranked #126 of 178 in NC (top 71%) — families likely to look elsewhere, expect single-tenant / working-renter base with shorter leases.
- Zoned schools: J W Coon Elementary (math 32% / reading 32%, grade F, #908 of 1,410 statewide, top 67%, 199 students, 98% FRL); Douglas Byrd Middle (math 13% / reading 30%, grade F, #422 of 475 statewide, top 89%, 935 students, 100% FRL); Douglas Byrd High (math 22% / reading 42%, grade F, #445 of 535 statewide, top 84%, 940 students, 99% FRL) — zoned schools average 99% FRL vs 55% district-wide (44 pts higher); higher-poverty schools than district average — tighter screening recommended.
- Market conditions: Rents rising (+3.2%/yr); 308 active listings in the ZIP; 37 comparable units currently listed for rent nearby; rentals at typical pace (median 26d on market — plan ~3-4 weeks tenant-placement turnaround); 1,125 units permitted in Cumberland County in 2024 (104 in 5+ unit buildings).
Forward outlook
- Local home prices are declining (-3.0%/yr); year-one equity from $1k of loan paydown is wiped out by about $5k of value loss. Plan a longer hold.
Negotiation context
- It's been on market 31 days — a 3% lower offer ($160k) is reasonable based on typical stale-listing flexibility.
- Current owner paid $85k; list at $165k implies a 94% gain — meaningful room to come down on a strong offer.
Risks & watch-outs
- Climate carrying-cost: major wind risk, 78% chance of damaging wind over 30y; extreme-heat days projected 7→16/yr by 2055 (HVAC capex compounding) — expect insurance premiums to compound above CPI over the hold.
Questions for the listing agent
- What do current leases actually rent for vs. the listed asking? Can we see a recent rent roll and the last 12 months of T-12 income?
- It's been on market 31 days. Have you received any prior offers? Is the seller open to a 17% concession, seller financing, or rate buy-down credit?
- Built in 1971 — when were the roof, HVAC, electrical panel, plumbing, and water heater last replaced?
- Is there a deadline driving the sale (1031 exchange, divorce, estate, relocation)? That informs how much negotiation room exists.
- Crime grade is F in this area — have there been break-ins, vandalism, or insurance claims at this property in the last 3 years? What carrier currently insures it and at what premium?
- The area grade is low — what's the realistic commute time and amenity access for the typical tenant pool here? Any planned neighborhood developments (good or bad) we should know about?
- What's the average days-on-market for RENTAL listings here right now (not sales)? A rising rental-DOM trend means longer vacancies and softer asking-rent achievability than the comps imply.
- What's the recent tenant-quality profile in this submarket — average credit score on applications, eviction rate, late-payment / NSF rate, and stable-employment percentage? A property-management company in the area should have these aggregated.
- How much new for-sale + rental construction is in the pipeline within 1–3 miles? Heavy new supply typically softens prices + rents 12–24 months out; constrained supply supports both.
Investment metrics
- 1% rule
- 0.83% ✗
- Cap rate
- 6.17%
- Cash-on-cash
- -0.43%
- DSCR
- 0.98
- GRM
- 10.1
CMA / ARV
- ARV (on-the-fly)
- $166,848
- Comps found
- 12
Show comp detail 12 sales within ~0.75 mi
| Address | Dist | Beds/Ba | Sqft | Sold | Price | $/sf | Match |
|---|---|---|---|---|---|---|---|
| 1011 Juniper Dr | 0.20mi | 3/2.0 | 1,011 (-4%) | 2mo | $184,999 | $183 | 82 |
| 1334 Devonshire Dr | 0.32mi | 3/1.5 | 1,067 (+1%) | 0mo | $112,000 | $105 | 81 |
| 1005 Juniper Dr | 0.21mi | 3/1.0 | 1,107 (+5%) | 1mo | $169,000 | $153 | 78 |
| 1805 Inverness Dr | 0.47mi | 3/1.5 | 1,033 (-2%) | 3mo | $164,000 | $159 | 70 |
| 1104 Odom Dr | 0.26mi | 3/1.0 | 1,143 (+8%) | 2mo | $170,000 | $149 | 68 |
| 4709 Pamlico Rd | 0.64mi | 3/2.0 | 1,089 (+3%) | 2mo | $216,000 | $198 | 63 |
| 4909 Walnut Dr | 0.45mi | 3/1.0 | 1,136 (+8%) | 1mo | $180,000 | $158 | 61 |
| 5219 Redwood Dr | 0.51mi | 3/1.0 | 1,124 (+6%) | 2mo | $187,000 | $166 | 60 |
| 1707 Camelot Dr | 0.63mi | 3/2.0 | 1,116 (+6%) | 2mo | $204,000 | $183 | 60 |
| 819 Sandalwood Dr | 0.40mi | 3/1.0 | 1,156 (+10%) | 2mo | $176,000 | $152 | 60 |
| 821 Sandalwood Dr | 0.40mi | 3/1.0 | 1,204 (+14%) | 1mo | $140,000 | $116 | 53 |
| 5200 Spruce Dr | 0.68mi | 3/1.0 | 1,136 (+8%) | 3mo | $155,000 | $136 | 49 |
Match score weights: distance 35% · size 25% · config 20% · recency 20%. Top-matched comps best support the ARV.
Projected returns pro-forma
-3.0% appreciation · 3.17% rent growth · sell at horizon
- IRR
- -16.8%
- Equity multiple
- 0.40×
- Total profit
- $-27,554
- Equity at exit
- $24,602
- IRR
- -8.4%
- Equity multiple
- 0.47×
- Total profit
- $-24,400
- Equity at exit
- $14,266
Cash invested: $46,200 (down + closing). Projections, not guarantees.
Landlord ↔ Tenant lean methodology
- Overall (STATE)
- 85 Strongly Landlord-Friendly
- State North Carolina
- 85 Strongly Landlord-Friendly · R+3
- County
- — inherits STATE
- City
- — inherits STATE
ZIP-level market 28304
- Home prices YoY
- -21.7%
- Rents YoY
- 3.2%
- Active inventory
- 308
- Price-to-rent
- 10.1×
Monthly cashflow live
- Estimated rent
- $1,368 high interval (Pro) →
- Mortgage (P&I)
- −$865
- Tax from tax record
- −$163 /mo · $1,953/yr
- Insurance
- −$69
- HOA
- −$0
- Vacancy / Maint / Mgmt
- −$287
- Net cashflow
- $-16
Break-even live
Sensitivity live
| Price | -10% $77 | -5% $30 | +0% $-16 | +5% $-63 | +10% $-110 |
|---|---|---|---|---|---|
| Rent | -10% $-124 | -5% $-70 | +0% $-16 | +5% $38 | +10% $92 |
| Rate | -1.0pp $67 | -0.5pp $26 | base $-16 | +0.5pp $-59 | +1.0pp $-103 |
UW: 25.0% down · 7.5% · 30yr · 1.5% tax · 5.0% vac · 8.0% maint · 8.0% mgmt
Financing live
Cash to close
- Down payment
- $41,250
- Closing costs
- $4,950
- Reserves months
- —
- Total cash needed
- —
Loan-product check · same deal, 3 products live
Conventional
25% down · 7.5% · 30yr
- Down + closing
- —
- Monthly P&I
- —
- Monthly cashflow
- —
- DSCR
- —
- Eligible?
- —
Personal DTI + credit; lowest rate.
DSCR
20% down · 8.5% · 30yr
- Down + closing
- —
- Monthly P&I
- —
- Monthly cashflow
- —
- DSCR
- —
- Eligible?
- —
No personal income docs; deal must DSCR.
Hard money
10% down · 12.0% · 12mo
- Down + closing
- —
- Monthly P&I
- —
- Monthly cashflow
- —
- DSCR
- —
- Eligible?
- —
Short-term bridge; refi at stabilization.
Rent comps 37 comps
| Address | Beds | Baths | Sqft | Rent | $/sqft | DOM | Units | Dist |
|---|---|---|---|---|---|---|---|---|
| 821 Sandalwood Dr Fayetteville, NC | 3.0 | 1.0 | 1204 | $1,200 | $1.00 | 15d | 1 | 0.39mi |
| 909 Sandalwood Dr Fayetteville, NC | 3.0 | 1.0 | 1346 | $1,595 | $1.18 | 25d | 1 | 0.40mi |
| 4935 Walnut Dr Fayetteville, NC | 3.0 | 1.5 | 1024 | $1,200 | $1.17 | 15d | 1 | 0.47mi |
| 4909 Walnut Dr Fayetteville, NC | 3.0 | 2.0 | 1188 | $1,500 | $1.26 | 25d | 1 | 0.48mi |
| 5632 Birch Rd Fayetteville, NC | 3.0 | 1.0 | 1228 | $1,250 | $1.02 | 25d | 1 | 0.58mi |
| 5200 Cypress Rd Fayetteville, NC | 3.0 | 1.0 | 1210 | $1,250 | $1.03 | 25d | 1 | 0.63mi |
| 4101 Coventry Rd Fayetteville, NC | 3.0 | 1.0 | 1132 | $1,150 | $1.02 | 15d | 1 | 0.69mi |
| 4810 Alamance Rd Fayetteville, NC | 1.0–2.0 | 1.0–2.0 | 827 | $1,200 | $1.45 | 25d | 1 | 0.76mi |
| 910 Miller Ave Unit 910 Fayetteville, NC | 2.0 | 2.0 | 1000 | $1,250 | $1.25 | 25d | 1 | 0.86mi |
| 1401 Carnsmore Dr Fayetteville, NC | 3.0 | 2.5 | 1450 | $1,575 | $1.09 | 25d | 1 | 0.90mi |
| 4630 Canterbury Rd Fayetteville, NC | 3.0 | 2.0 | 1250 | $1,350 | $1.08 | 25d | 1 | 0.93mi |
| 1313 Ireland Dr Unit B Fayetteville, NC | 2.0 | 1.5 | 900 | $1,000 | $1.11 | 25d | 1 | 0.98mi |
| 5842 Aftonshire Dr Fayetteville, NC | 2.0 | 1.5 | 1010 | $1,000 | $0.99 | 25d | 1 | 0.98mi |
| 1309 Ireland Dr Fayetteville, NC | 2.0 | 1.5 | 900 | $1,000 | $1.11 | 15d | 1 | 0.99mi |
| 5864 Aftonshire Dr Fayetteville, NC | 2.0 | 2.0 | 1100 | $1,100 | $1.00 | 25d | 1 | 1.03mi |
| 1413 Tangora Ln Fayetteville, NC | 2.0 | 1.5 | 945 | $979 | $1.04 | 15d | 1 | 1.03mi |
| 5876 Aftonshire Dr Fayetteville, NC | 2.0 | 1.5 | 1024 | $1,015 | $0.99 | 25d | 1 | 1.04mi |
| 5744 Aftonshire Dr Fayetteville, NC | 2.0 | 1.5 | 945 | $999 | $1.06 | 25d | 1 | 1.06mi |
| 1406 Tangora Ln Fayetteville, NC | 2.0 | 2.5 | 1192 | $1,015 | $0.85 | 25d | 1 | 1.06mi |
| 5713 Aftonshire Dr Fayetteville, NC | 2.0 | 2.5 | 1025 | $995 | $0.97 | 15d | 1 | 1.08mi |
| 1216 Weeping Willow Way Unit 229 Fayetteville, NC | 3.0 | 2.0 | 960 | $969 | $1.01 | 15d | 1 | 1.11mi |
| 5721 Randleman St Fayetteville, NC | 3.0 | 2.0 | 1050 | $1,575 | $1.50 | 25d | 1 | 1.12mi |
| 1805 Wayne Ln Fayetteville, NC | 3.0 | 1.0 | 975 | $2,400 | $2.46 | 25d | 1 | 1.14mi |
| 5744 Randleman St Fayetteville, NC | 3.0 | 2.0 | 1171 | $1,395 | $1.19 | 25d | 1 | 1.17mi |
| 3526 Furman Dr Fayetteville, NC | 3.0 | 1.5 | 1050 | $1,500 | $1.43 | 25d | 1 | 1.19mi |
| 5032 Shimmer Dr Fayetteville, NC | 4.0 | 2.0 | 1473 | $1,700 | $1.15 | 15d | 1 | 1.19mi |
| 5032 Shimmer Dr Fayetteville, NC | 4.0 | 2.0 | 1473 | $1,750 | $1.19 | 25d | 1 | 1.19mi |
| 5151 Queensdale Dr Fayetteville, NC | 3.0 | 2.0 | 1107 | $1,295 | $1.17 | 25d | 1 | 1.19mi |
| 5151 Queensdale Dr Fayetteville, NC | 3.0 | 2.0 | 1107 | $1,295 | $1.17 | 15d | 1 | 1.19mi |
| 400 Roxie Ave Fayetteville, NC | 2.0 | 2.0 | 1162 | $1,700 | $1.46 | 15d | 1 | 1.24mi |
| 4809 Belford Rd Fayetteville, NC | 3.0 | 1.5 | 1459 | $1,300 | $0.89 | 25d | 1 | 1.30mi |
| 1715 Arrow Ridge Way Fayetteville, NC | 3.0 | 2.0 | 1220 | $1,550 | $1.27 | 15d | 1 | 1.38mi |
| 613 Ashbrook Ct Fayetteville, NC | 3.0 | 1.5 | 1103 | $1,299 | $1.18 | 25d | 1 | 1.46mi |
| 600 Ashbrook Ct Fayetteville, NC | 2.0–3.0 | 1.5 | 1050 | $1,299 | $1.24 | 23d | 6 | 1.48mi |
| 855 King Arthur Dr Fayetteville, NC | 1.0–2.0 | 1.0–2.0 | 810 | $1,182 | $1.46 | 15d | 9 | 1.50mi |
| 609 Ashbrook Ct Fayetteville, NC | 2.0 | 1.5 | 997 | $1,049 | $1.05 | 25d | 1 | 1.50mi |
| 4615 Cumberland Rd Fayetteville, NC | 2.0 | 1.0 | 783 | $825 | $1.05 | 25d | 1 | 1.50mi |
Listing history 9 events
-
2026-06-07statusdays on market $165,000 Pending 31 DOM
-
2026-06-03days on market $165,000 Active 29 DOM
-
2026-06-02days on market $165,000 Active 28 DOM
-
2026-06-01days on market $165,000 Active 27 DOM
-
2026-05-31days on market $165,000 Active 26 DOM
-
2026-05-30days on market $165,000 Active 25 DOM
-
2026-05-05$165,000 Active
-
2022-03-23soldstatus $85,000
-
2021-03-11soldstatus $50,000
ⓘ Source: listings_history table (triggers on properties + properties_extension) + one-shot
backfill from property_details.listing_events for pre-trigger history.
Tax reassessment forecast NC · Resets to sale price
- Current annual tax
- $1,953 · $163/mo
- Projected year-2 tax
- $1,953 · $163/mo
- Expected delta
- $0/yr ($0/mo · 0.0%)
ⓘ Screening estimate from a state-policy table — verify with the county assessor before closing.
Climate risk First Street
- Flood 1/10 Low FEMA zone X (unshaded) · 0% chance over 30 yrs
- Wildfire 3/10 Moderate
- Heat 7/10 Severe 7 d/yr ≥106°F today · 16 d/yr by 30 yrs out
- Wind 7/10 Severe 78% chance of damaging wind over 30 yrs
- Air quality 1/10 Low 0 unhealthy d/yr today · 0 by 30 yrs out
Nearby sold comps map
Loading sold comps map…
Walkable amenities ~0.75 mi
Loading nearby amenities…
Taxation est. · year 1
- Rental income
- $16,411
- − Mortgage interest
- −$9,243
- − Property taxes
- −$1,953
- − Insurance
- −$825
- − Repairs & maintenance
- −$1,313
- − Management
- −$1,313
- − Depreciation
- −$4,800
- Taxable loss
- −$3,036
- Est. tax savings @ 24.0%
- +$729
- After-tax cash flow
- $532/yr
For passive investors: Depreciation is non-cash, so a rental often shows a tax loss while cash-flowing — sheltering income. Rental losses are passive: they offset passive income freely, and up to $25,000/yr can offset ordinary (W-2) income if you actively participate and your MAGI is under $100k (phasing out to $0 by $150k); unused losses carry forward. On sale, claimed depreciation is recaptured at up to 25%, and gains may owe capital-gains tax (a 1031 exchange can defer both). Figures are a year-1 estimate at your 24.0% rate — not tax advice; consult a CPA.
Schools (NCES district)
- District
- Cumberland County Schools
- NCES district ID
- 3700011
- Math proficiency
- 32% ▼ -2.00%
- Reading proficiency
- 41% ▼ -1.00%
- Median HH income
- $44,168
- Composite
- 31.0/100
- National rank
- #6096
- State rank
- #126 of 178 in NC
Livability — Fayetteville
- Score
- 75/100
- State rank
- #45
- US rank
- #4031
Category grades
Schools grade is shown separately in the Schools card above.
Census & demographics
- Census place
- Fayetteville, NC
- County
- Cumberland County · 265,314 people
- City population
- 226,118
- Metro
- Fayetteville, NC
- Population (ZIP)
- 37,140
- Household income
- $58,563
- Rent vs Own
- Severe rent burden
- 1667.0
Population outlook (Cumberland County) Hauer SSP2
- Today (2025)
- 330,855 people
- By 2030
- 333,523 · +0.8%
- By 2040
- 335,583 · +1.4%
- By 2050
- 335,325 · +1.4%
- By 2075
- 342,853 · +3.6%
- By 2100
- 340,698 · +3.0%
Race, ethnicity, and origin ACS 2023
- Neighborhood character
- Highly diverse neighborhood (Simpson 0.70)
- Race & ethnicity
- Black 39% White 36% Hispanic / Latino 14% Two or more races 12% Asian 3% Native American 1%
- Hispanic origin (detail)
- Mexican 5% Puerto Rican 5%
- Common ancestry
- Slovak 2% Italian 1% Serbian 1%
- Foreign-born
- 8% · Canada, South Korea, Vietnam
- Languages at home
- 87% English-only · Spanish 9% Tagalog/Filipino 1% French/Haitian/Cajun 1%
Political lean MEDSL · Cumberland
- 2024 margin
- D (+13.4) · D 56.1% · R 42.7% · Other 1.2%
- 2008→2024 swing
- -4.3pp toward R · 2008: 17.7pp · 2024: 13.4pp
- All cycles
- 2024: D+13.4 2020: D+16.6 2016: D+16.0 2012: D+19.7 2008: D+17.7
Not yet ingested
- Civics
- —
Market trends
- HPI YoY
- ▼ -59.90%
- Current HPI
- 215.927
- Rent YoY
- ▲ 3.17%
- Metro
- Fayetteville, NC
- State GDP YoY
- ▲ 3.28%
- F500 in state
- 26
Industry mix (Fortune 500 HQ in NC)
| Industry | F500 HQs | Revenue |
|---|---|---|
| Financial Services | 2 | $213B |
|
||
| Retail | 2 | $95B |
|
||
| Industrial Conglomerate | 1 | $38B |
|
||
| Metals / Steel | 1 | $35B |
|
||
| Utilities | 1 | $30B |
|
||
| Industrial Machinery | 1 | $19B |
|
||
Price history
+230.0% since first listed3 events — show timeline
- 2026-05-05 Listed $165,000 TMLS
- 2022-03-23 Sold (Public Records) $85,000 Public Records
- 2021-03-11 Sold (Public Records) $50,000 Public Records
Property tax history
+6.3%/yrLatest (2025): $1,953 · +39.8% YoY. Source: county tax records.
Cash-flow waterfall
monthlySold comps — $/sqft
last 12 mo · ≤1 miLoading sold comps…