4815 Plum Creek Rd · Taylorsville, KY
Flood risk 8/10 · Major
- FEMA flood zone
- X (unshaded)
- Chance of flooding over 30 yrs
- 0.99%
- Est. flood insurance / yr
- $473 – $860
Fire risk 4/10 · Minor
- Est. fire insurance / yr
- $839 – $1,559
Heat risk 4/10 · Minor
- Hot days now (above 104°F)
- 7 days/yr
- Hot days in 30 yrs
- 19 days/yr
Wind risk 2/10 · Minimal
- Chance of severe wind over 30 yrs
- 2.0%
Air-quality risk 2/10 · Minimal
- Unhealthy air days now
- 1 days/yr
- Unhealthy air days in 30 yrs
- 2 days/yr
Risk factors via First Street. Map © Google.
Why this score? — see what drove the B- grade
The composite is a weighted blend of 9 inputs, each scored 0–100. Each bar is that input's sub-score; the figure is the points it added to the 100-point composite (weight × sub-score).
- Cash flow +26.4/30.0
- ARV discount +10.9/15.0
- DSCR +9.0/10.0
- 1% rule +6.4/10.0
- Schools +3.9/10.0
- Livability +3.6/5.0
- Rent growth +2.5/5.0
- Condition / age +2.5/5.0
- Appreciation +0.0/10.0
$186,900
🖨 Deal sheet 📄 Offer letter ✓ Due diligence
Listing remarks
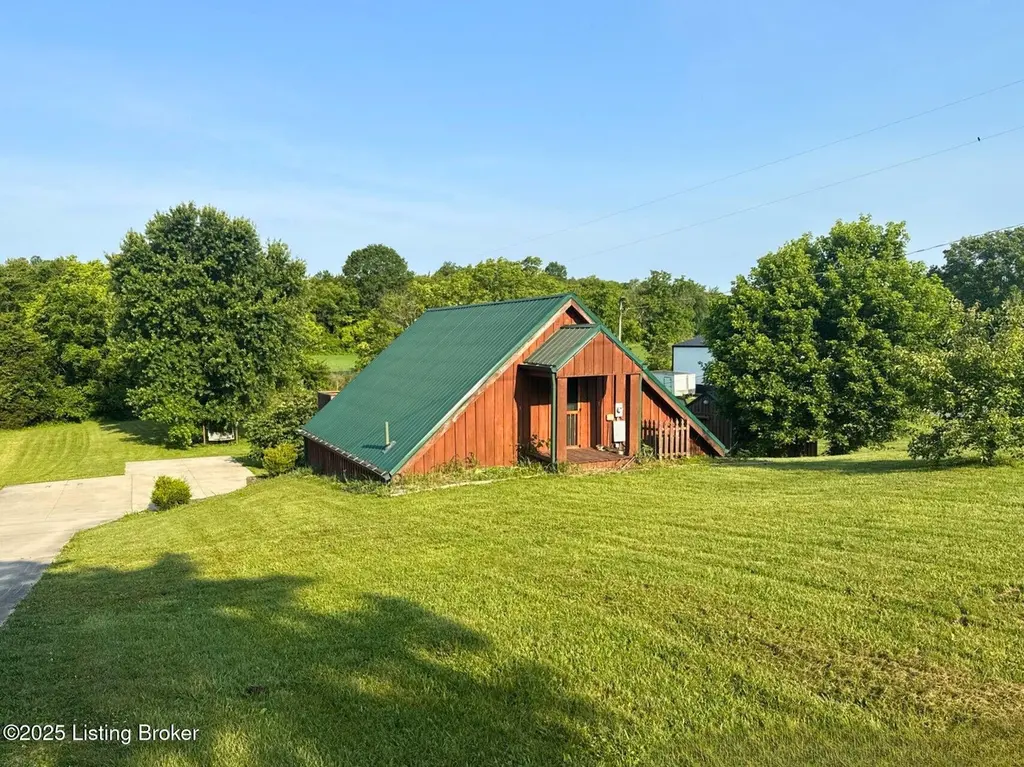
Tucked into the rolling hills of Taylorsville, this charming reverse berm home offers a unique blend of cozy living and country character! Featuring 3 bedrooms and 1.5 baths, this energy-efficient design keeps you comfortable year-round while surrounded by 1.38 acres of open space and natural beauty. Inside, you'll find an inviting layout that feels both warm and bright, perfect for quiet mornings or evenings spent with friends. Step outside to enjoy the peaceful setting—there's plenty of room to garden, explore, or simply unwind. If you've been searching for something a little different, full of personality and privacy, this Taylorsville gem is ready to welcome you home!
Key facts
- Room to garden
- 1.38 acre lot
- Parking
Tags
Property features AI
Finance
- HOA & community: No association fee
Exterior
- Parking: Driveway
- Utilities: Electricity connected
- Home design: Single-family residence; Two-story home; Built in 1985; Entry level living area above grade
- Construction: Wood frame construction; Metal roof; Slab foundation
- Exterior features: 1.38-acre lot
Interior
- Kitchen: Kitchen located on the first floor
- Bedrooms: Three bedrooms total; One bedroom on the first floor; Two bedrooms on the second floor
- Bathrooms: One full bathroom on the first floor; One half bathroom on the second floor
- Interior features: Five total rooms; Six closets; No basement
- Laundry & utility: Laundry room on the first floor; First-floor laundry
Neighborhood map
What this means for you Summary
Snapshot
- This is a 3-bed/1.5-bath other listed at $187k.
Deal economics
- At list price, monthly cash flow is $434 ($5k/yr) — positive.
- The deal already cash-flows at list — no discount required.
- Meets the 1% rule at list price ($2k rent vs $187k).
- Recommended offer: $181k (3.0% below list) — sets the bar for market timing.
- Cap rate 9.4% vs local median 4.0% in Taylorsville — top-decile yield for the area; either an underpriced asset or a hidden risk that comps aren't pricing in. Stress-test before assuming the spread holds.
Location & tenants
- Location reads 71/100 on livability (#149 in KY) — a middle-class / working-renter tenant base. Strengths: cost of living A+, housing A+, crime B; Watch: amenities F, commute F, employment F.
- Spencer County (rural): math 41% / reading 46% proficiency, ranked #18 of 165 in KY (top 11%) — families likely to look elsewhere, expect single-tenant / working-renter base with shorter leases.
- Market conditions: 114 active listings in the ZIP; 126 units permitted in Spencer County in 2024 (0 in 5+ unit buildings).
Forward outlook
- Local home prices are declining (-3.0%/yr); year-one equity from $1k of loan paydown is wiped out by about $6k of value loss. Plan a longer hold.
- Spencer County population projected at +17% by 2050 — long-run rental-demand tailwind backs the buy-and-hold thesis.
Negotiation context
- It's been on market 38 days — a 3% lower offer ($181k) is reasonable based on typical stale-listing flexibility.
- 5 sale attempts since 20y ago; this cycle's ask has dropped $22k (11%) from the opening price — seller is motivated, your offer sets the floor, not the list.
Risks & watch-outs
- Watch-outs: flood insurance adds $56/mo.
- Climate carrying-cost: severe flood risk — expect insurance premiums to compound above CPI over the hold.
Questions for the listing agent
- It's been on market 38 days. Have you received any prior offers? Is the seller open to a 3% concession, seller financing, or rate buy-down credit?
- What's the actual annual flood-insurance premium (NFIP or private), and is the property in a SFHA with mandatory coverage?
- Is there a deadline driving the sale (1031 exchange, divorce, estate, relocation)? That informs how much negotiation room exists.
- What's the average days-on-market for RENTAL listings here right now (not sales)? A rising rental-DOM trend means longer vacancies and softer asking-rent achievability than the comps imply.
- What's the recent tenant-quality profile in this submarket — average credit score on applications, eviction rate, late-payment / NSF rate, and stable-employment percentage? A property-management company in the area should have these aggregated.
- How much new for-sale + rental construction is in the pipeline within 1–3 miles? Heavy new supply typically softens prices + rents 12–24 months out; constrained supply supports both.
Investment metrics
- 1% rule
- 1.14% ✓
- Cap rate
- 9.43%
- Cash-on-cash
- 11.22%
- DSCR
- 1.50
- GRM
- 7.3
CMA / ARV
- ARV (median comp)
- $202,064
- List price
- $186,900
- Delta
- -7.50%
- Verdict
- FAIR
- Comps
- 2 within 1.0 mi
Projected returns pro-forma
-3.0% appreciation · 3.0% rent growth · sell at horizon
- IRR
- -1.3%
- Equity multiple
- 0.95×
- Total profit
- $-2,659
- Equity at exit
- $27,867
- IRR
- 8.3%
- Equity multiple
- 1.64×
- Total profit
- $33,287
- Equity at exit
- $16,160
Cash invested: $52,332 (down + closing). Projections, not guarantees.
Landlord ↔ Tenant lean methodology
- Overall (STATE)
- 83 Strongly Landlord-Friendly
- State Kentucky
- 83 Strongly Landlord-Friendly · R+16
- County
- — inherits STATE
- City
- — inherits STATE
ZIP-level market 40071
- Home prices YoY
- -13.4%
- Active inventory
- 114
- Price-to-rent
- 7.3×
Monthly cashflow live
- Estimated rent
- $2,139 medium interval (Pro) →
- Mortgage (P&I)
- −$980
- Tax from tax record
- −$142 /mo · $1,710/yr
- Insurance
- −$78
- Flood insurance flood zone
- −$56 /mo · $666/yr
- HOA
- −$0
- Vacancy / Maint / Mgmt
- −$449
- Net cashflow
- $434
Break-even live
UW: 25.0% down · 7.5% · 30yr · 1.5% tax · 5.0% vac · 8.0% maint · 8.0% mgmt
Financing live
Cash to close
- Down payment
- $46,725
- Closing costs
- $5,607
- Reserves months
- —
- Total cash needed
- —
Loan-product check · same deal, 3 products live
Conventional
25% down · 7.5% · 30yr
- Down + closing
- —
- Monthly P&I
- —
- Monthly cashflow
- —
- DSCR
- —
- Eligible?
- —
Personal DTI + credit; lowest rate.
DSCR
20% down · 8.5% · 30yr
- Down + closing
- —
- Monthly P&I
- —
- Monthly cashflow
- —
- DSCR
- —
- Eligible?
- —
No personal income docs; deal must DSCR.
Hard money
10% down · 12.0% · 12mo
- Down + closing
- —
- Monthly P&I
- —
- Monthly cashflow
- —
- DSCR
- —
- Eligible?
- —
Short-term bridge; refi at stabilization.
Listing history 26 events
-
2026-06-18days on market $186,900 Active 38 DOM
-
2026-06-17days on market $186,900 Active 37 DOM
-
2026-06-16days on market $186,900 Active 36 DOM
-
2026-06-15days on market $186,900 Active 35 DOM
-
2026-06-13days on market $186,900 Active 33 DOM
-
2026-06-10days on market $186,900 Active 30 DOM
-
2026-06-09days on market $186,900 Active 29 DOM
-
2026-06-08days on market $186,900 Active 28 DOM
-
2026-06-07days on market $186,900 Active 27 DOM
-
2026-06-03days on market $186,900 Active 23 DOM
-
2026-06-02days on market $186,900 Active 22 DOM
-
2026-06-02price $186,900 Active 21 DOM
-
2026-06-01days on market $209,000 Active 21 DOM
-
2026-05-31days on market $209,000 Active 20 DOM
-
2026-05-11$209,000 Active 686-char remark
-
2026-05-10historical
-
2026-01-24$209,000 Active
-
2025-12-22status Active
-
2025-12-10status Pending
-
2025-12-10historical
-
2025-10-28$209,000 Active
-
2021-03-02soldstatus $175,000
-
2020-08-04soldstatus $250,000
-
2007-01-13historical
-
2006-12-21soldstatus $65,000
-
2006-07-13$70,000
ⓘ Source: listings_history table (triggers on properties + properties_extension) + one-shot
backfill from property_details.listing_events for pre-trigger history.
Tax reassessment forecast KY · Resets to sale price
- Current annual tax
- $1,710 · $142/mo
- Projected year-2 tax
- $1,710 · $142/mo
- Expected delta
- $0/yr ($0/mo · 0.0%)
ⓘ Screening estimate from a state-policy table — verify with the county assessor before closing.
Climate risk First Street
- Flood 8/10 Severe FEMA zone X (unshaded) · 99% chance over 30 yrs
- Wildfire 4/10 Moderate
- Heat 4/10 Moderate 7 d/yr ≥104°F today · 19 d/yr by 30 yrs out
- Wind 2/10 Low 2% chance of damaging wind over 30 yrs
- Air quality 2/10 Low 1 unhealthy d/yr today · 2 by 30 yrs out
Nearby sold comps map
Loading sold comps map…
Walkable amenities ~0.75 mi
Loading nearby amenities…
Taxation est. · year 1
- Rental income
- $25,665
- − Mortgage interest
- −$10,469
- − Property taxes
- −$1,710
- − Insurance
- −$1,601
- − Repairs & maintenance
- −$2,053
- − Management
- −$2,053
- − Depreciation
- −$5,437
- Taxable income
- $2,342
- Est. tax owed @ 24.0%
- −$562
- After-tax cash flow
- $4,641/yr
For passive investors: Depreciation is non-cash, so a rental often shows a tax loss while cash-flowing — sheltering income. Rental losses are passive: they offset passive income freely, and up to $25,000/yr can offset ordinary (W-2) income if you actively participate and your MAGI is under $100k (phasing out to $0 by $150k); unused losses carry forward. On sale, claimed depreciation is recaptured at up to 25%, and gains may owe capital-gains tax (a 1031 exchange can defer both). Figures are a year-1 estimate at your 24.0% rate — not tax advice; consult a CPA.
Schools (NCES district)
- District
- Spencer County
- NCES district ID
- 2105490
- Math proficiency
- 41% ▼ -14.00%
- Reading proficiency
- 46% ▼ -19.00%
- Median HH income
- $64,167
- Composite
- 38.74/100
- National rank
- #4125
- State rank
- #18 of 165 in KY
Livability — Taylorsville
- Score
- 71/100
- State rank
- #149
- US rank
- #7189
Category grades
Schools grade is shown separately in the Schools card above.
Census & demographics
- Population (ZIP)
- 16,702
Population outlook (Spencer County) Hauer SSP2
- Today (2025)
- 20,077 people
- By 2030
- 21,008 · +4.6%
- By 2040
- 22,560 · +12.4%
- By 2050
- 23,480 · +16.9%
- By 2075
- 25,222 · +25.6%
- By 2100
- 25,550 · +27.3%
Race, ethnicity, and origin ACS 2023
- Neighborhood character
- Predominantly White (93%)
- Race & ethnicity
- White 93% Two or more races 4% Hispanic / Latino 2% Black 1%
- Common ancestry
- Italian 4% Slovak 2% Lithuanian 1%
- Foreign-born
- 1%
- Languages at home
- 99% English-only · Spanish 1%
Political lean MEDSL · Spencer
- 2024 margin
- Solid R (+56.7) · D 21.0% · R 77.8% · Other 1.2%
- 2008→2024 swing
- -21.2pp toward R · 2008: -35.5pp · 2024: -56.7pp
- All cycles
- 2024: R+56.7 2020: R+54.3 2016: R+55.5 2012: R+37.7 2008: R+35.5
Not yet ingested
- Civics
- —
Market trends
- HPI YoY
- ▼ -42.62%
- Current HPI
- 274.9283
- Rent YoY
- —
- Metro
- —
- State GDP YoY
- ▲ 1.81%
- F500 in state
- 4
Industry mix (Fortune 500 HQ in KY)
| Industry | F500 HQs | Revenue |
|---|---|---|
| Healthcare | 1 | $118B |
|
||
| Food / Beverage | 1 | $7B |
|
||
Price history
+167.0% since first listed13 events — show timeline
- 2026-06-01 Price Changed $186,900 Metro Search MLS
- 2026-05-11 Listed $209,000 Metro Search MLS
- 2026-05-10 Listing Removed — Metro Search MLS
- 2026-01-24 Listed $209,000 Metro Search MLS
- 2025-12-22 Relisted — Metro Search MLS
- 2025-12-10 Pending — Metro Search MLS
- 2025-12-10 Listing Removed — Metro Search MLS
- 2025-10-28 Listed $209,000 Metro Search MLS
- 2021-03-02 Sold (Public Records) $175,000 Public Records
- 2020-08-04 Sold (Public Records) $250,000 Public Records
- 2007-01-13 Listing Removed — Metro Search MLS
- 2006-12-21 Sold (Public Records) $65,000 Public Records
- 2006-07-13 Listed $70,000 Metro Search MLS
Property tax history
+9.1%/yrLatest (2025): $1,710 · -0.4% YoY. Source: county tax records.
Cash-flow waterfall
monthlySold comps — $/sqft
last 12 mo · ≤1 miLoading sold comps…