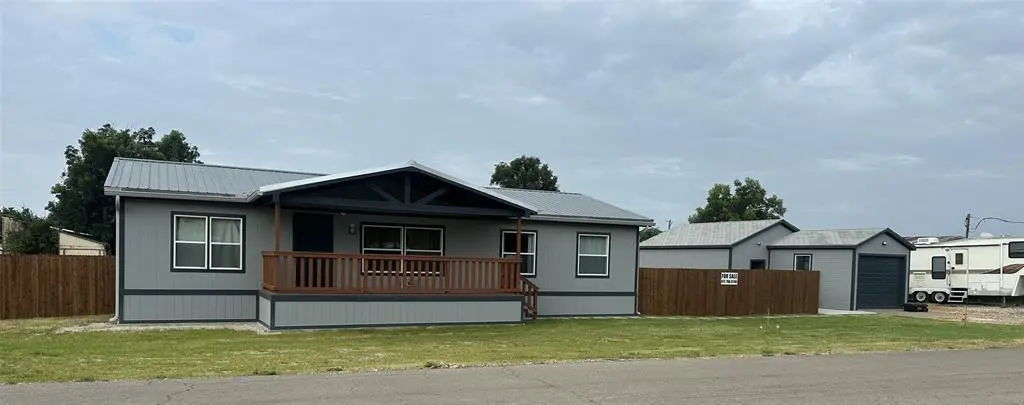
131 Lipan Trl · Horseshoe Bend, TX
Flood risk 4/10 · Minor
- FEMA flood zone
- AE
- Chance of flooding over 30 yrs
- 0.21%
- Est. flood insurance / yr
- $1,737 – $8,500
Fire risk 5/10 · Moderate
- Est. fire insurance / yr
- $1,222 – $2,270
Heat risk 7/10 · Major
- Hot days now (above 108°F)
- 7 days/yr
- Hot days in 30 yrs
- 23 days/yr
Wind risk 6/10 · Moderate
- Chance of severe wind over 30 yrs
- 27.0%
Air-quality risk 2/10 · Minimal
- Unhealthy air days now
- 1 days/yr
- Unhealthy air days in 30 yrs
- 2 days/yr
Risk factors via First Street. Map © Google.
Why this score? — see what drove the D- grade
The composite is a weighted blend of 9 inputs, each scored 0–100. Each bar is that input's sub-score; the figure is the points it added to the 100-point composite (weight × sub-score).
- Cash flow +15.0/30.0
- DSCR +4.6/10.0
- 1% rule +3.9/10.0
- Schools +3.6/10.0
- Rent growth +2.7/5.0
- Livability +2.7/5.0
- Condition / age +2.5/5.0
- ARV discount +0.0/15.0
- Appreciation +0.0/10.0
$189,000
🖨 Deal sheet (PDF) 📄 Offer letter ✓ Due diligence
Listing remarks MLS
This is a newly remodeled mobile home in Horseshoe Bend Air Park. This property sites next to the airstrip and is just a couple of blocks away from river access. The Community also has a golf course and small convenience store. The kitchen features new appliances, cabinets and countertops. There is new carpet in the two small bedrooms and new vinyl laminate flooring throughout the remainder of the home. The home has new covered front porch well as new side porch and new back porch. The back yard is completely enclosed with new wood privacy fence and has a large entry gate at the back of the property and entry gates on each side of the front of the property. Coop electric is active, and the property has a private well, as well as coop water. There is a 20x40 detached garage with tandem parking and workshop-office area. The property also features a large RV pad with hookups, including electric, water, and Septic. The back of the property is on the Cesna Trail taxi strip with ample space for a private hanger. Survey will need to be obtained by Buyer.
Key facts
- New carpet
- New cabinets
- New appliances
Tags
Neighborhood map
What this means for you Summary
Snapshot
- This is a 3-bed/2.0-bath manufactured listed at $189k.
Deal economics
- At list price, monthly cash flow is $-367 ($-4k/yr) — negative.
- To cash-flow at today's rent, offer at most $124k (34.3% below list).
- To meet the 1% rule (rent ≥ 1% of price), the offer needs to be $168k (10.9% below list).
- Recommended offer: $124k (34.3% below list) — sets the bar for cash-flow.
Location & tenants
- Location reads 54/100 on livability (#1,388 in TX) — a working-class tenant base; expect higher turnover. Strengths: cost of living A+, housing A+, crime A; Watch: amenities F, commute F, employment F.
- Weatherford ISD (town): math 39% / reading 44% proficiency, ranked #321 of 826 in TX (top 39%) — families likely to look elsewhere, expect single-tenant / working-renter base with shorter leases.
- Zoned schools: Wright El (math 32% / reading 32%, grade F, #2,268 of 4,322 statewide, top 55%, 575 students, 56% FRL); Hall Middle (math 43% / reading 45%, grade D, #512 of 1,662 statewide, top 32%, 973 students, 47% FRL); Weatherford H S (math 33% / reading 53%, grade F, #713 of 1,632 statewide, top 44%, 2,525 students, 40% FRL).
- Market conditions: Rents flat; 663 active listings in the ZIP; high-income renter base; 437 units permitted in Parker County in 2024 (0 in 5+ unit buildings).
- This rent is only 18% of the median local income ($114k/yr) — well below the 30% rent-burden line; pricing power to push rent on renewal without tenant pushback.
Forward outlook
- Local home prices are declining (-3.0%/yr); year-one equity from $1k of loan paydown is wiped out by about $6k of value loss. Plan a longer hold.
- Parker County population projected at +32% by 2050 — long-run rental-demand tailwind backs the buy-and-hold thesis.
Negotiation context
- It's been on market 167 days — a 12% lower offer ($166k) is reasonable based on typical stale-listing flexibility.
- 3 sale attempts; this cycle's ask has dropped $10k (5%) from the opening price — seller is motivated, your offer sets the floor, not the list.
Risks & watch-outs
- Watch-outs: flood insurance adds $427/mo.
- Climate carrying-cost: in FEMA flood zone AE (mandatory federal flood insurance); major wind risk, 27% chance of damaging wind over 30y; moderate wildfire risk; extreme-heat days projected 7→23/yr by 2055 (HVAC capex compounding) — expect insurance premiums to compound above CPI over the hold.
Questions for the listing agent
- What do current leases actually rent for vs. the listed asking? Can we see a recent rent roll and the last 12 months of T-12 income?
- It's been on market 167 days. Have you received any prior offers? Is the seller open to a 34% concession, seller financing, or rate buy-down credit?
- What's the actual annual flood-insurance premium (NFIP or private), and is the property in a SFHA with mandatory coverage?
- Why hasn't it sold? Are there any deal-killer items the seller is aware of (foundation, flood, title, zoning, code violations)?
- Is there a deadline driving the sale (1031 exchange, divorce, estate, relocation)? That informs how much negotiation room exists.
- Schools are F-rated, which usually means shorter tenancies and higher turnover. Who's the typical renter profile here, and what's been the actual vacancy rate?
- The area grade is low — what's the realistic commute time and amenity access for the typical tenant pool here? Any planned neighborhood developments (good or bad) we should know about?
- What's the average days-on-market for RENTAL listings here right now (not sales)? A rising rental-DOM trend means longer vacancies and softer asking-rent achievability than the comps imply.
- What's the recent tenant-quality profile in this submarket — average credit score on applications, eviction rate, late-payment / NSF rate, and stable-employment percentage? A property-management company in the area should have these aggregated.
- How much new for-sale + rental construction is in the pipeline within 1–3 miles? Heavy new supply typically softens prices + rents 12–24 months out; constrained supply supports both.
Investment metrics
- 1% rule
- 0.89% ✗
- Cap rate
- 6.67%
- Cash-on-cash
- 1.34%
- DSCR
- 1.06
- GRM
- 9.4
CMA / ARV
- ARV (median comp)
- $139,674
- List price
- $189,000
- Delta
- 35.32%
- Verdict
- OVERPRICED
- Comps
- 2 within 1.0 mi
Projected returns pro-forma
-3.0% appreciation · 0.73% rent growth · sell at horizon
- IRR
- -34.4%
- Equity multiple
- -0.09×
- Total profit
- $-57,527
- Equity at exit
- $28,181
- IRR
- -67.4%
- Equity multiple
- -0.77×
- Total profit
- $-93,900
- Equity at exit
- $16,341
Cash invested: $52,920 (down + closing). Projections, not guarantees.
Landlord ↔ Tenant lean methodology
- Overall (STATE)
- 87 Strongly Landlord-Friendly
- State Texas
- 87 Strongly Landlord-Friendly · R+5
- County
- — inherits STATE
- City
- — inherits STATE
ZIP-level market 76087
- Rents YoY
- 0.7%
- Active inventory
- 663
- Price-to-rent
- 9.4×
Monthly cashflow live
- Estimated rent
- $1,684 medium interval (Pro) →
- Mortgage (P&I)
- −$991
- Tax from tax record
- −$202 /mo · $2,420/yr
- Insurance
- −$79
- Flood insurance flood zone
- −$427 /mo · $5,118/yr
- HOA
- −$0
- Vacancy / Maint / Mgmt
- −$354
- Net cashflow
- $-367
Break-even live
Sensitivity live
| Price | -10% $-261 | -5% $-314 | +0% $-367 | +5% $-421 | +10% $-474 |
|---|---|---|---|---|---|
| Rent | -10% $-501 | -5% $-434 | +0% $-367 | +5% $-301 | +10% $-234 |
| Rate | -1.0pp $-272 | -0.5pp $-319 | base $-367 | +0.5pp $-416 | +1.0pp $-466 |
UW: 25.0% down · 7.5% · 30yr · 1.5% tax · 5.0% vac · 8.0% maint · 8.0% mgmt
Financing live
Cash to close
- Down payment
- $47,250
- Closing costs
- $5,670
- Reserves months
- —
- Total cash needed
- —
Loan-product check · same deal, 3 products live
Conventional
25% down · 7.5% · 30yr
- Down + closing
- —
- Monthly P&I
- —
- Monthly cashflow
- —
- DSCR
- —
- Eligible?
- —
Personal DTI + credit; lowest rate.
DSCR
20% down · 8.5% · 30yr
- Down + closing
- —
- Monthly P&I
- —
- Monthly cashflow
- —
- DSCR
- —
- Eligible?
- —
No personal income docs; deal must DSCR.
Hard money
10% down · 12.0% · 12mo
- Down + closing
- —
- Monthly P&I
- —
- Monthly cashflow
- —
- DSCR
- —
- Eligible?
- —
Short-term bridge; refi at stabilization.
Listing history 31 events
-
2026-06-21days on market $189,000 Active 167 DOM
-
2026-06-18days on market $189,000 Active 164 DOM
-
2026-06-17days on market $189,000 Active 163 DOM
-
2026-06-16days on market $189,000 Active 162 DOM
-
2026-06-15days on market $189,000 Active 161 DOM
-
2026-06-13days on market $189,000 Active 159 DOM
-
2026-06-09days on market $189,000 Active 155 DOM
-
2026-06-08days on market $189,000 Active 154 DOM
-
2026-06-07days on market $189,000 Active 153 DOM
-
2026-06-04days on market $189,000 Active 150 DOM
-
2026-06-03days on market $189,000 Active 149 DOM
-
2026-06-02days on market $189,000 Active 148 DOM
-
2026-06-01days on market $189,000 Active 147 DOM
-
2026-05-31days on market $189,000 Active 146 DOM
-
2026-05-15price $189,000 1072-char remark
Show marketing remark (1072 chars)
This is a newly remodeled mobile home in Horseshoe Bend Air Park. This property sites next to the airstrip and is just a couple of blocks away from river access. The Community also has a golf course and small convenience store. The kitchen features new appliances, cabinets and countertops. There is new carpet in the two small bedrooms and new vinyl laminate flooring throughout the remainder of the home. The home has new covered front porch well as new side porch and new back porch. The back yard is completely enclosed with new wood privacy fence and has a large entry gate at the back of the property and entry gates on each side of the front of the property. Coop electric is active, and the property has a private well, as well as coop water. There is a 20x40 detached garage with tandem parking and workshop-office area. The property also features a large RV pad with hookups, including electric, water, and Septic. The back of the property is on the Cesna Trail taxi strip with ample space for a private hanger. Survey will need to be obtained by Buyer.
-
2026-01-05$199,000 Active 1072-char remark
Show marketing remark (1072 chars)
This is a newly remodeled mobile home in Horseshoe Bend Air Park. This property sites next to the airstrip and is just a couple of blocks away from river access. The Community also has a golf course and small convenience store. The kitchen features new appliances, cabinets and countertops. There is new carpet in the two small bedrooms and new vinyl laminate flooring throughout the remainder of the home. The home has new covered front porch well as new side porch and new back porch. The back yard is completely enclosed with new wood privacy fence and has a large entry gate at the back of the property and entry gates on each side of the front of the property. Coop electric is active, and the property has a private well, as well as coop water. There is a 20x40 detached garage with tandem parking and workshop-office area. The property also features a large RV pad with hookups, including electric, water, and Septic. The back of the property is on the Cesna Trail taxi strip with ample space for a private hanger. Survey will need to be obtained by Buyer.
-
2025-12-31historical
-
2025-12-16price $238,900
-
2025-11-22price $239,900
-
2025-11-14price $255,900
-
2025-11-05price $256,900
-
2025-10-20price $257,900
-
2025-10-04price $258,900
-
2025-09-19price $259,900
-
2025-09-14price $288,900
-
2025-07-31$289,900 Active
-
2025-07-28historical
-
2025-07-03$289,900 Active
-
2023-04-04soldstatus
-
2015-10-28soldstatus
-
1998-10-27soldstatus
ⓘ Source: listings_history table (triggers on properties + properties_extension) + one-shot
backfill from property_details.listing_events for pre-trigger history.
Tax reassessment forecast TX · Resets to sale price
- Current annual tax
- $2,420 · $202/mo
- Projected year-2 tax
- $3,459 · $288/mo
- Expected delta
- +$1,039/yr (+$87/mo · 42.9%)
ⓘ Screening estimate from a state-policy table — verify with the county assessor before closing.
Climate risk First Street
- Flood 4/10 Moderate FEMA zone AE · 21% chance over 30 yrs
- Wildfire 5/10 Major
- Heat 7/10 Severe 7 d/yr ≥108°F today · 23 d/yr by 30 yrs out
- Wind 6/10 Major 27% chance of damaging wind over 30 yrs
- Air quality 2/10 Low 1 unhealthy d/yr today · 2 by 30 yrs out
Nearby sold comps map
Loading sold comps map…
Walkable amenities ~0.75 mi
Loading nearby amenities…
Taxation est. · year 1
- Rental income
- $20,211
- − Mortgage interest
- −$10,587
- − Property taxes
- −$2,420
- − Insurance
- −$6,064
- − Repairs & maintenance
- −$1,617
- − Management
- −$1,617
- − Depreciation
- −$5,498
- Taxable loss
- −$7,591
- Est. tax savings @ 24.0%
- +$1,822
- After-tax cash flow
- $-2,588/yr
For passive investors: Depreciation is non-cash, so a rental often shows a tax loss while cash-flowing — sheltering income. Rental losses are passive: they offset passive income freely, and up to $25,000/yr can offset ordinary (W-2) income if you actively participate and your MAGI is under $100k (phasing out to $0 by $150k); unused losses carry forward. On sale, claimed depreciation is recaptured at up to 25%, and gains may owe capital-gains tax (a 1031 exchange can defer both). Figures are a year-1 estimate at your 24.0% rate — not tax advice; consult a CPA.
Schools (NCES district)
- District
- Weatherford ISD
- NCES district ID
- 4844800
- Math proficiency
- 39% ▼ -3.00%
- Reading proficiency
- 44% ▼ -2.00%
- Median HH income
- $57,087
- Composite
- 36.4/100
- National rank
- #4679
- State rank
- #321 of 826 in TX
Livability — Horseshoe Bend
- Score
- 54/100
- State rank
- #1388
- US rank
- #23802
Category grades
Schools grade is shown separately in the Schools card above.
Census & demographics
- Census place
- Horseshoe Bend, TX
- County
- Parker County · 144,797 people
- Metro
- Dallas-Fort Worth-Arlington, TX
- Population (ZIP)
- 36,822
- Household income
- $114,306
- Rent vs Own
- Severe rent burden
- 497.0
Population outlook (Parker County) Hauer SSP2
- Today (2025)
- 147,426 people
- By 2030
- 157,863 · +7.1%
- By 2040
- 177,519 · +20.4%
- By 2050
- 194,786 · +32.1%
- By 2075
- 238,799 · +62.0%
- By 2100
- 264,126 · +79.2%
Race, ethnicity, and origin ACS 2023
- Neighborhood character
- Predominantly White (82%)
- Race & ethnicity
- White 82% Hispanic / Latino 13% Two or more races 11% Black 2%
- Hispanic origin (detail)
- Mexican 11%
- Common ancestry
- Slovak 2% Italian 2% Lithuanian 2%
- Foreign-born
- 7% · Canada, South Korea
- Languages at home
- 90% English-only · Spanish 9%
Political lean MEDSL · Parker
- 2024 margin
- Solid R (+66.4) · D 16.4% · R 82.8%
- 2008→2024 swing
- -11.2pp toward R · 2008: -55.2pp · 2024: -66.4pp
- All cycles
- 2024: R+66.4 2020: R+64.4 2016: R+67.5 2012: R+65.8 2008: R+55.2
Not yet ingested
- Civics
- —
Market trends
- HPI YoY
- ▼ -172.16%
- Current HPI
- 214.6694
- Rent YoY
- ▲ 0.73%
- Metro
- Dallas-Fort Worth-Arlington, TX
- State GDP YoY
- ▲ 3.95%
- F500 in state
- 110
Industry mix (Fortune 500 HQ in TX)
| Industry | F500 HQs | Revenue |
|---|---|---|
| Energy | 16 | $1,198B |
|
||
| Technology | 5 | $198B |
|
||
| Engineering / Construction | 4 | $72B |
|
||
| Energy Services | 3 | $60B |
|
||
| Utilities | 3 | $41B |
|
||
| Healthcare | 2 | $330B |
|
||
Price history
-34.8% since first listed17 events — show timeline
- 2026-05-15 Price Changed $189,000 NTREIS
- 2026-01-05 Listed $199,000 NTREIS
- 2025-12-31 Listing Removed — NTREIS
- 2025-12-16 Price Changed $238,900 NTREIS
- 2025-11-22 Price Changed $239,900 NTREIS
- 2025-11-14 Price Changed $255,900 NTREIS
- 2025-11-05 Price Changed $256,900 NTREIS
- 2025-10-20 Price Changed $257,900 NTREIS
- 2025-10-04 Price Changed $258,900 NTREIS
- 2025-09-19 Price Changed $259,900 NTREIS
- 2025-09-14 Price Changed $288,900 NTREIS
- 2025-07-31 Listed $289,900 NTREIS
- 2025-07-28 Listing Removed — NTREIS
- 2025-07-03 Listed $289,900 NTREIS
- 2023-04-04 Sold (Public Records) — Public Records
- 2015-10-28 Sold (Public Records) — Public Records
- 1998-10-27 Sold (Public Records) — Public Records
Property tax history
+14.1%/yrLatest (2025): $2,420 · +86.5% YoY. Source: county tax records.
Cash-flow waterfall
monthlySold comps — $/sqft
last 12 mo · ≤1 miLoading sold comps…