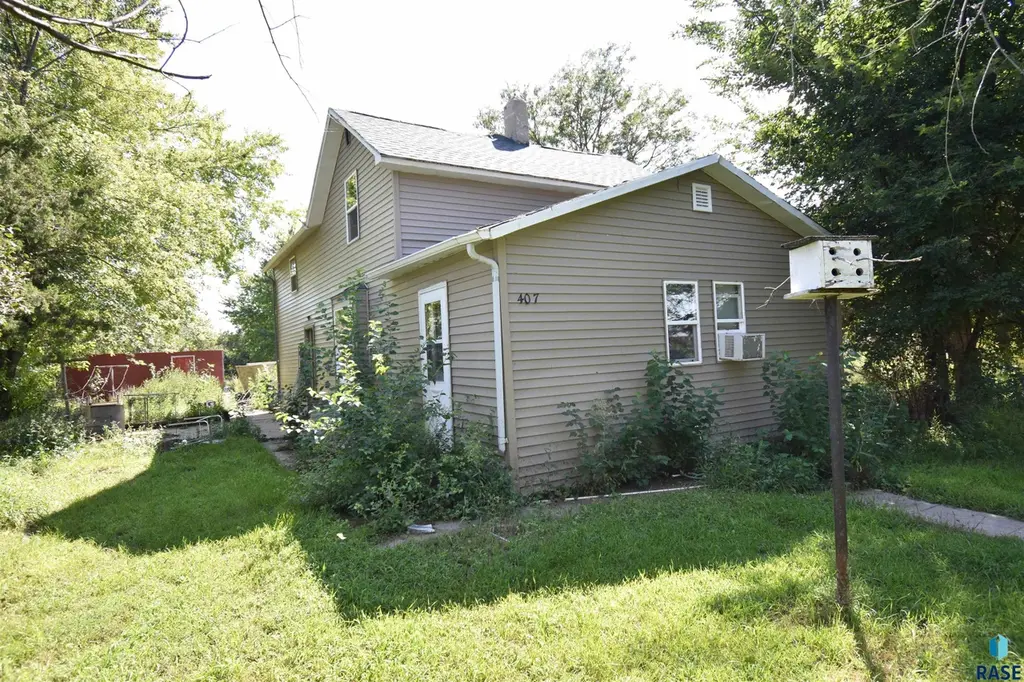
407 W Main St St · Delmont, SD
Flood risk 1/10 · Minimal
- FEMA flood zone
- —
- Chance of flooding over 30 yrs
- 0.0%
- Est. flood insurance / yr
- —
Fire risk 3/10 · Minor
- Est. fire insurance / yr
- $1,342 – $2,492
Heat risk 3/10 · Minor
- Hot days now (above 104°F)
- 7 days/yr
- Hot days in 30 yrs
- 14 days/yr
Wind risk 2/10 · Minimal
- Chance of severe wind over 30 yrs
- —
Air-quality risk 2/10 · Minimal
- Unhealthy air days now
- 1 days/yr
- Unhealthy air days in 30 yrs
- 1 days/yr
Risk factors via First Street. Map © Google.
Why this score? — see what drove the B grade
The composite is a weighted blend of 9 inputs, each scored 0–100. Each bar is that input's sub-score; the figure is the points it added to the 100-point composite (weight × sub-score).
- Cash flow +30.0/30.0
- 1% rule +10.0/10.0
- DSCR +10.0/10.0
- ARV discount +7.5/15.0
- Appreciation +5.0/10.0
- Schools +3.2/10.0
- Livability +3.1/5.0
- Rent growth +2.5/5.0
- Condition / age +2.5/5.0
$45,000
🖨 Deal sheet 📄 Offer letter ✓ Due diligence
Listing remarks MLS
Project house on a large lot near the edge of town. New shingles and vinyl siding in 2016.
Key facts
- Large lot
- New shingles
- Vinyl siding
Tags
Neighborhood map
What this means for you Summary
Snapshot
- This is a 3-bed/?-bath other listed at $45k.
Deal economics
- At list price, monthly cash flow is $651 ($8k/yr) — positive.
- The deal already cash-flows at list — no discount required.
- Meets the 1% rule at list price ($1k rent vs $45k).
- Recommended offer: $41k (9.0% below list) — sets the bar for market timing.
Location & tenants
- Location reads 62/100 on livability (#214 in SD) — a middle-class / working-renter tenant base. Strengths: cost of living A+, housing A+; Watch: schools D+, crime D, amenities F.
- Tripp-Delmont School District 33-5 (rural): math 35% / reading 35% proficiency, ranked #124 of 148 in SD (top 84%) — families likely to look elsewhere, expect single-tenant / working-renter base with shorter leases.
- Market conditions: 1 active listings in the ZIP; 6 units permitted in Douglas County in 2024 (0 in 5+ unit buildings).
Forward outlook
- In year one you build about $2k of equity ($311 loan paydown + $1k appreciation (3.0% local appreciation)).
- Douglas County population projected to shrink 3% by 2050 — rents likely to lag national; underwrite the cash flow, not the appreciation.
- At projected returns (3.0% appreciation + 3.0% rent growth), your $13k cash investment doubles in ~2 years — after that, you're playing with house money.
Negotiation context
- It's been on market 100 days — a 9% lower offer ($41k) is reasonable based on typical stale-listing flexibility.
- 2 sale attempts; this cycle's ask has dropped $15k (25%) from the opening price — seller is motivated, your offer sets the floor, not the list.
- Current owner paid $30k; list at $45k implies a 50% gain — meaningful room to come down on a strong offer.
Risks & watch-outs
- Watch-outs: built in 1901 — expect roof / HVAC / electrical / plumbing capex.
Questions for the listing agent
- It's been on market 100 days. Have you received any prior offers? Is the seller open to a 9% concession, seller financing, or rate buy-down credit?
- Built in 1901 — when were the roof, HVAC, electrical panel, plumbing, and water heater last replaced?
- Why hasn't it sold? Are there any deal-killer items the seller is aware of (foundation, flood, title, zoning, code violations)?
- Is there a deadline driving the sale (1031 exchange, divorce, estate, relocation)? That informs how much negotiation room exists.
- Schools are D-rated, which usually means shorter tenancies and higher turnover. Who's the typical renter profile here, and what's been the actual vacancy rate?
- Crime grade is D in this area — have there been break-ins, vandalism, or insurance claims at this property in the last 3 years? What carrier currently insures it and at what premium?
- What's the average days-on-market for RENTAL listings here right now (not sales)? A rising rental-DOM trend means longer vacancies and softer asking-rent achievability than the comps imply.
- What's the recent tenant-quality profile in this submarket — average credit score on applications, eviction rate, late-payment / NSF rate, and stable-employment percentage? A property-management company in the area should have these aggregated.
- How much new for-sale + rental construction is in the pipeline within 1–3 miles? Heavy new supply typically softens prices + rents 12–24 months out; constrained supply supports both.
Investment metrics
- 1% rule
- 2.71% ✓
- Cap rate
- 23.64%
- Cash-on-cash
- 61.97%
- DSCR
- 3.76
- GRM
- 3.1
CMA / ARV
- ARV (median comp)
- $90,465
- List price
- $45,000
- Delta
- -50.26%
- Verdict
- UNDERPRICED
- Comps
- 4 within 1.0 mi
Projected returns pro-forma
3.0% appreciation · 3.0% rent growth · sell at horizon
- IRR
- 66.8%
- Equity multiple
- 4.72×
- Total profit
- $46,880
- Equity at exit
- $20,234
- IRR
- 66.3%
- Equity multiple
- 9.64×
- Total profit
- $108,842
- Equity at exit
- $31,183
Cash invested: $12,600 (down + closing). Projections, not guarantees.
Landlord ↔ Tenant lean methodology
- Overall (STATE)
- 83 Strongly Landlord-Friendly
- State South Dakota
- 83 Strongly Landlord-Friendly · R+16
- County
- — inherits STATE
- City
- — inherits STATE
ZIP-level market 57330
- Active inventory
- 1
- Price-to-rent
- 3.1×
Monthly cashflow live
- Estimated rent
- $1,217 medium interval (Pro) →
- Mortgage (P&I)
- −$236
- Tax est. 1.5%
- −$56 /mo · $675/yr
- Insurance
- −$19
- HOA
- −$0
- Vacancy / Maint / Mgmt
- −$256
- Net cashflow
- $651
Break-even live
UW: 25.0% down · 7.5% · 30yr · 1.5% tax · 5.0% vac · 8.0% maint · 8.0% mgmt
Financing live
Cash to close
- Down payment
- $11,250
- Closing costs
- $1,350
- Reserves months
- —
- Total cash needed
- —
Loan-product check · same deal, 3 products live
Conventional
25% down · 7.5% · 30yr
- Down + closing
- —
- Monthly P&I
- —
- Monthly cashflow
- —
- DSCR
- —
- Eligible?
- —
Personal DTI + credit; lowest rate.
DSCR
20% down · 8.5% · 30yr
- Down + closing
- —
- Monthly P&I
- —
- Monthly cashflow
- —
- DSCR
- —
- Eligible?
- —
No personal income docs; deal must DSCR.
Hard money
10% down · 12.0% · 12mo
- Down + closing
- —
- Monthly P&I
- —
- Monthly cashflow
- —
- DSCR
- —
- Eligible?
- —
Short-term bridge; refi at stabilization.
Listing history 19 events
-
2026-06-18days on market $45,000 Active 100 DOM
-
2026-06-17days on market $45,000 Active 99 DOM
-
2026-06-16days on market $45,000 Active 98 DOM
-
2026-06-15days on market $45,000 Active 97 DOM
-
2026-06-13days on market $45,000 Active 95 DOM
-
2026-06-12days on market $45,000 Active 94 DOM
-
2026-06-09days on market $45,000 Active 91 DOM
-
2026-06-08days on market $45,000 Active 90 DOM
-
2026-06-08days on market $45,000 Active 89 DOM
-
2026-06-05days on market $45,000 Active 87 DOM
-
2026-06-04days on market $45,000 Active 85 DOM
-
2026-06-02days on market $45,000 Active 84 DOM
-
2026-06-01days on market $45,000 Active 83 DOM
-
2026-05-31days on market $45,000 Active 82 DOM
-
2026-04-18price $45,000 90-char remark
Show marketing remark (90 chars)
Project house on a large lot near the edge of town. New shingles and vinyl siding in 2016.
-
2026-03-09$60,000 Active 90-char remark
Show marketing remark (90 chars)
Project house on a large lot near the edge of town. New shingles and vinyl siding in 2016.
-
2025-11-24historical
-
2025-08-29$60,000 Active
-
2021-12-29soldstatus $30,000
ⓘ Source: listings_history table (triggers on properties + properties_extension) + one-shot
backfill from property_details.listing_events for pre-trigger history.
Climate risk First Street
- Flood 1/10 Low 0% chance over 30 yrs
- Wildfire 3/10 Moderate
- Heat 3/10 Moderate 7 d/yr ≥104°F today · 14 d/yr by 30 yrs out
- Wind 2/10 Low
- Air quality 2/10 Low 1 unhealthy d/yr today · 1 by 30 yrs out
Nearby sold comps map
Loading sold comps map…
Walkable amenities ~0.75 mi
Loading nearby amenities…
Taxation est. · year 1
- Rental income
- $14,607
- − Mortgage interest
- −$2,521
- − Property taxes
- −$675
- − Insurance
- −$225
- − Repairs & maintenance
- −$1,169
- − Management
- −$1,169
- − Depreciation
- −$1,309
- Taxable income
- $7,540
- Est. tax owed @ 24.0%
- −$1,810
- After-tax cash flow
- $5,998/yr
For passive investors: Depreciation is non-cash, so a rental often shows a tax loss while cash-flowing — sheltering income. Rental losses are passive: they offset passive income freely, and up to $25,000/yr can offset ordinary (W-2) income if you actively participate and your MAGI is under $100k (phasing out to $0 by $150k); unused losses carry forward. On sale, claimed depreciation is recaptured at up to 25%, and gains may owe capital-gains tax (a 1031 exchange can defer both). Figures are a year-1 estimate at your 24.0% rate — not tax advice; consult a CPA.
Schools (NCES district)
- District
- Tripp-Delmont School District 33-5
- NCES district ID
- 4672450
- Math proficiency
- 35% ▼ -5.00%
- Reading proficiency
- 35% ▼ -10.00%
- Median HH income
- $41,166
- Composite
- 32.13/100
- National rank
- #10980
- State rank
- #124 of 148 in SD
Livability — Delmont
- Score
- 62/100
- State rank
- #214
- US rank
- #16708
Category grades
Schools grade is shown separately in the Schools card above.
Census & demographics
- Census place
- Delmont, SD
- City population
- 548
- Population (ZIP)
- 548
Population outlook (Douglas County) Hauer SSP2
- Today (2025)
- 2,874 people
- By 2030
- 2,835 · -1.4%
- By 2040
- 2,795 · -2.7%
- By 2050
- 2,780 · -3.3%
- By 2075
- 3,181 · +10.7%
- By 2100
- 3,649 · +27.0%
Race, ethnicity, and origin ACS 2023
- Neighborhood character
- Predominantly White (93%)
- Race & ethnicity
- White 93% Two or more races 5% Hispanic / Latino 2% Native American 1%
- Common ancestry
- Subsaharan African 9% Portuguese 6% Lithuanian 3%
- Languages at home
- 89% English-only · German/W. Germanic 10% Spanish 1%
Political lean MEDSL · Douglas
- 2024 margin
- Solid R (+72.4) · D 13.2% · R 85.6% · Other 1.2%
- 2008→2024 swing
- -22.9pp toward R · 2008: -49.5pp · 2024: -72.4pp
- All cycles
- 2024: R+72.4 2020: R+73.3 2016: R+70.0 2012: R+59.3 2008: R+49.5
Not yet ingested
- Civics
- —
Market trends
- HPI YoY
- —
- Current HPI
- —
- Rent YoY
- —
- Metro
- —
- State GDP YoY
- ▲ 0.70%
- F500 in state
- 2
Industry mix (Fortune 500 HQ in SD)
| Industry | F500 HQs | Revenue |
|---|---|---|
| Utilities | 1 | $1B |
|
||
Price history
+50.0% since first listed5 events — show timeline
- 2026-04-18 Price Changed $45,000 REALTOR® Association of the Sioux Empire
- 2026-03-09 Listed $60,000 REALTOR® Association of the Sioux Empire
- 2025-11-24 Listing Removed — REALTOR® Association of the Sioux Empire
- 2025-08-29 Listed $60,000 REALTOR® Association of the Sioux Empire
- 2021-12-29 Sold (Public Records) $30,000 Public Records
Cash-flow waterfall
monthlySold comps — $/sqft
last 12 mo · ≤1 miLoading sold comps…