 Triplex
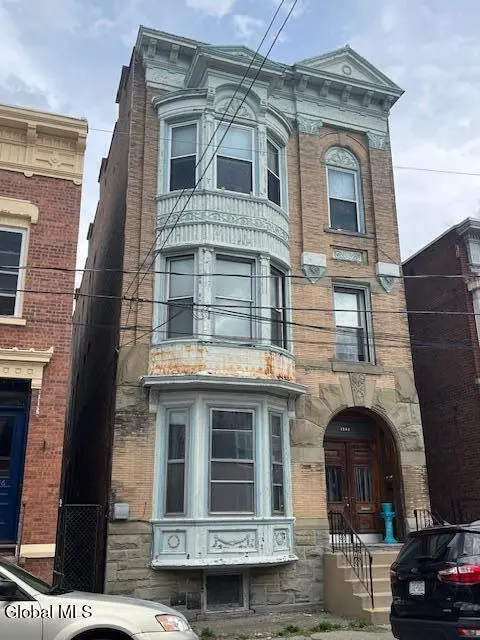
1040 5th Ave · Troy, NY
Flood risk 9/10 · Severe
- FEMA flood zone
- AE
- Chance of flooding over 30 yrs
- 0.99%
- Est. flood insurance / yr
- $2,026 – $9,024
Fire risk 1/10 · Minimal
- Est. fire insurance / yr
- $691 – $1,283
Heat risk 4/10 · Minor
- Hot days now (above 96°F)
- 7 days/yr
- Hot days in 30 yrs
- 16 days/yr
Wind risk 3/10 · Minor
- Chance of severe wind over 30 yrs
- 6.0%
Air-quality risk 2/10 · Minimal
- Unhealthy air days now
- 0 days/yr
- Unhealthy air days in 30 yrs
- 1 days/yr
Risk factors via First Street. Map © Google.
Why this score? — see what drove the B+ grade
The composite is a weighted blend of 9 inputs, each scored 0–100. Each bar is that input's sub-score; the figure is the points it added to the 100-point composite (weight × sub-score).
- Cash flow +29.8/30.0
- ARV discount +15.0/15.0
- DSCR +10.0/10.0
- 1% rule +8.5/10.0
- Livability +4.0/5.0
- Schools +3.8/10.0
- Rent growth +3.7/5.0
- Condition / age +2.5/5.0
- Appreciation +0.0/10.0
$399,000
🖨 Deal sheet (PDF) 📄 Offer letter ✓ Due diligence
Multi-family units
County records classify this as Multi-Family (2-4 Unit). Listing-text estimate: 3 units. confirmed
Listing remarks MLS
Spacious and solid investment opportunity offering over 4,200 sq. ft. of living space. Built in 1880 and thoughtfully maintained, this brick three-family property features a total of 8 bedrooms, 2 additional office spaces and three full bathrooms, making it ideal for investors or owner-occupants looking for rental income. Each unit is generously sized, providing comfortable living with high ceilings and each unit has 2 decorative fireplaces. Most windows are newer replacement windows. A covered patio in the back yard and a 2 car garage with door opener and Siemens car charger complete this rare opportunity!
Key facts
- 3,049 sq ft lot
- 2 garage spots
- Built 1880
Neighborhood map
What this means for you Summary
Snapshot
- This is a 3 × 3-bed/1.0-bath units multifamily listed at $399k.
Deal economics
- At list price, monthly cash flow is $1k ($12k/yr) — positive. Per door: $336/mo.
- The deal already cash-flows at list — no discount required.
- Meets the 1% rule at list price ($5k rent vs $399k).
- Recommended offer: $375k (6.0% below list) — sets the bar for market timing.
- Cap rate 10.7% vs local median 5.5% in Troy — top-decile yield for the area; either an underpriced asset or a hidden risk that comps aren't pricing in. Stress-test before assuming the spread holds.
Location & tenants
- Location reads 81/100 on livability (#88 in NY, #1,350 nationally) — a professional / high-income tenant draw. Strengths: amenities A+, commute A+, housing A+; Watch: schools C-, employment C-, crime F.
- Troy City School District (urban): math 44% / reading 46% proficiency, ranked #467 of 590 in NY (top 79%) — families likely to look elsewhere, expect single-tenant / working-renter base with shorter leases; 62% free/reduced lunch — lower-income household profile, screen leases tightly.
- Market conditions: Rents rising fast (+4.9%/yr); 220 active listings in the ZIP; solid renter incomes; 405 units permitted in Rensselaer County in 2024 (224 in 5+ unit buildings).
- At $5,371/mo this rent would consume 85% of the median local household income ($76k/yr) (locally 2698% of renters already pay >50% of income on rent) — very limited rent-growth headroom before tenants either downsize or default.
Forward outlook
- Local home prices are declining (-3.0%/yr); year-one equity from $3k of loan paydown is wiped out by about $12k of value loss. Plan a longer hold.
- Rensselaer County population projected to shrink 6% by 2050 — rents likely to lag national; underwrite the cash flow, not the appreciation.
- At projected returns (-3.0% appreciation + 4.9% rent growth), your $112k cash investment doubles in ~9 years — after that, you're playing with house money.
Negotiation context
- It's been on market 68 days — a 6% lower offer ($375k) is reasonable based on typical stale-listing flexibility.
- 3 sale attempts since 24y ago with the ask held roughly flat each time — persistent listings suggest the price (not the market) is what's stuck; bring a comps-based counter.
- Current owner paid $109k; list at $399k implies a 266% gain — meaningful room to come down on a strong offer.
Risks & watch-outs
- Watch-outs: flood insurance adds $460/mo; built in 1880 — expect roof / HVAC / electrical / plumbing capex.
- Climate carrying-cost: in FEMA flood zone AE (mandatory federal flood insurance) — expect insurance premiums to compound above CPI over the hold.
Questions for the listing agent
- It's been on market 68 days. Have you received any prior offers? Is the seller open to a 6% concession, seller financing, or rate buy-down credit?
- Can we see the unit-by-unit rent roll, current vacancy, and any below-market leases? What's the average tenancy length?
- What capital expenditures (roof, boiler, parking lot, exteriors) have been made in the last 5 years, and what's planned in the next 2?
- Built in 1880 — when were the roof, HVAC, electrical panel, plumbing, and water heater last replaced?
- What's the actual annual flood-insurance premium (NFIP or private), and is the property in a SFHA with mandatory coverage?
- Why hasn't it sold? Are there any deal-killer items the seller is aware of (foundation, flood, title, zoning, code violations)?
- Is there a deadline driving the sale (1031 exchange, divorce, estate, relocation)? That informs how much negotiation room exists.
- Crime grade is F in this area — have there been break-ins, vandalism, or insurance claims at this property in the last 3 years? What carrier currently insures it and at what premium?
- What's the average days-on-market for RENTAL listings here right now (not sales)? A rising rental-DOM trend means longer vacancies and softer asking-rent achievability than the comps imply.
- What's the recent tenant-quality profile in this submarket — average credit score on applications, eviction rate, late-payment / NSF rate, and stable-employment percentage? A property-management company in the area should have these aggregated.
- How much new apartment / multifamily construction is in the pipeline within 1–3 miles? Heavy new supply (>2% of stock underway) typically softens rents 12–24 months out; light construction supports rent growth.
Investment metrics
- 1% rule
- 1.35% ✓
- Cap rate
- 10.71%
- Cash-on-cash
- 15.77%
- DSCR
- 1.70
- GRM
- 6.2
CMA / ARV
- ARV (median comp)
- $515,433
- List price
- $399,000
- Delta
- -22.59%
- Verdict
- UNDERPRICED
- Comps
- 20 within 1.0 mi
Show comp detail 6 sales within ~0.75 mi
| Address | Dist | Beds/Ba | Sqft | Sold | Price | $/sf | Match |
|---|---|---|---|---|---|---|---|
| 329 3rd St | 0.19mi | 12/3.0 (+1) | 4,240 (-1%) | 8mo | $312,700 | $74 | 78 |
| 318 1st St | 0.33mi | 10/4.0 (-1) | 4,128 (-4%) | 0mo | $560,000 | $136 | 70 |
| 192 1st St | 0.30mi | 10/3.0 (-1) | 3,990 (-7%) | 6mo | $320,500 | $80 | 65 |
| 308 3rd St | 0.13mi | 12/4.0 (+1) | 4,854 (+14%) | 3mo | $390,000 | $80 | 60 |
| 365 3rd St | 0.26mi | 10/3.0 (-1) | 3,903 (-9%) | 18mo | $395,000 | $101 | 53 |
| 132 1st St | 0.41mi | 10/4.0 (-1) | 3,900 (-9%) | 17mo | $400,000 | $103 | 43 |
Match score weights: distance 35% · size 25% · config 20% · recency 20%. Top-matched comps best support the ARV.
Projected returns pro-forma
-3.0% appreciation · 4.88% rent growth · sell at horizon
- IRR
- 2.3%
- Equity multiple
- 1.09×
- Total profit
- $10,247
- Equity at exit
- $59,492
- IRR
- 13.9%
- Equity multiple
- 2.23×
- Total profit
- $137,219
- Equity at exit
- $34,498
Cash invested: $111,720 (down + closing). Projections, not guarantees.
Landlord ↔ Tenant lean methodology
- Overall (STATE)
- 15 Strongly Tenant-Friendly
- State New York
- 15 Strongly Tenant-Friendly · D+10
- County
- — inherits STATE
- City
- — inherits STATE
ZIP-level market 12180
- Home prices YoY
- -33.3%
- Rents YoY
- 4.9%
- Active inventory
- 220
- Price-to-rent
- 18.6×
Monthly cashflow live
- Estimated rent
- $5,371 high interval (Pro) →
- Mortgage (P&I)
- −$2,092
- Tax from tax record
- −$516 /mo · $6,196/yr
- Insurance
- −$166
- Flood insurance flood zone
- −$460 /mo · $5,525/yr
- HOA
- −$0
- Vacancy / Maint / Mgmt
- −$1,128
- Net cashflow
- $1,008
Break-even live
Sensitivity live
| Price | -10% $1,234 | -5% $1,121 | +0% $1,008 | +5% $895 | +10% $782 |
|---|---|---|---|---|---|
| Rent | -10% $583 | -5% $795 | +0% $1,008 | +5% $1,220 | +10% $1,432 |
| Rate | -1.0pp $1,209 | -0.5pp $1,109 | base $1,008 | +0.5pp $904 | +1.0pp $799 |
3-unit breakdown (identical units grouped — click to expand)
| Units | Beds | Baths | Est. rent |
|---|---|---|---|
| 3× units | 3 | 1 | $5,370 |
| #1 | 3 | 1 | $1,790 |
| #2 | 3 | 1 | $1,790 |
| #3 | 3 | 1 | $1,790 |
| Total (3 units) | $5,371 | ||
UW: 25.0% down · 7.5% · 30yr · 1.5% tax · 5.0% vac · 8.0% maint · 8.0% mgmt
Financing live
Cash to close
- Down payment
- $99,750
- Closing costs
- $11,970
- Reserves months
- —
- Total cash needed
- —
Loan-product check · same deal, 3 products live
Conventional
25% down · 7.5% · 30yr
- Down + closing
- —
- Monthly P&I
- —
- Monthly cashflow
- —
- DSCR
- —
- Eligible?
- —
Personal DTI + credit; lowest rate.
DSCR
20% down · 8.5% · 30yr
- Down + closing
- —
- Monthly P&I
- —
- Monthly cashflow
- —
- DSCR
- —
- Eligible?
- —
No personal income docs; deal must DSCR.
Hard money
10% down · 12.0% · 12mo
- Down + closing
- —
- Monthly P&I
- —
- Monthly cashflow
- —
- DSCR
- —
- Eligible?
- —
Short-term bridge; refi at stabilization.
Listing history 23 events
-
2026-06-21days on market $399,000 Active 68 DOM
-
2026-06-18days on market $399,000 Active 65 DOM
-
2026-06-17days on market $399,000 Active 64 DOM
-
2026-06-16days on market $399,000 Active 63 DOM
-
2026-06-15days on market $399,000 Active 62 DOM
-
2026-06-14days on market $399,000 Active 60 DOM
-
2026-06-13days on market $399,000 Active 59 DOM
-
2026-06-10days on market $399,000 Active 57 DOM
-
2026-06-09days on market $399,000 Active 56 DOM
-
2026-06-08days on market $399,000 Active 55 DOM
-
2026-06-07days on market $399,000 Active 54 DOM
-
2026-06-03days on market $399,000 Active 50 DOM
-
2026-06-02days on market $399,000 Active 49 DOM
-
2026-06-01days on market $399,000 Active 48 DOM
-
2026-05-31days on market $399,000 Active 47 DOM
-
2026-05-31days on market $399,000 Active 46 DOM
-
2026-04-14$399,000 Active 615-char remark
Show marketing remark (615 chars)
Spacious and solid investment opportunity offering over 4,200 sq. ft. of living space. Built in 1880 and thoughtfully maintained, this brick three-family property features a total of 8 bedrooms, 2 additional office spaces and three full bathrooms, making it ideal for investors or owner-occupants looking for rental income. Each unit is generously sized, providing comfortable living with high ceilings and each unit has 2 decorative fireplaces. Most windows are newer replacement windows. A covered patio in the back yard and a 2 car garage with door opener and Siemens car charger complete this rare opportunity!
-
2024-03-14historical $1,495
-
2024-01-18price $1,495
-
2023-12-01$1,595
-
2002-10-31soldstatus $109,000 240-char remark
Show marketing remark (240 chars)
NO KIDDING, YOU'LL KICK YOURSELF IF YOU MISS THIS ONE! BEST 3 FAMILY OUT THERE, GARAGE WITH FIREPLACE, 2 EXTRA CITY LOTS INCLUDED, RENTS TO 1ST PERSON SHOWN! SO EZ! W/ 2 RENTS U LIVE ALMOST FOR FREE! WON'T LAST FOR SURE! Excellent Condition
-
2002-08-07historical 240-char remark
Show marketing remark (240 chars)
NO KIDDING, YOU'LL KICK YOURSELF IF YOU MISS THIS ONE! BEST 3 FAMILY OUT THERE, GARAGE WITH FIREPLACE, 2 EXTRA CITY LOTS INCLUDED, RENTS TO 1ST PERSON SHOWN! SO EZ! W/ 2 RENTS U LIVE ALMOST FOR FREE! WON'T LAST FOR SURE! Excellent Condition
-
2002-04-06$109,977 240-char remark
Show marketing remark (240 chars)
NO KIDDING, YOU'LL KICK YOURSELF IF YOU MISS THIS ONE! BEST 3 FAMILY OUT THERE, GARAGE WITH FIREPLACE, 2 EXTRA CITY LOTS INCLUDED, RENTS TO 1ST PERSON SHOWN! SO EZ! W/ 2 RENTS U LIVE ALMOST FOR FREE! WON'T LAST FOR SURE! Excellent Condition
ⓘ Source: listings_history table (triggers on properties + properties_extension) + one-shot
backfill from property_details.listing_events for pre-trigger history.
Tax reassessment forecast NY · Partial reset (capped growth)
- Current annual tax
- $6,196 · $516/mo
- Projected year-2 tax
- $6,470 · $539/mo
- Expected delta
- +$273/yr (+$23/mo · 4.4%)
ⓘ Screening estimate from a state-policy table — verify with the county assessor before closing.
Climate risk First Street
- Flood 9/10 Extreme FEMA zone AE · 99% chance over 30 yrs
- Wildfire 1/10 Low
- Heat 4/10 Moderate 7 d/yr ≥96°F today · 16 d/yr by 30 yrs out
- Wind 3/10 Moderate 6% chance of damaging wind over 30 yrs
- Air quality 2/10 Low 0 unhealthy d/yr today · 1 by 30 yrs out
Nearby sold comps map
Loading sold comps map…
Walkable amenities ~0.75 mi
Loading nearby amenities…
Taxation est. · year 1
- Rental income
- $64,452
- − Mortgage interest
- −$22,350
- − Property taxes
- −$6,196
- − Insurance
- −$7,520
- − Repairs & maintenance
- −$5,156
- − Management
- −$5,156
- − Depreciation
- −$11,607
- Taxable income
- $6,466
- Est. tax owed @ 24.0%
- −$1,552
- After-tax cash flow
- $10,540/yr
For passive investors: Depreciation is non-cash, so a rental often shows a tax loss while cash-flowing — sheltering income. Rental losses are passive: they offset passive income freely, and up to $25,000/yr can offset ordinary (W-2) income if you actively participate and your MAGI is under $100k (phasing out to $0 by $150k); unused losses carry forward. On sale, claimed depreciation is recaptured at up to 25%, and gains may owe capital-gains tax (a 1031 exchange can defer both). Figures are a year-1 estimate at your 24.0% rate — not tax advice; consult a CPA.
Schools (NCES district)
- District
- Troy City School District
- NCES district ID
- 3628950
- Math proficiency
- 44% ▲ 6.00%
- Reading proficiency
- 46% ▲ 6.00%
- Median HH income
- $42,143
- Composite
- 37.89/100
- National rank
- #4318
- State rank
- #467 of 590 in NY
Livability — Troy
- Score
- 81/100
- State rank
- #88
- US rank
- #1350
Category grades
Schools grade is shown separately in the Schools card above.
Census & demographics
- Census place
- Troy, NY
- County
- Rensselaer County · 75,590 people
- City population
- 53,479
- Metro
- Albany-Schenectady-Troy, NY
- Population (ZIP)
- 53,479
- Household income
- $75,851
- Rent vs Own
- Severe rent burden
- 2698.0
Population outlook (Rensselaer County) Hauer SSP2
- Today (2025)
- 162,400 people
- By 2030
- 161,746 · -0.4%
- By 2040
- 158,095 · -2.7%
- By 2050
- 152,966 · -5.8%
- By 2075
- 140,767 · -13.3%
- By 2100
- 124,727 · -23.2%
Race, ethnicity, and origin ACS 2023
- Neighborhood character
- Predominantly White (70%)
- Race & ethnicity
- White 70% Black 12% Hispanic / Latino 8% Two or more races 8% Asian 5%
- Hispanic origin (detail)
- Mexican 1% Puerto Rican 4%
- Common ancestry
- Romanian 5% Lithuanian 5% Slovak 1%
- Foreign-born
- 10% · Canada, China
- Languages at home
- 88% English-only · Spanish 4% Other Indo-European 2% Arabic 2%
Political lean MEDSL · Rensselaer
- 2024 margin
- Toss-up / Even · D 50.7% · R 49.3%
- 2008→2024 swing
- -8.0pp toward R · 2008: 9.3pp · 2024: 1.4pp
- All cycles
- 2024: D+1.4 2020: D+5.6 2016: R+2.9 2012: D+11.8 2008: D+9.3
Not yet ingested
- Civics
- —
Market trends
- HPI YoY
- ▼ -142.53%
- Current HPI
- 285.0762
- Rent YoY
- ▲ 4.88%
- Metro
- Albany-Schenectady-Troy, NY
- State GDP YoY
- ▲ 2.60%
- F500 in state
- 92
Industry mix (Fortune 500 HQ in NY)
| Industry | F500 HQs | Revenue |
|---|---|---|
| Financial Services | 10 | $950B |
|
||
| Consumer Goods | 9 | $162B |
|
||
| Insurance | 4 | $225B |
|
||
| Telecommunications | 2 | $144B |
|
||
| Pharmaceuticals | 2 | $112B |
|
||
| Media / Entertainment | 2 | $69B |
|
||
Price history
+262.8% since first listed7 events — show timeline
- 2026-04-14 Listed $399,000 Global MLS
- 2024-03-14 Rental Removed $1,495 APPFOLIO
- 2024-01-18 Price Changed $1,495 APPFOLIO
- 2023-12-01 Listed for Rent $1,595 APPFOLIO
- 2002-10-31 Sold (MLS) $109,000 Global MLS
- 2002-08-07 Listing Removed — Global MLS
- 2002-04-06 Listed $109,977 Global MLS
Property tax history
+14.1%/yrLatest (2025): $6,196 · +2.9% YoY. Source: county tax records.
Cash-flow waterfall
monthlySold comps — $/sqft
last 12 mo · ≤1 miLoading sold comps…