3410 de Reimer Ave Unit 12D · New York, NY
Flood risk 8/10 · Major
- FEMA flood zone
- X (unshaded)
- Chance of flooding over 30 yrs
- 0.78%
- Est. flood insurance / yr
- $507 – $1,088
Fire risk 1/10 · Minimal
- Est. fire insurance / yr
- $691 – $1,283
Heat risk 6/10 · Moderate
- Hot days now (above 99°F)
- 7 days/yr
- Hot days in 30 yrs
- 14 days/yr
Wind risk 6/10 · Moderate
- Chance of severe wind over 30 yrs
- 27.0%
Air-quality risk 5/10 · Moderate
- Unhealthy air days now
- 6 days/yr
- Unhealthy air days in 30 yrs
- 8 days/yr
Risk factors via First Street. Map © Google.
Why this score? — see what drove the D- grade
The composite is a weighted blend of 9 inputs, each scored 0–100. Each bar is that input's sub-score; the figure is the points it added to the 100-point composite (weight × sub-score).
- Appreciation +10.0/10.0
- ARV discount +7.5/15.0
- 1% rule +6.1/10.0
- Schools +5.0/10.0
- Livability +3.8/5.0
- Rent growth +2.5/5.0
- Condition / age +2.5/5.0
- Cash flow +1.5/30.0
- DSCR +0.0/10.0
$310,000
🖨 Deal sheet (PDF) 📄 Offer letter ✓ Due diligence
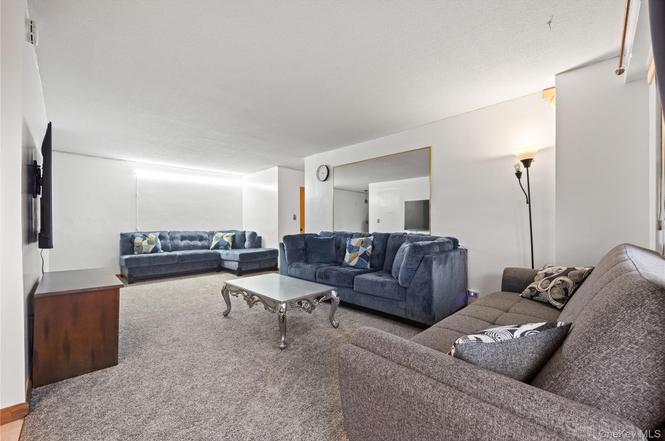
Listing remarks
Spacious and well-maintained, this three-bedroom, one-and-a-half-bath co-op located in the prime area of Baychester. The unit features a large living room with hardwood floors, a kitchen with a separate dining area, and a private terrace with stunning city views. Each of the three generously sized bedrooms includes a full-sized closet, providing plenty of storage space. The building is secure, with 16-hour daily security and a live-in superintendent, as well as amenities like a community room and an outdoor seating area. Maintenance includes gas, electricity, heat, hot water, and property taxes, and the monthly STAR deduction reduces the cost by $149.10. Only a 10% down payment is required,
Key facts
- 2 garage spots
- Built 1965
- Listed 163 days
Neighborhood map
What this means for you Summary
Snapshot
- This is a 3-bed/1.5-bath condo listed at $310k.
Deal economics
- At list price, monthly cash flow is $-1k ($-15k/yr) — negative.
- The deal already cash-flows at list — no discount required.
- Meets the 1% rule at list price ($3k rent vs $310k).
- Recommended offer: $273k (12.0% below list) — sets the bar for market timing.
- Cap rate 1.6% vs local median 2.6% in New York — below-typical yield; the buyer is paying a premium for something (appreciation thesis, condition, location) that the cap rate doesn't capture.
Location & tenants
- Location reads 75/100 on livability (#268 in NY, #4,188 nationally) — a middle-class / working-renter tenant base. Strengths: amenities A+, commute A+, health & safety A; Watch: crime F, cost of living F.
- Market conditions: 8 active listings in the ZIP; 5 comparable units currently listed for rent nearby; rentals at typical pace (median 25d on market — plan ~3-4 weeks tenant-placement turnaround); 6,929 units permitted in Bronx County in 2024 (6,829 in 5+ unit buildings).
Forward outlook
- In year one you build about $33k of equity ($2k loan paydown + $31k appreciation (10.0% local appreciation)).
- Bronx County population projected at +21% by 2050 — long-run rental-demand tailwind backs the buy-and-hold thesis.
- By year 2, paydown + projected appreciation supports a ~$53k cash-out refi (75% LTV) — recoverable capital for the next deal without selling this one.
Negotiation context
- It's been on market 163 days — a 12% lower offer ($273k) is reasonable based on typical stale-listing flexibility.
- 10 sale attempts since 11y ago; this cycle's ask has dropped $20k (6%) from the opening price — seller is motivated, your offer sets the floor, not the list.
- Current owner paid $180k; list at $310k implies a 72% gain — meaningful room to come down on a strong offer.
Risks & watch-outs
- Watch-outs: flood insurance adds $66/mo; HOA is 52% of rent.
- Climate carrying-cost: severe flood risk; major wind risk, 27% chance of damaging wind over 30y; extreme-heat days projected 7→14/yr by 2055 (HVAC capex compounding) — expect insurance premiums to compound above CPI over the hold.
Questions for the listing agent
- What do current leases actually rent for vs. the listed asking? Can we see a recent rent roll and the last 12 months of T-12 income?
- It's been on market 163 days. Have you received any prior offers? Is the seller open to a 12% concession, seller financing, or rate buy-down credit?
- Built in 1965 — when were the roof, HVAC, electrical panel, plumbing, and water heater last replaced?
- What's the actual annual flood-insurance premium (NFIP or private), and is the property in a SFHA with mandatory coverage?
- What does the HOA fee cover, when was the last increase, and are there any pending special assessments or reserve-fund shortfalls?
- Any open or pending special assessments — roof, HVAC, plumbing, elevator, façade? What's the per-unit balance and payoff schedule, and is the seller paying it off at close or rolling it to the buyer?
- Why hasn't it sold? Are there any deal-killer items the seller is aware of (foundation, flood, title, zoning, code violations)?
- Is there a deadline driving the sale (1031 exchange, divorce, estate, relocation)? That informs how much negotiation room exists.
- Schools are B-rated — typically a magnet for longer-tenancy family renters. What's the average tenant stay here, and is there a school-zone premium baked into asking?
- Crime grade is F in this area — have there been break-ins, vandalism, or insurance claims at this property in the last 3 years? What carrier currently insures it and at what premium?
- The area grade is low — what's the realistic commute time and amenity access for the typical tenant pool here? Any planned neighborhood developments (good or bad) we should know about?
- What's the average days-on-market for RENTAL listings here right now (not sales)? A rising rental-DOM trend means longer vacancies and softer asking-rent achievability than the comps imply.
- What's the recent tenant-quality profile in this submarket — average credit score on applications, eviction rate, late-payment / NSF rate, and stable-employment percentage? A property-management company in the area should have these aggregated.
- How much new apartment / multifamily construction is in the pipeline within 1–3 miles? Heavy new supply (>2% of stock underway) typically softens rents 12–24 months out; light construction supports rent growth.
Investment metrics
- 1% rule
- 1.11% ✓
- Cap rate
- 1.62%
- Cash-on-cash
- -16.69%
- DSCR
- 0.26
- GRM
- 7.5
CMA / ARV
No comps found within radius.
Projected returns pro-forma
10.0% appreciation · 3.0% rent growth · sell at horizon
- IRR
- 12.3%
- Equity multiple
- 2.02×
- Total profit
- $88,894
- Equity at exit
- $279,273
- IRR
- 12.9%
- Equity multiple
- 4.78×
- Total profit
- $327,925
- Equity at exit
- $602,262
Cash invested: $86,800 (down + closing). Projections, not guarantees.
Landlord ↔ Tenant lean methodology
- Overall (CITY)
- 0 Strongly Tenant-Friendly
- State New York
- 15 Strongly Tenant-Friendly · D+10
- County
- — inherits STATE
- City New York
- 0 Strongly Tenant-Friendly · D+34
ZIP-level market 10475
- Home prices YoY
- 12.1%
- Active inventory
- 8
- Price-to-rent
- 7.5×
Monthly cashflow live
- Estimated rent
- $3,429 high interval (Pro) →
- Mortgage (P&I)
- −$1,626
- Tax est. 1.5%
- −$388 /mo · $4,650/yr
- Insurance
- −$129
- Flood insurance flood zone
- −$66 /mo · $798/yr
- HOA est. from 2 same-building comps
- −$1,774
- Vacancy / Maint / Mgmt
- −$720
- Net cashflow
- $-1,274
Break-even live
Sensitivity live
| Price | -10% $-1,059 | -5% $-1,167 | +0% $-1,274 | +5% $-1,381 | +10% $-1,488 |
|---|---|---|---|---|---|
| Rent | -10% $-1,545 | -5% $-1,409 | +0% $-1,274 | +5% $-1,138 | +10% $-1,003 |
| Rate | -1.0pp $-1,118 | -0.5pp $-1,195 | base $-1,274 | +0.5pp $-1,354 | +1.0pp $-1,436 |
UW: 25.0% down · 7.5% · 30yr · 1.5% tax · 5.0% vac · 8.0% maint · 8.0% mgmt
Financing live
Cash to close
- Down payment
- $77,500
- Closing costs
- $9,300
- Reserves months
- —
- Total cash needed
- —
Loan-product check · same deal, 3 products live
Conventional
25% down · 7.5% · 30yr
- Down + closing
- —
- Monthly P&I
- —
- Monthly cashflow
- —
- DSCR
- —
- Eligible?
- —
Personal DTI + credit; lowest rate.
DSCR
20% down · 8.5% · 30yr
- Down + closing
- —
- Monthly P&I
- —
- Monthly cashflow
- —
- DSCR
- —
- Eligible?
- —
No personal income docs; deal must DSCR.
Hard money
10% down · 12.0% · 12mo
- Down + closing
- —
- Monthly P&I
- —
- Monthly cashflow
- —
- DSCR
- —
- Eligible?
- —
Short-term bridge; refi at stabilization.
Rent comps 5 comps
| Address | Beds | Baths | Sqft | Rent | $/sqft | DOM | Units | Dist |
|---|---|---|---|---|---|---|---|---|
| 60 Saint Pauls Pl Mount Vernon, NY | 3.0 | 1.0 | 1100 | $3,000 | $2.73 | 25d | 1 | 0.94mi |
| 641 S 5th Ave Unit 1ST Mt Vernon, NY | 3.0 | 1.5 | 1300 | $3,600 | $2.77 | 5d | 1 | 1.09mi |
| 607 S 5th Ave Unit 2ND Mt Vernon, NY | 3.0 | 1.0 | 1200 | $3,400 | $2.83 | 25d | 1 | 1.17mi |
| 421 S 10th Ave Mount Vernon, NY | 3.0 | 1.0 | 1200 | $3,500 | $2.92 | 25d | 1 | 1.40mi |
| 356 S Tenth Ave Unit 2nd Floor Mt Vernon, NY | 3.0 | 2.0 | 1100 | $3,850 | $3.50 | 25d | 1 | 1.46mi |
HOA detail condo
- Monthly dues
- $0 · $0/yr
- Likely covers
- watergaselectricsecurity
- Assessments
- None detected in remarks — confirm with the listing agent.
Listing history 27 events
-
2026-05-04status Pending
-
2026-04-06status Pending
-
2026-04-06status Active
-
2026-04-05historical
-
2026-01-28price $310,000
-
2025-11-17price $320,000
-
2025-10-25$330,000 Active
-
2025-10-20historical $330,000
-
2025-09-01historical
-
2025-03-24price $320,000
-
2025-03-24status Active
-
2025-03-16historical
-
2024-12-08status Active
-
2024-10-02$339,000 Active
-
2021-12-31historical
-
2021-05-18$310,000 Active
-
2020-11-06historical
-
2020-10-21historical
-
2020-07-11$300,000 Active
-
2020-07-10$300,000
-
2016-02-17soldstatus $180,000 Sold
-
2016-02-17price $180,000
-
2016-02-16soldstatus $180,000
-
2015-10-23historical Pending
-
2015-10-22price $183,795
-
2015-08-27$183,795 Active
-
2015-08-27$183,795
ⓘ Source: listings_history table (triggers on properties + properties_extension) + one-shot
backfill from property_details.listing_events for pre-trigger history.
Climate risk First Street
- Flood 8/10 Severe FEMA zone X (unshaded) · 78% chance over 30 yrs
- Wildfire 1/10 Low
- Heat 6/10 Major 7 d/yr ≥99°F today · 14 d/yr by 30 yrs out
- Wind 6/10 Major 27% chance of damaging wind over 30 yrs
- Air quality 5/10 Major 6 unhealthy d/yr today · 8 by 30 yrs out
Nearby sold comps map
Loading sold comps map…
Walkable amenities ~0.75 mi
Loading nearby amenities…
Taxation est. · year 1
- Rental income
- $41,151
- − Mortgage interest
- −$17,365
- − Property taxes
- −$4,650
- − Insurance
- −$2,348
- − Repairs & maintenance
- −$3,292
- − Management
- −$3,292
- − HOA
- −$21,288
- − Depreciation
- −$9,018
- Taxable loss
- −$20,102
- Est. tax savings @ 24.0%
- +$4,824
- After-tax cash flow
- $-10,460/yr
For passive investors: Depreciation is non-cash, so a rental often shows a tax loss while cash-flowing — sheltering income. Rental losses are passive: they offset passive income freely, and up to $25,000/yr can offset ordinary (W-2) income if you actively participate and your MAGI is under $100k (phasing out to $0 by $150k); unused losses carry forward. On sale, claimed depreciation is recaptured at up to 25%, and gains may owe capital-gains tax (a 1031 exchange can defer both). Figures are a year-1 estimate at your 24.0% rate — not tax advice; consult a CPA.
Schools (NCES district)
No district data.
Livability — New York
- Score
- 75/100
- State rank
- #268
- US rank
- #4188
Category grades
Schools grade is shown separately in the Schools card above.
Census & demographics
- Census place
- New York, NY
- City population
- 7,731,280
- Population (ZIP)
- 42,771
Population outlook (Bronx County) Hauer SSP2
- Today (2025)
- 1,607,353 people
- By 2030
- 1,681,852 · +4.6%
- By 2040
- 1,824,421 · +13.5%
- By 2050
- 1,945,470 · +21.0%
- By 2075
- 2,187,887 · +36.1%
- By 2100
- 2,244,136 · +39.6%
Race, ethnicity, and origin ACS 2023
- Neighborhood character
- Majority Black (60%)
- Race & ethnicity
- Black 60% Hispanic / Latino 30% Two or more races 9% White 5% Asian 2%
- Hispanic origin (detail)
- Mexican 1% Puerto Rican 18% Dominican 7%
- Common ancestry
- Scotch-Irish 1% Lithuanian 1%
- Foreign-born
- 25% · Canada
- Languages at home
- 68% English-only · Spanish 23% Russian/Polish/Slavic 1% French/Haitian/Cajun 1%
Political lean MEDSL · Bronx
- 2024 margin
- Solid D (+45.4) · D 72.7% · R 27.3%
- 2008→2024 swing
- -32.3pp toward R · 2008: 77.8pp · 2024: 45.4pp
- All cycles
- 2024: D+45.4 2020: D+67.6 2016: D+79.1 2012: D+82.9 2008: D+77.8
Not yet ingested
- Civics
- —
Market trends
- HPI YoY
- ▲ 20.24%
- Current HPI
- 187.68
- Rent YoY
- —
- Metro
- —
- State GDP YoY
- ▲ 2.60%
- F500 in state
- 92
Industry mix (Fortune 500 HQ in NY)
| Industry | F500 HQs | Revenue |
|---|---|---|
| Financial Services | 10 | $950B |
|
||
| Consumer Goods | 9 | $162B |
|
||
| Insurance | 4 | $225B |
|
||
| Telecommunications | 2 | $144B |
|
||
| Pharmaceuticals | 2 | $112B |
|
||
| Media / Entertainment | 2 | $69B |
|
||
Price history
+68.7% since first listed27 events — show timeline
- 2026-05-04 Pending — OneKey® MLS as Distributed by MLS Grid
- 2026-04-06 Pending — OneKey® MLS as Distributed by MLS Grid
- 2026-04-06 Relisted — OneKey® MLS as Distributed by MLS Grid
- 2026-04-05 Listing Removed — OneKey® MLS as Distributed by MLS Grid
- 2026-01-28 Price Changed $310,000 OneKey® MLS as Distributed by MLS Grid
- 2025-11-17 Price Changed $320,000 OneKey® MLS as Distributed by MLS Grid
- 2025-10-25 Listed $330,000 OneKey® MLS as Distributed by MLS Grid
- 2025-10-20 Coming Soon $330,000 OneKey® MLS as Distributed by MLS Grid
- 2025-09-01 Listing Removed — OneKey® MLS as Distributed by MLS Grid
- 2025-03-24 Price Changed $320,000 OneKey® MLS as Distributed by MLS Grid
- 2025-03-24 Relisted — OneKey® MLS as Distributed by MLS Grid
- 2025-03-16 Listing Removed — OneKey® MLS as Distributed by MLS Grid
- 2024-12-08 Relisted — OneKey® MLS as Distributed by MLS Grid
- 2024-10-02 Listed $339,000 OneKey® MLS as Distributed by MLS Grid
- 2021-12-31 Listing Removed — OneKey® MLS as Distributed by MLS Grid
- 2021-05-18 Listed $310,000 OneKey® MLS as Distributed by MLS Grid
- 2020-11-06 Listing Removed — OneKey® MLS as Distributed by MLS Grid
- 2020-10-21 Listing Removed — OneKey® MLS as Distributed by MLS Grid
- 2020-07-11 Listed $300,000 OneKey® MLS as Distributed by MLS Grid
- 2020-07-10 Listed $300,000 OneKey® MLS as Distributed by MLS Grid
- 2016-02-17 Price Changed $180,000 HGMLS
- 2016-02-17 Sold (MLS) $180,000 HGMLS
- 2016-02-16 Sold (MLS) $180,000 OneKey® MLS as Distributed by MLS Grid
- 2015-10-23 Contingent — HGMLS
- 2015-10-22 Price Changed $183,795 HGMLS
- 2015-08-27 Listed $183,795 HGMLS
- 2015-08-27 Listed $183,795 OneKey® MLS as Distributed by MLS Grid
Cash-flow waterfall
monthlySold comps — $/sqft
last 12 mo · ≤1 miLoading sold comps…