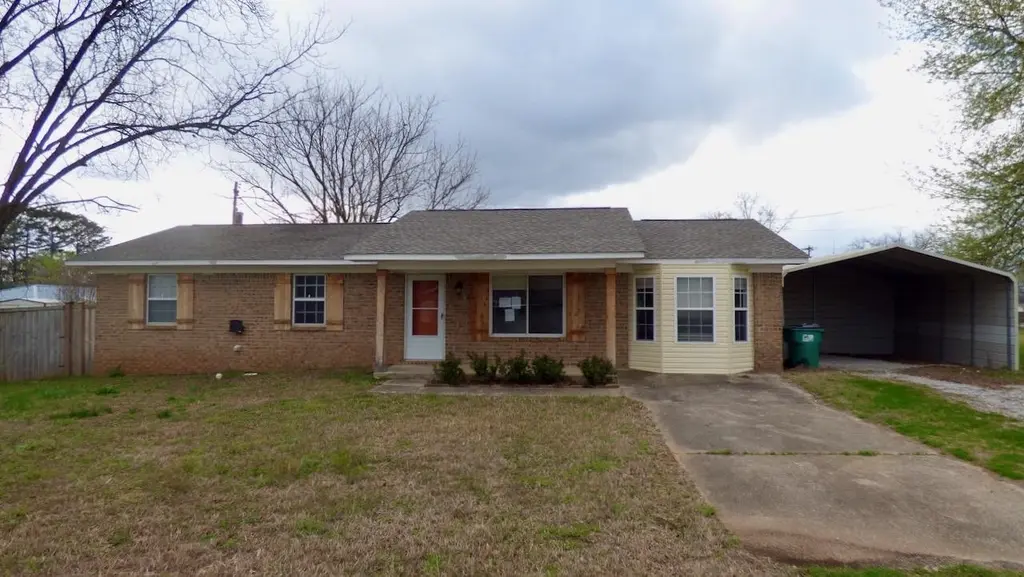
1308 Rush St · Tuscumbia, AL
Flood risk 1/10 · Minimal
- FEMA flood zone
- X (unshaded)
- Chance of flooding over 30 yrs
- 0.0%
- Est. flood insurance / yr
- $507 – $1,088
Fire risk 5/10 · Moderate
- Est. fire insurance / yr
- $916 – $1,700
Heat risk 6/10 · Moderate
- Hot days now (above 107°F)
- 7 days/yr
- Hot days in 30 yrs
- 21 days/yr
Wind risk 5/10 · Moderate
- Chance of severe wind over 30 yrs
- 26.0%
Air-quality risk 1/10 · Minimal
- Unhealthy air days now
- 0 days/yr
- Unhealthy air days in 30 yrs
- 0 days/yr
Risk factors via First Street. Map © Google.
Why this score? — see what drove the D grade
The composite is a weighted blend of 9 inputs, each scored 0–100. Each bar is that input's sub-score; the figure is the points it added to the 100-point composite (weight × sub-score).
- ARV discount +15.0/15.0
- Cash flow +12.2/30.0
- DSCR +3.6/10.0
- Livability +3.2/5.0
- Rent growth +2.5/5.0
- Schools +2.5/10.0
- Condition / age +2.5/5.0
- 1% rule +2.4/10.0
- Appreciation +0.0/10.0
$160,000
🖨 Deal sheet (PDF) 📄 Offer letter ✓ Due diligence
Listing remarks MLS
This three bedroom/2 bath adorable ranch style home has newer farmhouse style upgrades and a large privacy-fenced back yard, and it is such a wonderful place to call home. Quiet neighborhood, convenient to everything in the Tri-City area. Newer kitchen updates, newer flooring throughout, trim, paint, faucets, lighting, barn door to laundry room, and more. Right of redemption may apply. Case 013-042111. Property is Owned by the US Dept. of HUD. Insurability is "IE", Subject to Appraisal. The seller makes no representations or warranties as to the property condition. HUD Homes are sold “As-Is”. Equal Housing Opportunity. The seller may contribute up to 3% for buyer’s closing costs, upon buyer request. Lead-based paint notices to be included in the contract. Contact your agent today to schedule a showing.
Key facts
- Newer flooring
- Quiet neighborhood
- 0.3 acre lot
Tags
Neighborhood map
What this means for you Summary
Snapshot
- This is a 3-bed/1.5-bath single-family listed at $160k.
Deal economics
- At list price, monthly cash flow is $-31 ($-373/yr) — negative.
- To cash-flow at today's rent, offer at most $155k (3.4% below list).
- To meet the 1% rule (rent ≥ 1% of price), the offer needs to be $118k (26.2% below list).
- Recommended offer: $118k (26.2% below list) — sets the bar for 1% rule.
- Cap rate 6.1% vs local median 4.4% in Tuscumbia — top-decile yield for the area; either an underpriced asset or a hidden risk that comps aren't pricing in. Stress-test before assuming the spread holds.
Location & tenants
- Location reads 65/100 on livability (#122 in AL) — a middle-class / working-renter tenant base. Strengths: crime A+, cost of living A+, housing A+; Watch: employment D, amenities F, commute F.
- Tuscumbia City (suburban): math 18% / reading 41% proficiency, ranked #72 of 129 in AL (top 56%) — low school quality limits family demand, transient renter base, plan for 1-2y turnover.
- Zoned schools: G W Trenholm Primary School (420 students, 66% FRL); Deshler Middle School (math 11% / reading 37%, grade F, #168 of 257 statewide, top 66%, 349 students, 71% FRL); Deshler High School (math 22% / reading 32%, grade F, #90 of 305 statewide, top 35%, 434 students, 53% FRL) — zoned schools average 63% FRL vs 47% district-wide (16 pts higher); higher-poverty schools than district average — tighter screening recommended.
- Market conditions: 224 active listings in the ZIP; 1 comparable units currently listed for rent nearby; 91 units permitted in Colbert County in 2024 (0 in 5+ unit buildings).
Forward outlook
- Local home prices are declining (-3.0%/yr); year-one equity from $1k of loan paydown is wiped out by about $5k of value loss. Plan a longer hold.
- Colbert County population projected to shrink 7% by 2050 — rents likely to lag national; underwrite the cash flow, not the appreciation.
Negotiation context
- It's been on market 80 days — a 6% lower offer ($150k) is reasonable based on typical stale-listing flexibility.
- 8 sale attempts since 23y ago; this cycle's ask has dropped $40k (20%) from the opening price — seller is motivated, your offer sets the floor, not the list.
Risks & watch-outs
- Climate carrying-cost: moderate wind risk, 26% chance of damaging wind over 30y; moderate wildfire risk; extreme-heat days projected 7→21/yr by 2055 (HVAC capex compounding) — expect insurance premiums to compound above CPI over the hold.
Questions for the listing agent
- What do current leases actually rent for vs. the listed asking? Can we see a recent rent roll and the last 12 months of T-12 income?
- It's been on market 80 days. Have you received any prior offers? Is the seller open to a 26% concession, seller financing, or rate buy-down credit?
- Built in 1975 — when were the roof, HVAC, electrical panel, plumbing, and water heater last replaced?
- Why hasn't it sold? Are there any deal-killer items the seller is aware of (foundation, flood, title, zoning, code violations)?
- Is there a deadline driving the sale (1031 exchange, divorce, estate, relocation)? That informs how much negotiation room exists.
- Schools are D-rated, which usually means shorter tenancies and higher turnover. Who's the typical renter profile here, and what's been the actual vacancy rate?
- The area grade is low — what's the realistic commute time and amenity access for the typical tenant pool here? Any planned neighborhood developments (good or bad) we should know about?
- What's the average days-on-market for RENTAL listings here right now (not sales)? A rising rental-DOM trend means longer vacancies and softer asking-rent achievability than the comps imply.
- What's the recent tenant-quality profile in this submarket — average credit score on applications, eviction rate, late-payment / NSF rate, and stable-employment percentage? A property-management company in the area should have these aggregated.
- How much new for-sale + rental construction is in the pipeline within 1–3 miles? Heavy new supply typically softens prices + rents 12–24 months out; constrained supply supports both.
Investment metrics
- 1% rule
- 0.74% ✗
- Cap rate
- 6.06%
- Cash-on-cash
- -0.83%
- DSCR
- 0.96
- GRM
- 11.3
CMA / ARV
- ARV (median comp)
- $211,570
- List price
- $160,000
- Delta
- -24.37%
- Verdict
- UNDERPRICED
- Comps
- 20 within 1.0 mi
Show comp detail 12 sales within ~0.75 mi
| Address | Dist | Beds/Ba | Sqft | Sold | Price | $/sf | Match |
|---|---|---|---|---|---|---|---|
| 15 Sadie Ln | 0.19mi | 3/2.0 | 1,400 (-3%) | 4mo | $279,900 | $200 | 81 |
| 1306 Eastman Ave | 0.12mi | 3/2.0 | 1,561 (+8%) | 1mo | $239,900 | $154 | 78 |
| 1412 Greenbrier Dr | 0.23mi | 3/2.0 | 1,347 (-7%) | 8mo | $208,000 | $154 | 70 |
| 1402 Vista Cir | 0.13mi | 3/1.5 | 1,288 (-11%) | 8mo | $155,000 | $120 | 69 |
| 1407 Greenbrier Dr | 0.20mi | 3/2.0 | 1,340 (-7%) | 11mo | $210,000 | $157 | 68 |
| 1014 Madison St | 0.38mi | 3/2.0 | 1,533 (+6%) | 3mo | $100,000 | $65 | 67 |
| 906 Frankfort Rd | 0.43mi | 3/2.0 | 1,375 (-5%) | 4mo | $125,000 | $91 | 67 |
| 138 Willow Dr | 0.51mi | 3/2.0 | 1,500 (+4%) | 7mo | $267,000 | $178 | 62 |
| 209 W 3rd Ave | 0.68mi | 3/1.0 | 1,464 (+2%) | 3mo | $32,500 | $22 | 61 |
| 800 Old Lee Hwy | 0.66mi | 3/2.0 | 1,534 (+6%) | 2mo | $270,000 | $176 | 55 |
| 131 Willow Dr | 0.53mi | 3/2.0 | 1,630 (+13%) | 9mo | $273,900 | $168 | 44 |
| 203 Fourth Ave | 0.70mi | 3/2.0 | 1,301 (-10%) | 10mo | $182,500 | $140 | 41 |
Match score weights: distance 35% · size 25% · config 20% · recency 20%. Top-matched comps best support the ARV.
Projected returns pro-forma
-3.0% appreciation · 3.0% rent growth · sell at horizon
- IRR
- -17.7%
- Equity multiple
- 0.38×
- Total profit
- $-27,977
- Equity at exit
- $23,857
- IRR
- -9.9%
- Equity multiple
- 0.39×
- Total profit
- $-27,194
- Equity at exit
- $13,834
Cash invested: $44,800 (down + closing). Projections, not guarantees.
Landlord ↔ Tenant lean methodology
- Overall (STATE)
- 90 Strongly Landlord-Friendly
- State Alabama
- 90 Strongly Landlord-Friendly · R+15
- County
- — inherits STATE
- City
- — inherits STATE
ZIP-level market 35674
- Home prices YoY
- -28.4%
- Active inventory
- 224
- Price-to-rent
- 11.3×
Monthly cashflow live
- Estimated rent
- $1,181 medium interval (Pro) →
- Mortgage (P&I)
- −$839
- Tax from tax record
- −$58 /mo · $696/yr
- Insurance
- −$67
- HOA
- −$0
- Vacancy / Maint / Mgmt
- −$248
- Net cashflow
- $-31
Break-even live
Sensitivity live
| Price | -10% $59 | -5% $14 | +0% $-31 | +5% $-76 | +10% $-122 |
|---|---|---|---|---|---|
| Rent | -10% $-124 | -5% $-78 | +0% $-31 | +5% $16 | +10% $62 |
| Rate | -1.0pp $49 | -0.5pp $10 | base $-31 | +0.5pp $-73 | +1.0pp $-115 |
UW: 25.0% down · 7.5% · 30yr · 1.5% tax · 5.0% vac · 8.0% maint · 8.0% mgmt
Financing live
Cash to close
- Down payment
- $40,000
- Closing costs
- $4,800
- Reserves months
- —
- Total cash needed
- —
Loan-product check · same deal, 3 products live
Conventional
25% down · 7.5% · 30yr
- Down + closing
- —
- Monthly P&I
- —
- Monthly cashflow
- —
- DSCR
- —
- Eligible?
- —
Personal DTI + credit; lowest rate.
DSCR
20% down · 8.5% · 30yr
- Down + closing
- —
- Monthly P&I
- —
- Monthly cashflow
- —
- DSCR
- —
- Eligible?
- —
No personal income docs; deal must DSCR.
Hard money
10% down · 12.0% · 12mo
- Down + closing
- —
- Monthly P&I
- —
- Monthly cashflow
- —
- DSCR
- —
- Eligible?
- —
Short-term bridge; refi at stabilization.
Rent comps 1 comps
| Address | Beds | Baths | Sqft | Rent | $/sqft | DOM | Units | Dist |
|---|---|---|---|---|---|---|---|---|
| 107 Harrison Dr Tuscumbia, AL | 1.0–2.0 | 1.0–2.0 | 985 | $1,050 | $1.07 | 45d | 5 | 1.40mi |
Listing history 39 events
-
2026-06-21pricedays on market $160,000 Active 80 DOM
-
2026-06-19days on market $180,000 Active 78 DOM
-
2026-06-18days on market $180,000 Active 77 DOM
-
2026-06-17days on market $180,000 Active 76 DOM
-
2026-06-16days on market $180,000 Active 75 DOM
-
2026-06-15days on market $180,000 Active 74 DOM
-
2026-06-14days on market $180,000 Active 72 DOM
-
2026-06-13days on market $180,000 Active 71 DOM
-
2026-06-10days on market $180,000 Active 69 DOM
-
2026-06-09days on market $180,000 Active 68 DOM
-
2026-06-08days on market $180,000 Active 67 DOM
-
2026-06-07days on market $180,000 Active 66 DOM
-
2026-06-05days on market $180,000 Active 63 DOM
-
2026-06-03days on market $180,000 Active 62 DOM
-
2026-06-02days on market $180,000 Active 61 DOM
-
2026-06-01days on market $180,000 Active 60 DOM
-
2026-05-31days on market $180,000 Active 59 DOM
-
2026-05-30days on market $180,000 Active 58 DOM
-
2026-05-19price $180,000 841-char remark
Show marketing remark (841 chars)
This three bedroom/2 bath adorable ranch style home has newer farmhouse style upgrades and a large privacy-fenced back yard, and it is such a wonderful place to call home. Quiet neighborhood, convenient to everything in the Tri-City area. Newer kitchen updates, newer flooring throughout, trim, paint, faucets, lighting, barn door to laundry room, and more. Right of redemption may apply. Case 013-042111. Property is Owned by the US Dept. of HUD. Insurability is "IE", Subject to Appraisal. The seller makes no representations or warranties as to the property condition. HUD Homes are sold “As-Is”. Equal Housing Opportunity. The seller may contribute up to 3% for buyer’s closing costs, upon buyer request. Lead-based paint notices to be included in the contract. Contact your agent today to schedule a showing.
-
2026-04-02$200,000 Active 841-char remark
Show marketing remark (841 chars)
This three bedroom/2 bath adorable ranch style home has newer farmhouse style upgrades and a large privacy-fenced back yard, and it is such a wonderful place to call home. Quiet neighborhood, convenient to everything in the Tri-City area. Newer kitchen updates, newer flooring throughout, trim, paint, faucets, lighting, barn door to laundry room, and more. Right of redemption may apply. Case 013-042111. Property is Owned by the US Dept. of HUD. Insurability is "IE", Subject to Appraisal. The seller makes no representations or warranties as to the property condition. HUD Homes are sold “As-Is”. Equal Housing Opportunity. The seller may contribute up to 3% for buyer’s closing costs, upon buyer request. Lead-based paint notices to be included in the contract. Contact your agent today to schedule a showing.
-
2024-03-01soldstatus $200,000
-
2024-02-28soldstatus $200,000 Sold
-
2024-01-31soldstatus $235,000 Closed
-
2024-01-29historical Contingent
-
2024-01-29status Pending
-
2024-01-19$209,900 Active
-
2024-01-18$209,900 Active
-
2021-10-20soldstatus $130,000
-
2021-10-20soldstatus $130,000
-
2021-09-03$124,900
-
2020-07-29soldstatus $108,000
-
2020-07-23soldstatus $108,000
-
2020-07-22soldstatus $108,000
-
2020-07-22soldstatus $108,000
-
2020-06-28$119,900
-
2020-06-26$119,900
-
2017-08-18soldstatus $95,000
-
2017-02-13$99,900
-
2003-09-26$60,000
ⓘ Source: listings_history table (triggers on properties + properties_extension) + one-shot
backfill from property_details.listing_events for pre-trigger history.
Tax reassessment forecast AL · Resets to sale price
- Current annual tax
- $696 · $58/mo
- Projected year-2 tax
- $696 · $58/mo
- Expected delta
- $0/yr ($0/mo · 0.0%)
ⓘ Screening estimate from a state-policy table — verify with the county assessor before closing.
Climate risk First Street
- Flood 1/10 Low FEMA zone X (unshaded) · 0% chance over 30 yrs
- Wildfire 5/10 Major
- Heat 6/10 Major 7 d/yr ≥107°F today · 21 d/yr by 30 yrs out
- Wind 5/10 Major 26% chance of damaging wind over 30 yrs
- Air quality 1/10 Low 0 unhealthy d/yr today · 0 by 30 yrs out
Nearby sold comps map
Loading sold comps map…
Walkable amenities ~0.75 mi
Loading nearby amenities…
Taxation est. · year 1
- Rental income
- $14,167
- − Mortgage interest
- −$8,962
- − Property taxes
- −$696
- − Insurance
- −$800
- − Repairs & maintenance
- −$1,133
- − Management
- −$1,133
- − Depreciation
- −$4,655
- Taxable loss
- −$3,213
- Est. tax savings @ 24.0%
- +$771
- After-tax cash flow
- $398/yr
For passive investors: Depreciation is non-cash, so a rental often shows a tax loss while cash-flowing — sheltering income. Rental losses are passive: they offset passive income freely, and up to $25,000/yr can offset ordinary (W-2) income if you actively participate and your MAGI is under $100k (phasing out to $0 by $150k); unused losses carry forward. On sale, claimed depreciation is recaptured at up to 25%, and gains may owe capital-gains tax (a 1031 exchange can defer both). Figures are a year-1 estimate at your 24.0% rate — not tax advice; consult a CPA.
Schools (NCES district)
- District
- Tuscumbia City
- NCES district ID
- 0103420
- Math proficiency
- 18% ▼ -24.00%
- Reading proficiency
- 41% ▼ -7.00%
- Median HH income
- $39,168
- Composite
- 24.66/100
- National rank
- #7619
- State rank
- #72 of 129 in AL
Livability — Tuscumbia
- Score
- 65/100
- State rank
- #122
- US rank
- #12659
Category grades
Schools grade is shown separately in the Schools card above.
Census & demographics
- Census place
- Tuscumbia, AL
- County
- Colbert County · 20,176 people
- City population
- 20,176
- Metro
- Florence-Muscle Shoals, AL
- Population (ZIP)
- 20,176
- Household income
- $64,706
- Rent vs Own
- Severe rent burden
- 372.0
Population outlook (Colbert County) Hauer SSP2
- Today (2025)
- 54,154 people
- By 2030
- 53,746 · -0.8%
- By 2040
- 52,431 · -3.2%
- By 2050
- 50,303 · -7.1%
- By 2075
- 44,789 · -17.3%
- By 2100
- 36,676 · -32.3%
Race, ethnicity, and origin ACS 2023
- Neighborhood character
- Predominantly White (82%)
- Race & ethnicity
- White 82% Black 11% Hispanic / Latino 4% Two or more races 4%
- Common ancestry
- Slovak 2% Italian 1% Lithuanian 1%
- Foreign-born
- 2% · Canada
- Languages at home
- 98% English-only · Spanish 2%
Political lean MEDSL · Colbert
- 2024 margin
- Solid R (+46.4) · D 26.4% · R 72.8%
- 2008→2024 swing
- -26.2pp toward R · 2008: -20.3pp · 2024: -46.4pp
- All cycles
- 2024: R+46.4 2020: R+38.9 2016: R+38.3 2012: R+20.4 2008: R+20.3
Not yet ingested
- Civics
- —
Market trends
- HPI YoY
- ▼ -68.06%
- Current HPI
- 171.9693
- Rent YoY
- —
- Metro
- Florence-Muscle Shoals, AL
- State GDP YoY
- ▲ 2.94%
- F500 in state
- 4
Industry mix (Fortune 500 HQ in AL)
| Industry | F500 HQs | Revenue |
|---|---|---|
| Financial Services | 1 | $8B |
|
||
| Healthcare | 1 | $5B |
|
||
Price history
+200.0% since first listed21 events — show timeline
- 2026-05-19 Price Changed $180,000 SAARMLS
- 2026-04-02 Listed $200,000 SAARMLS
- 2024-03-01 Sold (Public Records) $200,000 Public Records
- 2024-02-28 Sold (MLS) $200,000 VMLS
- 2024-01-31 Sold (MLS) $235,000 SAARMLS
- 2024-01-29 Contingent — VMLS
- 2024-01-29 Pending — SAARMLS
- 2024-01-19 Listed $209,900 SAARMLS
- 2024-01-18 Listed $209,900 VMLS
- 2021-10-20 Sold (Public Records) $130,000 Public Records
- 2021-10-20 Sold (MLS) $130,000 SAARMLS
- 2021-09-03 Listed $124,900 SAARMLS
- 2020-07-29 Sold (Public Records) $108,000 Public Records
- 2020-07-23 Sold (Public Records) $108,000 Public Records
- 2020-07-22 Sold (MLS) $108,000 SAARMLS
- 2020-07-22 Sold (MLS) $108,000 VMLS
- 2020-06-28 Listed $119,900 VMLS
- 2020-06-26 Listed $119,900 SAARMLS
- 2017-08-18 Sold (MLS) $95,000 SAARMLS
- 2017-02-13 Listed $99,900 SAARMLS
- 2003-09-26 Listed $60,000 SAARMLS
Property tax history
+7.4%/yrLatest (2025): $696 · +28.8% YoY. Source: county tax records.
Cash-flow waterfall
monthlySold comps — $/sqft
last 12 mo · ≤1 miLoading sold comps…