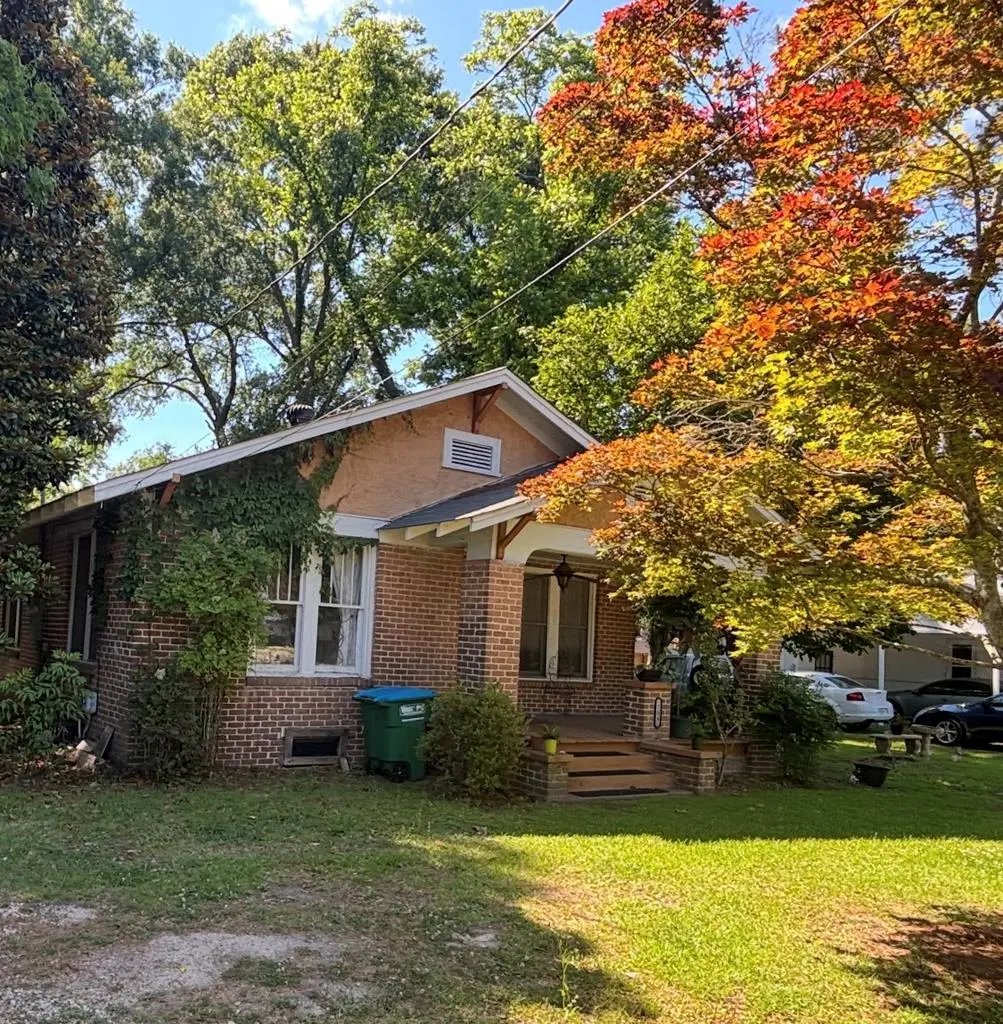
204 N Main St · Petal, MS
Flood risk 7/10 · Major
- FEMA flood zone
- X (shaded)
- Chance of flooding over 30 yrs
- 0.95%
- Est. flood insurance / yr
- $507 – $1,088
Fire risk 4/10 · Minor
- Est. fire insurance / yr
- $1,241 – $2,305
Heat risk 8/10 · Major
- Hot days now (above 106°F)
- 7 days/yr
- Hot days in 30 yrs
- 21 days/yr
Wind risk 8/10 · Major
- Chance of severe wind over 30 yrs
- 99.0%
Air-quality risk 1/10 · Minimal
- Unhealthy air days now
- 0 days/yr
- Unhealthy air days in 30 yrs
- 0 days/yr
Risk factors via First Street. Map © Google.
Why this score? — see what drove the C grade
The composite is a weighted blend of 9 inputs, each scored 0–100. Each bar is that input's sub-score; the figure is the points it added to the 100-point composite (weight × sub-score).
- Cash flow +17.2/30.0
- ARV discount +15.0/15.0
- DSCR +5.3/10.0
- Schools +5.3/10.0
- 1% rule +3.9/10.0
- Livability +3.7/5.0
- Rent growth +2.5/5.0
- Condition / age +2.5/5.0
- Appreciation +0.0/10.0
$142,500
🖨 Deal sheet 📄 Offer letter ✓ Due diligence
Listing remarks MLS
Convenient Location in Petal!! USDA Eligible!! Spacious 3 bedroom 1 bath. Bathroom has been nicely updated. Spacious kitchen has a newer gas stove. Fenced in back yard!!
Key facts
- 0.4 acre lot
- Parking
- Built 1927
Property features AI
Exterior
- Parking: Attached carport (1 space)
- Home design: Single-story historical residential property
- Construction: Brick construction
- Exterior features: Wood fencing, fenced yard
Interior
- Kitchen: Dishwasher; Refrigerator
- Flooring: Hardwood
- Bathrooms: 1 full bathroom
- Heating & cooling: Ceiling fan(s); Central cooling
- Interior features: Gas log fireplace; 6 total rooms; Crawl space
- Laundry & utility: Gas water heater
Neighborhood map
What this means for you Summary
Snapshot
- This is a 3-bed/1.0-bath single-family listed at $142k.
Deal economics
- At list price, monthly cash flow is $34 ($413/yr) — positive.
- The deal already cash-flows at list — no discount required.
- To meet the 1% rule (rent ≥ 1% of price), the offer needs to be $126k (11.4% below list).
- Recommended offer: $126k (11.4% below list) — sets the bar for 1% rule.
- Cap rate 7.1% vs local median 4.0% in Petal — top-decile yield for the area; either an underpriced asset or a hidden risk that comps aren't pricing in. Stress-test before assuming the spread holds.
Location & tenants
- Location reads 73/100 on livability (#18 in MS) — a middle-class / working-renter tenant base. Strengths: crime A+, cost of living A+, housing A+; Watch: health & safety D, amenities F, commute F.
- Petal School District (suburban): math 68% / reading 56% proficiency, ranked #2 of 130 in MS (top 2%) — acceptable for families but not a draw, mixed tenant base, ~2y average lease.
- Zoned schools: Petal Elementary (math 71% / reading 62%, grade B+, #14 of 375 statewide, top 3%, 634 students, 100% FRL); Petal Middle School (math 72% / reading 55%, grade B+, #3 of 179 statewide, top 2%, 745 students, 100% FRL); Petal High School (math 53% / reading 49%, grade D+, #17 of 197 statewide, top 9%, 1,288 students, 100% FRL) — zoned schools average 100% FRL vs 49% district-wide (51 pts higher); higher-poverty schools than district average — tighter screening recommended.
- Market conditions: 228 active listings in the ZIP; 2 comparable units currently listed for rent nearby; 121 units permitted in Forrest County in 2024 (30 in 5+ unit buildings).
Forward outlook
- Local home prices are declining (-3.0%/yr); year-one equity from $985 of loan paydown is wiped out by about $4k of value loss. Plan a longer hold.
- Forrest County population projected at +6% by 2050 — modest demand growth; plan on rents tracking national, not racing it.
Negotiation context
- It's been on market 45 days — a 3% lower offer ($138k) is reasonable based on typical stale-listing flexibility.
- 3 sale attempts since 11y ago with the ask held roughly flat each time — persistent listings suggest the price (not the market) is what's stuck; bring a comps-based counter.
- Current owner paid $89k; list at $142k implies a 60% gain — meaningful room to come down on a strong offer.
Risks & watch-outs
- Watch-outs: flood insurance adds $66/mo; built in 1927 — expect roof / HVAC / electrical / plumbing capex.
- Climate carrying-cost: major flood risk; severe wind risk, 99% chance of damaging wind over 30y; extreme-heat days projected 7→21/yr by 2055 (HVAC capex compounding) — expect insurance premiums to compound above CPI over the hold.
Questions for the listing agent
- It's been on market 45 days. Have you received any prior offers? Is the seller open to a 11% concession, seller financing, or rate buy-down credit?
- Built in 1927 — when were the roof, HVAC, electrical panel, plumbing, and water heater last replaced?
- What's the actual annual flood-insurance premium (NFIP or private), and is the property in a SFHA with mandatory coverage?
- Is there a deadline driving the sale (1031 exchange, divorce, estate, relocation)? That informs how much negotiation room exists.
- What's the average days-on-market for RENTAL listings here right now (not sales)? A rising rental-DOM trend means longer vacancies and softer asking-rent achievability than the comps imply.
- What's the recent tenant-quality profile in this submarket — average credit score on applications, eviction rate, late-payment / NSF rate, and stable-employment percentage? A property-management company in the area should have these aggregated.
- How much new for-sale + rental construction is in the pipeline within 1–3 miles? Heavy new supply typically softens prices + rents 12–24 months out; constrained supply supports both.
Investment metrics
- 1% rule
- 0.89% ✗
- Cap rate
- 7.14%
- Cash-on-cash
- 3.03%
- DSCR
- 1.13
- GRM
- 9.4
CMA / ARV
- ARV (median comp)
- $184,267
- List price
- $142,500
- Delta
- -22.67%
- Verdict
- UNDERPRICED
- Comps
- 10 within 1.0 mi
Show comp detail 4 sales within ~0.75 mi
| Address | Dist | Beds/Ba | Sqft | Sold | Price | $/sf | Match |
|---|---|---|---|---|---|---|---|
| 102 Smith St | 0.50mi | 3/2.0 | 1,391 (-2%) | 2mo | $199,900 | $144 | 68 |
| 126 Wilson Dr | 0.47mi | 3/1.0 | 1,326 (-7%) | 3mo | $100,000 | $75 | 64 |
| 113 Green St | 0.59mi | 3/2.0 | 1,500 (+5%) | 5mo | $219,900 | $147 | 56 |
| 142 W 5th Ave | 0.49mi | 4/1.5 (+1) | 1,525 (+7%) | 13mo | $189,500 | $124 | 47 |
Match score weights: distance 35% · size 25% · config 20% · recency 20%. Top-matched comps best support the ARV.
Projected returns pro-forma
-3.0% appreciation · 3.0% rent growth · sell at horizon
- IRR
- -14.6%
- Equity multiple
- 0.48×
- Total profit
- $-20,896
- Equity at exit
- $21,247
- IRR
- -6.0%
- Equity multiple
- 0.62×
- Total profit
- $-15,354
- Equity at exit
- $12,321
Cash invested: $39,900 (down + closing). Projections, not guarantees.
Landlord ↔ Tenant lean methodology
- Overall (STATE)
- 90 Strongly Landlord-Friendly
- State Mississippi
- 90 Strongly Landlord-Friendly · R+11
- County
- — inherits STATE
- City
- — inherits STATE
ZIP-level market 39465
- Active inventory
- 228
- Price-to-rent
- 9.4×
Monthly cashflow live
- Estimated rent
- $1,262 medium interval (Pro) →
- Mortgage (P&I)
- −$747
- Tax from tax record
- −$90 /mo · $1,077/yr
- Insurance
- −$59
- Flood insurance flood zone
- −$66 /mo · $798/yr
- HOA
- −$0
- Vacancy / Maint / Mgmt
- −$265
- Net cashflow
- $34
Break-even live
UW: 25.0% down · 7.5% · 30yr · 1.5% tax · 5.0% vac · 8.0% maint · 8.0% mgmt
Financing live
Cash to close
- Down payment
- $35,625
- Closing costs
- $4,275
- Reserves months
- —
- Total cash needed
- —
Loan-product check · same deal, 3 products live
Conventional
25% down · 7.5% · 30yr
- Down + closing
- —
- Monthly P&I
- —
- Monthly cashflow
- —
- DSCR
- —
- Eligible?
- —
Personal DTI + credit; lowest rate.
DSCR
20% down · 8.5% · 30yr
- Down + closing
- —
- Monthly P&I
- —
- Monthly cashflow
- —
- DSCR
- —
- Eligible?
- —
No personal income docs; deal must DSCR.
Hard money
10% down · 12.0% · 12mo
- Down + closing
- —
- Monthly P&I
- —
- Monthly cashflow
- —
- DSCR
- —
- Eligible?
- —
Short-term bridge; refi at stabilization.
Rent comps 2 comps
| Address | Beds | Baths | Sqft | Rent | $/sqft | DOM | Units | Dist |
|---|---|---|---|---|---|---|---|---|
| 120 E First Ave Petal, MS | 2.0 | 1.0 | 1062 | $995 | $0.94 | 43d | 1 | 0.24mi |
| 523 E Fifth Ave Petal, MS | 3.0 | 1.0 | 1098 | $1,500 | $1.37 | 21d | 1 | 0.75mi |
Listing history 21 events
-
2026-06-19days on market $142,500 Active 45 DOM
-
2026-06-18days on market $142,500 Active 44 DOM
-
2026-06-17days on market $142,500 Active 43 DOM
-
2026-06-16days on market $142,500 Active 42 DOM
-
2026-06-15days on market $142,500 Active 41 DOM
-
2026-06-14days on market $142,500 Active 39 DOM
-
2026-06-13days on market $142,500 Active 38 DOM
-
2026-06-10days on market $142,500 Active 36 DOM
-
2026-06-09days on market $142,500 Active 35 DOM
-
2026-06-08days on market $142,500 Active 34 DOM
-
2026-06-07days on market $142,500 Active 33 DOM
-
2026-06-05days on market $142,500 Active 30 DOM
-
2026-06-02days on market $142,500 Active 28 DOM
-
2026-06-01days on market $142,500 Active 27 DOM
-
2026-05-31days on market $142,500 Active 26 DOM
-
2026-05-30days on market $142,500 Active 25 DOM
-
2026-05-05$142,500 Active 523-char remark
-
2023-02-23soldstatus 169-char remark
Show marketing remark (169 chars)
Convenient Location in Petal!! USDA Eligible!! Spacious 3 bedroom 1 bath. Bathroom has been nicely updated. Spacious kitchen has a newer gas stove. Fenced in back yard!!
-
2017-04-24soldstatus $89,000
-
2017-03-13$89,000 169-char remark
Show marketing remark (169 chars)
Convenient Location in Petal!! USDA Eligible!! Spacious 3 bedroom 1 bath. Bathroom has been nicely updated. Spacious kitchen has a newer gas stove. Fenced in back yard!!
-
2015-05-30$86,000
ⓘ Source: listings_history table (triggers on properties + properties_extension) + one-shot
backfill from property_details.listing_events for pre-trigger history.
Tax reassessment forecast MS · Resets to sale price
- Current annual tax
- $1,077 · $90/mo
- Projected year-2 tax
- $1,126 · $94/mo
- Expected delta
- +$49/yr (+$4/mo · 4.5%)
ⓘ Screening estimate from a state-policy table — verify with the county assessor before closing.
Climate risk First Street
- Flood 7/10 Severe FEMA zone X (shaded) · 95% chance over 30 yrs
- Wildfire 4/10 Moderate
- Heat 8/10 Severe 7 d/yr ≥106°F today · 21 d/yr by 30 yrs out
- Wind 8/10 Severe 99% chance of damaging wind over 30 yrs
- Air quality 1/10 Low 0 unhealthy d/yr today · 0 by 30 yrs out
Nearby sold comps map
Loading sold comps map…
Walkable amenities ~0.75 mi
Loading nearby amenities…
Taxation est. · year 1
- Rental income
- $15,148
- − Mortgage interest
- −$7,982
- − Property taxes
- −$1,077
- − Insurance
- −$1,510
- − Repairs & maintenance
- −$1,212
- − Management
- −$1,212
- − Depreciation
- −$4,145
- Taxable loss
- −$1,990
- Est. tax savings @ 24.0%
- +$478
- After-tax cash flow
- $890/yr
For passive investors: Depreciation is non-cash, so a rental often shows a tax loss while cash-flowing — sheltering income. Rental losses are passive: they offset passive income freely, and up to $25,000/yr can offset ordinary (W-2) income if you actively participate and your MAGI is under $100k (phasing out to $0 by $150k); unused losses carry forward. On sale, claimed depreciation is recaptured at up to 25%, and gains may owe capital-gains tax (a 1031 exchange can defer both). Figures are a year-1 estimate at your 24.0% rate — not tax advice; consult a CPA.
Schools (NCES district)
- District
- Petal School District
- NCES district ID
- 2803530
- Math proficiency
- 68% ▼ -8.00%
- Reading proficiency
- 56% ▼ -6.00%
- Median HH income
- $51,872
- Composite
- 52.97/100
- National rank
- #1526
- State rank
- #2 of 130 in MS
Livability — Petal
- Score
- 73/100
- State rank
- #18
- US rank
- #5565
Category grades
Schools grade is shown separately in the Schools card above.
Census & demographics
- Census place
- Petal, MS
- County
- Forrest County · 65,413 people
- City population
- 22,882
- Metro
- Hattiesburg, MS
- Population (ZIP)
- 22,882
- Household income
- $74,035
- Rent vs Own
- Severe rent burden
- 199.0
Population outlook (Forrest County) Hauer SSP2
- Today (2025)
- 79,264 people
- By 2030
- 80,822 · +2.0%
- By 2040
- 82,979 · +4.7%
- By 2050
- 84,324 · +6.4%
- By 2075
- 84,942 · +7.2%
- By 2100
- 80,616 · +1.7%
Race, ethnicity, and origin ACS 2023
- Neighborhood character
- Predominantly White (81%)
- Race & ethnicity
- White 81% Black 13% Two or more races 3% Hispanic / Latino 3%
- Common ancestry
- Lithuanian 4% Slovak 2% Italian 1%
- Foreign-born
- 2% · Canada, Vietnam
- Languages at home
- 98% English-only · Spanish 2%
Political lean MEDSL · Forrest
- 2024 margin
- R (+17.9) · D 40.3% · R 58.2% · Other 1.4%
- 2008→2024 swing
- -4.4pp toward R · 2008: -13.5pp · 2024: -17.9pp
- All cycles
- 2024: R+17.9 2020: R+11.1 2016: R+14.2 2012: R+11.7 2008: R+13.5
Not yet ingested
- Civics
- —
Market trends
- HPI YoY
- ▼ -96.97%
- Current HPI
- 158.6021
- Rent YoY
- —
- Metro
- Hattiesburg, MS
- State GDP YoY
- —
- F500 in state
- 0
Price history
+65.7% since first listed5 events — show timeline
- 2026-05-05 Listed $142,500 LBOR
- 2023-02-23 Sold (MLS) — HAAR
- 2017-04-24 Sold (Public Records) $89,000 Public Records
- 2017-03-13 Listed $89,000 HAAR
- 2015-05-30 Listed $86,000 HAAR
Property tax history
+4.5%/yrLatest (2025): $1,077 · +22.6% YoY. Source: county tax records.
Cash-flow waterfall
monthlySold comps — $/sqft
last 12 mo · ≤1 miLoading sold comps…