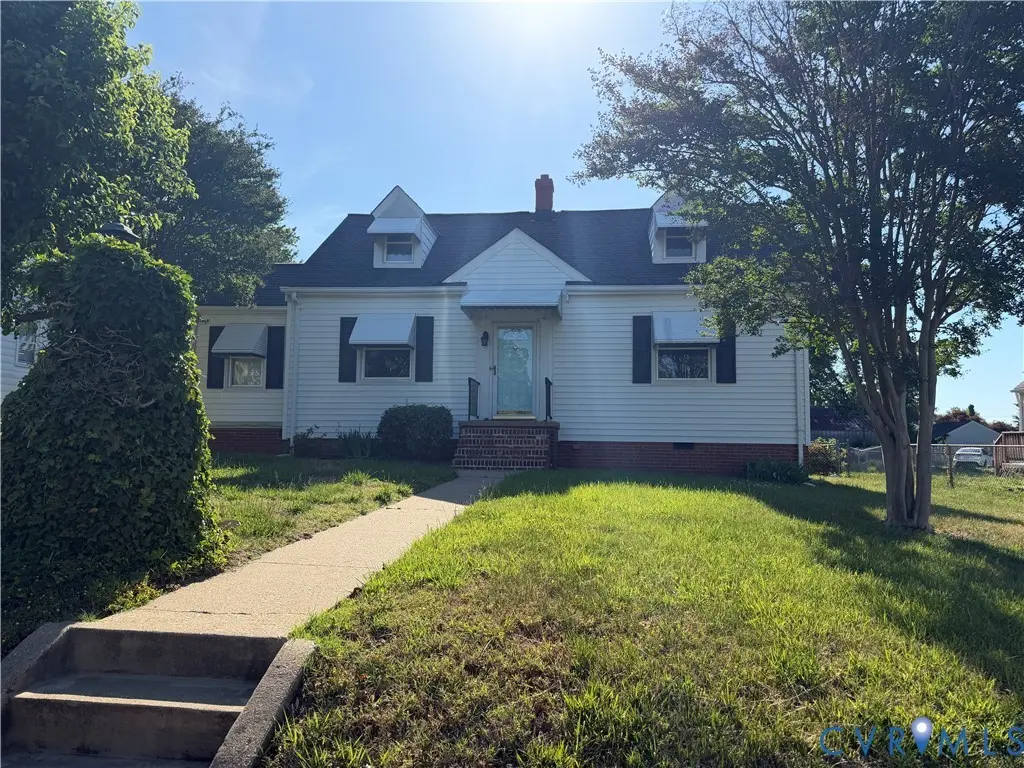
4207 Chickahominy Ave · East Highland Park, VA
Flood risk 1/10 · Minimal
- FEMA flood zone
- X (unshaded)
- Chance of flooding over 30 yrs
- 0.0%
- Est. flood insurance / yr
- $507 – $1,088
Fire risk 3/10 · Minor
- Est. fire insurance / yr
- $666 – $1,236
Heat risk 7/10 · Major
- Hot days now (above 105°F)
- 7 days/yr
- Hot days in 30 yrs
- 17 days/yr
Wind risk 6/10 · Moderate
- Chance of severe wind over 30 yrs
- 27.0%
Air-quality risk 2/10 · Minimal
- Unhealthy air days now
- 1 days/yr
- Unhealthy air days in 30 yrs
- 3 days/yr
Risk factors via First Street. Map © Google.
Why this score? — see what drove the D grade
The composite is a weighted blend of 9 inputs, each scored 0–100. Each bar is that input's sub-score; the figure is the points it added to the 100-point composite (weight × sub-score).
- Cash flow +12.1/30.0
- ARV discount +7.2/15.0
- Schools +4.9/10.0
- Rent growth +4.4/5.0
- DSCR +3.6/10.0
- Livability +3.6/5.0
- 1% rule +2.5/10.0
- Condition / age +2.5/5.0
- Appreciation +0.0/10.0
$289,950
🖨 Deal sheet 📄 Offer letter ✓ Due diligence
Listing remarks
Opportunity awaits with this well-maintained Cape Cod offering immediate move-in comfort, flexible living space, and outstanding potential at an affordable price. Featuring a large detached one-car garage, multiple bonus spaces, off-street parking, and a layout that lives larger than expected, this property delivers exceptional value for homeowners and investors alike. This charming home offers an abundance of versatile spaces, including 2 first-floor bedrooms, an additional bedroom upstairs, and a bonus room perfect for a home office, guest space, playroom, hobby room, or extra storage. In addition to the main living areas, the home features a cozy breakfast room, a practical mud room with
Key facts
- 8,102 sq ft lot
- Garage
- Built 1951
Property features AI
Exterior
- Parking: Detached garage; Approximately 1.5 garage spaces
- Utilities: Public water; Public sewer; Electric power (implied by electric heating and water heater)
- Home design: Single-story home; Resale property
- Construction: Frame construction with vinyl siding
- Exterior features: Public water; Public sewer; Zoning: R3
Interior
- Kitchen: Electric water heater
- Bedrooms: Total of 7 rooms (includes bedrooms and living spaces)
- Flooring: Carpet; Wood
- Bathrooms: 1 full bathroom with tub (located on the first level)
- Heating & cooling: Electric heating; Heat pump for heating; Heat pump for cooling
- Interior features: Crawl space basement
- Laundry & utility: Electric water heater
Neighborhood map
What this means for you Summary
Snapshot
- This is a 3-bed/1.0-bath single-family listed at $290k.
Deal economics
- At list price, monthly cash flow is $-65 ($-783/yr) — negative.
- To cash-flow at today's rent, offer at most $278k (4.0% below list).
- To meet the 1% rule (rent ≥ 1% of price), the offer needs to be $217k (25.1% below list).
- Recommended offer: $217k (25.1% below list) — sets the bar for 1% rule.
- Cap rate 6.0% vs local median 4.2% in East Highland Park — top-decile yield for the area; either an underpriced asset or a hidden risk that comps aren't pricing in. Stress-test before assuming the spread holds.
Location & tenants
- Location reads 72/100 on livability (#197 in VA) — a middle-class / working-renter tenant base. Strengths: cost of living A+, housing A+, health & safety A+; Watch: employment C-, schools D-, amenities D-.
- Henrico County Public School District (suburban): math 49% / reading 64% proficiency, ranked #68 of 131 in VA (top 52%) — acceptable for families but not a draw, mixed tenant base, ~2y average lease.
- Market conditions: Rents rising fast (+7.4%/yr); 179 active listings in the ZIP; 32 comparable units currently listed for rent nearby; rentals at typical pace (median 24d on market — plan ~3-4 weeks tenant-placement turnaround); 1,826 units permitted in Henrico County in 2024 (785 in 5+ unit buildings).
- This rent runs 42% of the median local income ($61k/yr) — at the standard rent-burdened threshold; future hikes will face affordability resistance.
Forward outlook
- Local home prices are declining (-3.0%/yr); year-one equity from $2k of loan paydown is wiped out by about $9k of value loss. Plan a longer hold.
- Henrico County population projected at +21% by 2050 — long-run rental-demand tailwind backs the buy-and-hold thesis.
Negotiation context
- It's been on market 16 days — a 2% lower offer ($286k) is reasonable based on typical stale-listing flexibility.
- Current owner paid $220k; 32% above their basis — modest negotiation headroom, anchor on the comps not their cost.
Risks & watch-outs
- Watch-outs: built in 1951 — expect roof / HVAC / electrical / plumbing capex.
- Climate carrying-cost: major wind risk, 27% chance of damaging wind over 30y; extreme-heat days projected 7→17/yr by 2055 (HVAC capex compounding) — expect insurance premiums to compound above CPI over the hold.
Questions for the listing agent
- What do current leases actually rent for vs. the listed asking? Can we see a recent rent roll and the last 12 months of T-12 income?
- Built in 1951 — when were the roof, HVAC, electrical panel, plumbing, and water heater last replaced?
- Is there a deadline driving the sale (1031 exchange, divorce, estate, relocation)? That informs how much negotiation room exists.
- Schools are D-rated, which usually means shorter tenancies and higher turnover. Who's the typical renter profile here, and what's been the actual vacancy rate?
- The area grade is low — what's the realistic commute time and amenity access for the typical tenant pool here? Any planned neighborhood developments (good or bad) we should know about?
- What's the average days-on-market for RENTAL listings here right now (not sales)? A rising rental-DOM trend means longer vacancies and softer asking-rent achievability than the comps imply.
- What's the recent tenant-quality profile in this submarket — average credit score on applications, eviction rate, late-payment / NSF rate, and stable-employment percentage? A property-management company in the area should have these aggregated.
- How much new for-sale + rental construction is in the pipeline within 1–3 miles? Heavy new supply typically softens prices + rents 12–24 months out; constrained supply supports both.
Investment metrics
- 1% rule
- 0.75% ✗
- Cap rate
- 6.02%
- Cash-on-cash
- -0.96%
- DSCR
- 0.96
- GRM
- 11.1
CMA / ARV
- ARV (on-the-fly)
- $287,820
- Comps found
- 12
Show comp detail 12 sales within ~0.75 mi
| Address | Dist | Beds/Ba | Sqft | Sold | Price | $/sf | Match |
|---|---|---|---|---|---|---|---|
| 1959 Mcdonald Rd | 0.07mi | 4/1.0 (+1) | 1,632 (+11%) | 1mo | $227,500 | $139 | 74 |
| 4202 Thomas Dr | 0.12mi | 4/2.0 (+1) | 1,543 (+4%) | 6mo | $190,000 | $123 | 73 |
| 1911 N Battery Dr | 0.14mi | 4/2.0 (+1) | 1,546 (+5%) | 8mo | $288,500 | $187 | 70 |
| 3910 Genacre Ln | 0.39mi | 3/1.0 | 1,586 (+8%) | 5mo | $255,000 | $161 | 65 |
| 3718 Hargrove Ave | 0.43mi | 4/1.0 (+1) | 1,356 (-8%) | 6mo | $260,000 | $192 | 57 |
| 4507 Gaines Rd | 0.42mi | 3/1.5 | 1,695 (+15%) | 0mo | $330,000 | $195 | 54 |
| 3605 Pemberton Ave | 0.57mi | 3/1.0 | 1,314 (-11%) | 5mo | $150,000 | $114 | 51 |
| 2126 Rhudy St | 0.74mi | 4/2.5 (+1) | 1,513 (+2%) | 2mo | $370,000 | $245 | 49 |
| 3822 Vawter Ave | 0.72mi | 3/2.0 | 1,398 (-5%) | 9mo | $325,000 | $232 | 46 |
| 3802 Martin Ave | 0.49mi | 4/2.0 (+1) | 1,632 (+11%) | 8mo | $340,450 | $209 | 44 |
| 4605 Olney Dr | 0.49mi | 4/2.5 (+1) | 1,664 (+13%) | 5mo | $349,000 | $210 | 41 |
| 2104 Byron St | 0.64mi | 4/2.0 (+1) | 1,314 (-11%) | 6mo | $277,900 | $211 | 38 |
Match score weights: distance 35% · size 25% · config 20% · recency 20%. Top-matched comps best support the ARV.
Projected returns pro-forma
-3.0% appreciation · 7.43% rent growth · sell at horizon
- IRR
- -13.6%
- Equity multiple
- 0.49×
- Total profit
- $-41,130
- Equity at exit
- $43,232
- IRR
- 0.6%
- Equity multiple
- 1.05×
- Total profit
- $3,891
- Equity at exit
- $25,070
Cash invested: $81,186 (down + closing). Projections, not guarantees.
Landlord ↔ Tenant lean methodology
- Overall (STATE)
- 55 Moderately Landlord-Leaning
- State Virginia
- 55 Moderately Landlord-Leaning · D+2
- County
- — inherits STATE
- City
- — inherits STATE
ZIP-level market 23222
- Rents YoY
- 7.4%
- Active inventory
- 179
- Price-to-rent
- 11.1×
Monthly cashflow live
- Estimated rent
- $2,172 high interval (Pro) →
- Mortgage (P&I)
- −$1,521
- Tax from tax record
- −$140 /mo · $1,677/yr
- Insurance
- −$121
- HOA
- −$0
- Vacancy / Maint / Mgmt
- −$456
- Net cashflow
- $-65
Break-even live
UW: 25.0% down · 7.5% · 30yr · 1.5% tax · 5.0% vac · 8.0% maint · 8.0% mgmt
Financing live
Cash to close
- Down payment
- $72,488
- Closing costs
- $8,698
- Reserves months
- —
- Total cash needed
- —
Loan-product check · same deal, 3 products live
Conventional
25% down · 7.5% · 30yr
- Down + closing
- —
- Monthly P&I
- —
- Monthly cashflow
- —
- DSCR
- —
- Eligible?
- —
Personal DTI + credit; lowest rate.
DSCR
20% down · 8.5% · 30yr
- Down + closing
- —
- Monthly P&I
- —
- Monthly cashflow
- —
- DSCR
- —
- Eligible?
- —
No personal income docs; deal must DSCR.
Hard money
10% down · 12.0% · 12mo
- Down + closing
- —
- Monthly P&I
- —
- Monthly cashflow
- —
- DSCR
- —
- Eligible?
- —
Short-term bridge; refi at stabilization.
Rent comps 32 comps
| Address | Beds | Baths | Sqft | Rent | $/sqft | DOM | Units | Dist |
|---|---|---|---|---|---|---|---|---|
| 4184 Park Trail Dr Richmond, VA | 3.0 | 2.5 | 1606 | $2,525 | $1.57 | 3d | 1 | 0.23mi |
| 4019 Grand Reserve Ln Richmond, VA | 3.0 | 2.5 | 1606 | $3,000 | $1.87 | 23d | 1 | 0.24mi |
| 4008 Wilmont Dr Richmond, VA | 3.0 | 1.0 | 1040 | $2,095 | $2.01 | 23d | 1 | 0.30mi |
| 4100 Concord Creek Pl Richmond, VA | 1.0–3.0 | 1.0–2.0 | 912 | $2,395 | $2.62 | 1d | 30 | 0.31mi |
| 4121 Concord Creek PL Richmond, VA | 1.0–2.0 | 1.0–2.0 | 892 | $2,570 | $2.88 | 1d | 26 | 0.43mi |
| 3607 Harris Ave Richmond, VA | 3.0 | 1.0 | 992 | $1,750 | $1.76 | 23d | 1 | 0.69mi |
| 1519 Byron St Richmond, VA | 3.0 | 1.5 | 1384 | $1,700 | $1.23 | 3d | 1 | 0.70mi |
| 3615 Ammons Ave Richmond, VA | 3.0 | 1.0 | 1200 | $1,595 | $1.33 | 14d | 1 | 0.75mi |
| 3621 Enslow Ave Richmond, VA | 2.0 | 1.5 | 1232 | $2,850 | $2.31 | 23d | 1 | 0.86mi |
| 3317 Waverly Blvd Unit B Richmond, VA | 3.0 | 2.0 | 1500 | $1,875 | $1.25 | 17d | 1 | 0.95mi |
| 3511 1st Ave Richmond, VA | 4.0 | 1.5 | 1600 | $2,050 | $1.28 | 23d | 1 | 0.95mi |
| 3411 Oxnard Rd Richmond, VA | 3.0 | 1.0 | 1083 | $1,795 | $1.66 | 17d | 1 | 1.05mi |
| 3462 Howard Rd Richmond, VA | 1.0–3.0 | 1.0 | 695 | $1,550 | $2.23 | 2d | 14 | 1.05mi |
| 3101 Divine Dr Richmond, VA | 3.0 | 2.5 | 1525 | $2,700 | $1.77 | 3d | 1 | 1.05mi |
| 3425 Carolina Ave Unit B Richmond, VA | 3.0 | 1.0 | 1300 | $1,400 | $1.08 | 23d | 1 | 1.06mi |
| 3425 Carolina Ave Unit A Richmond, VA | 3.0 | 1.0 | 1300 | $1,400 | $1.08 | 43d | 1 | 1.07mi |
| 3418 Carolina Ave Unit A Richmond, VA | 2.0 | 1.0 | 1000 | $1,524 | $1.52 | 43d | 1 | 1.10mi |
| 3909 Patrick Ave Richmond, VA | 3.0 | 1.5 | 1200 | $2,650 | $2.21 | 43d | 1 | 1.10mi |
| 3615 Missouri Ave Richmond, VA | 3.0 | 2.0 | 1758 | $2,150 | $1.22 | 43d | 1 | 1.12mi |
| 3202 1st Ave Richmond, VA | 3.0 | 2.5 | 1440 | $2,062 | $1.43 | 21d | 1 | 1.24mi |
| 3103 Dill Ave Richmond, VA | 3.0 | 1.5 | 1380 | $2,050 | $1.49 | 23d | 1 | 1.28mi |
| 3211 Maryland Ave Richmond, VA | 4.0 | 1.5 | 1344 | $1,871 | $1.39 | 43d | 1 | 1.30mi |
| 3501 Meadowbridge Rd Richmond, VA | 3.0 | 1.0 | 1383 | $1,495 | $1.08 | 20d | 1 | 1.31mi |
| 3501 Meadowbridge Rd Richmond, VA | 3.0 | 1.0 | 1383 | $1,495 | $1.08 | 23d | 1 | 1.31mi |
| 3324 Meadowbridge Rd Richmond, VA | 4.0 | 2.5 | 1667 | $2,175 | $1.30 | 17d | 1 | 1.34mi |
| 3017 Dill Ave Richmond, VA | 4.0 | 2.0 | 1578 | $1,895 | $1.20 | 3d | 1 | 1.35mi |
| 3117 Meadowbridge Rd Richmond, VA | 2.0 | 1.0 | 887 | $1,225 | $1.38 | 43d | 1 | 1.37mi |
| 622 Pollock St Richmond, VA | 3.0 | 1.5 | 1122 | $2,300 | $2.05 | 23d | 1 | 1.38mi |
| 3217 Hunters Mill Dr Richmond, VA | 3.0 | 1.5 | 1178 | $1,975 | $1.68 | 43d | 1 | 1.40mi |
| 3221 Hunters Mill Dr Richmond, VA | 3.0 | 2.0 | 1254 | $1,750 | $1.40 | 3d | 1 | 1.41mi |
| 3231 Hunters Mill Dr Richmond, VA | 2.0 | 1.5 | 1064 | $1,550 | $1.46 | 23d | 1 | 1.42mi |
| 2919 4th Ave #2 Richmond, VA | 2.0 | 2.0 | 950 | $1,287 | $1.35 | 43d | 1 | 1.43mi |
Listing history 11 events
-
2026-06-09days on market $289,950 Active 16 DOM
-
2026-06-08days on market $289,950 Active 15 DOM
-
2026-06-07days on market $289,950 Active 14 DOM
-
2026-06-05pricedays on market $289,950 Active 11 DOM
-
2026-06-03days on market $299,950 Active 10 DOM
-
2026-06-02days on market $299,950 Active 9 DOM
-
2026-06-01days on market $299,950 Active 8 DOM
-
2026-05-31days on market $299,950 Active 7 DOM
-
2026-05-20historical $299,950
-
2026-04-30soldstatus $220,000
-
1999-02-01soldstatus $81,500
ⓘ Source: listings_history table (triggers on properties + properties_extension) + one-shot
backfill from property_details.listing_events for pre-trigger history.
Tax reassessment forecast VA · Resets to sale price
- Current annual tax
- $1,677 · $140/mo
- Projected year-2 tax
- $2,378 · $198/mo
- Expected delta
- +$700/yr (+$58/mo · 41.7%)
ⓘ Screening estimate from a state-policy table — verify with the county assessor before closing.
Climate risk First Street
- Flood 1/10 Low FEMA zone X (unshaded) · 0% chance over 30 yrs
- Wildfire 3/10 Moderate
- Heat 7/10 Severe 7 d/yr ≥105°F today · 17 d/yr by 30 yrs out
- Wind 6/10 Major 27% chance of damaging wind over 30 yrs
- Air quality 2/10 Low 1 unhealthy d/yr today · 3 by 30 yrs out
Nearby sold comps map
Loading sold comps map…
Walkable amenities ~0.75 mi
Loading nearby amenities…
Taxation est. · year 1
- Rental income
- $26,064
- − Mortgage interest
- −$16,242
- − Property taxes
- −$1,677
- − Insurance
- −$1,450
- − Repairs & maintenance
- −$2,085
- − Management
- −$2,085
- − Depreciation
- −$8,435
- Taxable loss
- −$5,910
- Est. tax savings @ 24.0%
- +$1,418
- After-tax cash flow
- $636/yr
For passive investors: Depreciation is non-cash, so a rental often shows a tax loss while cash-flowing — sheltering income. Rental losses are passive: they offset passive income freely, and up to $25,000/yr can offset ordinary (W-2) income if you actively participate and your MAGI is under $100k (phasing out to $0 by $150k); unused losses carry forward. On sale, claimed depreciation is recaptured at up to 25%, and gains may owe capital-gains tax (a 1031 exchange can defer both). Figures are a year-1 estimate at your 24.0% rate — not tax advice; consult a CPA.
Schools (NCES district)
- District
- Henrico County Public School District
- NCES district ID
- 5101890
- Math proficiency
- 49% ▼ -32.00%
- Reading proficiency
- 64% ▼ -12.00%
- Median HH income
- $61,854
- Composite
- 49.25/100
- National rank
- #2031
- State rank
- #68 of 131 in VA
Livability — East Highland Park
- Score
- 72/100
- State rank
- #197
- US rank
- #6099
Category grades
Schools grade is shown separately in the Schools card above.
Census & demographics
- Census place
- East Highland Park, VA
- County
- Richmond City · 178,280 people
- Metro
- Richmond, VA
- Population (ZIP)
- 26,322
- Household income
- $61,345
- Rent vs Own
- Severe rent burden
- 1325.0
Population outlook (Henrico County) Hauer SSP2
- Today (2025)
- 365,885 people
- By 2030
- 384,255 · +5.0%
- By 2040
- 416,688 · +13.9%
- By 2050
- 442,376 · +20.9%
- By 2075
- 488,037 · +33.4%
- By 2100
- 487,430 · +33.2%
Race, ethnicity, and origin ACS 2023
- Neighborhood character
- Predominantly Black (70%)
- Race & ethnicity
- Black 70% White 21% Two or more races 4% Hispanic / Latino 3% Asian 2%
- Common ancestry
- Lithuanian 1% Italian 1% Serbian 1%
- Foreign-born
- 5% · Canada
- Languages at home
- 95% English-only · Spanish 2% Other Indo-European 1%
Political lean MEDSL · Henrico
- 2024 margin
- Strong D (+28.9) · D 63.7% · R 34.8% · Other 1.5%
- 2008→2024 swing
- +16.6pp toward D · 2008: 12.2pp · 2024: 28.9pp
- All cycles
- 2024: D+28.9 2020: D+29.0 2016: D+21.0 2012: D+11.7 2008: D+12.2
Not yet ingested
- Civics
- —
Market trends
- HPI YoY
- ▼ -288.72%
- Current HPI
- 428.4029
- Rent YoY
- ▲ 7.43%
- Metro
- Richmond, VA
- State GDP YoY
- ▲ 2.40%
- F500 in state
- 50
Industry mix (Fortune 500 HQ in VA)
| Industry | F500 HQs | Revenue |
|---|---|---|
| Aerospace / Defense | 4 | $236B |
|
||
| Technology / Defense | 3 | $32B |
|
||
| Financial Services | 2 | $176B |
|
||
| Utilities | 2 | $27B |
|
||
| Insurance | 2 | $25B |
|
||
| Technology | 2 | $15B |
|
||
Price history
+268.0% since first listed3 events — show timeline
- 2026-05-20 Coming Soon $299,950 CVRMLS
- 2026-04-30 Sold (Public Records) $220,000 Public Records
- 1999-02-01 Sold (Public Records) $81,500 Public Records
Property tax history
+4.2%/yrLatest (2025): $1,677 · +3.1% YoY. Source: county tax records.
Cash-flow waterfall
monthlySold comps — $/sqft
last 12 mo · ≤1 miLoading sold comps…