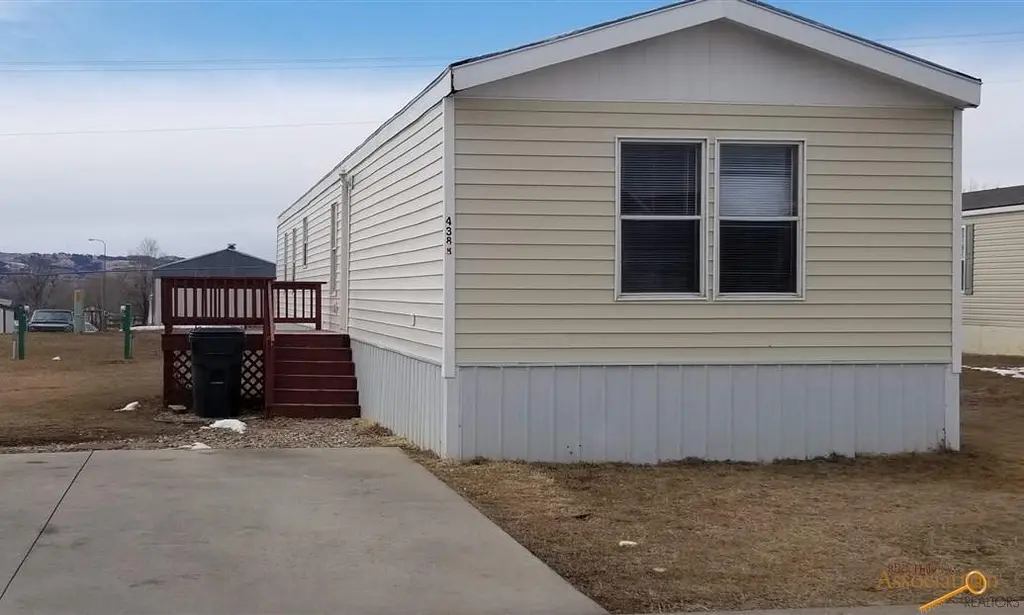
4388 Circlewood Dr · Rapid Valley, SD
Flood risk 1/10 · Minimal
- FEMA flood zone
- X (unshaded)
- Chance of flooding over 30 yrs
- 0.0%
- Est. flood insurance / yr
- $473 – $860
Fire risk 7/10 · Major
- Est. fire insurance / yr
- $1,342 – $2,492
Heat risk 3/10 · Minor
- Hot days now (above 95°F)
- 7 days/yr
- Hot days in 30 yrs
- 16 days/yr
Wind risk 2/10 · Minimal
- Chance of severe wind over 30 yrs
- —
Air-quality risk 3/10 · Minor
- Unhealthy air days now
- 3 days/yr
- Unhealthy air days in 30 yrs
- 3 days/yr
Risk factors via First Street. Map © Google.
Why this score? — see what drove the B grade
The composite is a weighted blend of 9 inputs, each scored 0–100. Each bar is that input's sub-score; the figure is the points it added to the 100-point composite (weight × sub-score).
- Cash flow +30.0/30.0
- 1% rule +10.0/10.0
- DSCR +10.0/10.0
- ARV discount +7.5/15.0
- Rent growth +4.3/5.0
- Schools +3.4/10.0
- Livability +3.2/5.0
- Condition / age +2.5/5.0
- Appreciation +0.0/10.0
$69,900
🖨 Deal sheet 📄 Offer letter ✓ Due diligence
Listing remarks MLS
This 2000 Champion 3 bed 2 bath mobile home in Rapid Valley is on a rented lot. Leave it where it is or move it to a park/parcel of your choice. It features a large kitchen, spacious dining area and living room, and a master suite with walk-in closet. This home has washer/dryer hook-ups in the utility area and multiple upgrades including new master bedroom carpet and a new front door. It has newer vinyl plank flooring, newer hot water heater, newer fridge. Vinyl siding and skirting was replaced 3 years ago. Buyers must be approved by park prior to purchase. Listing agent is related to seller.
Key facts
- New ac unit
- Pop out windows
- New paint
Tags
Neighborhood map
What this means for you Summary
Snapshot
- This is a 3-bed/2.0-bath other listed at $70k.
Deal economics
- At list price, monthly cash flow is $1k ($13k/yr) — positive.
- The deal already cash-flows at list — no discount required.
- Meets the 1% rule at list price ($2k rent vs $70k).
- Cap rate 24.7% vs local median 4.0% in Rapid Valley — top-decile yield for the area; either an underpriced asset or a hidden risk that comps aren't pricing in. Stress-test before assuming the spread holds.
Location & tenants
- Location reads 64/100 on livability (#160 in SD) — a middle-class / working-renter tenant base. Strengths: cost of living A+, housing A+, employment B+; Watch: schools D, amenities F, commute F.
- Rapid City Area School District 51-4 (urban): math 34% / reading 46% proficiency, ranked #50 of 59 in SD (top 85%) — families likely to look elsewhere, expect single-tenant / working-renter base with shorter leases.
- Market conditions: Rents rising fast (+7.3%/yr); 179 active listings in the ZIP; solid renter incomes; 1,181 units permitted in Pennington County in 2024 (715 in 5+ unit buildings).
Forward outlook
- Local home prices are declining (-3.0%/yr); year-one equity from $483 of loan paydown is wiped out by about $2k of value loss. Plan a longer hold.
- Pennington County population projected at +28% by 2050 — long-run rental-demand tailwind backs the buy-and-hold thesis.
- At projected returns (-3.0% appreciation + 7.3% rent growth), your $20k cash investment doubles in ~2 years — after that, you're playing with house money.
Negotiation context
- Only 1 days on market — expect competitive offers; lowballing is unlikely to land.
- Current owner paid $51k; 37% above their basis — modest negotiation headroom, anchor on the comps not their cost.
Risks & watch-outs
- Climate carrying-cost: major wildfire risk — expect insurance premiums to compound above CPI over the hold.
Questions for the listing agent
- Is there a deadline driving the sale (1031 exchange, divorce, estate, relocation)? That informs how much negotiation room exists.
- Schools are D-rated, which usually means shorter tenancies and higher turnover. Who's the typical renter profile here, and what's been the actual vacancy rate?
- What's the average days-on-market for RENTAL listings here right now (not sales)? A rising rental-DOM trend means longer vacancies and softer asking-rent achievability than the comps imply.
- What's the recent tenant-quality profile in this submarket — average credit score on applications, eviction rate, late-payment / NSF rate, and stable-employment percentage? A property-management company in the area should have these aggregated.
- How much new for-sale + rental construction is in the pipeline within 1–3 miles? Heavy new supply typically softens prices + rents 12–24 months out; constrained supply supports both.
Investment metrics
- 1% rule
- 2.72% ✓
- Cap rate
- 24.66%
- Cash-on-cash
- 65.60%
- DSCR
- 3.92
- GRM
- 3.1
CMA / ARV
No comps found within radius.
Projected returns pro-forma
-3.0% appreciation · 7.27% rent growth · sell at horizon
- IRR
- 69.4%
- Equity multiple
- 4.34×
- Total profit
- $65,345
- Equity at exit
- $10,422
- IRR
- 74.8%
- Equity multiple
- 10.34×
- Total profit
- $182,874
- Equity at exit
- $6,044
Cash invested: $19,572 (down + closing). Projections, not guarantees.
Landlord ↔ Tenant lean methodology
- Overall (STATE)
- 83 Strongly Landlord-Friendly
- State South Dakota
- 83 Strongly Landlord-Friendly · R+16
- County
- — inherits STATE
- City
- — inherits STATE
ZIP-level market 57703
- Home prices YoY
- -34.5%
- Rents YoY
- 7.3%
- Active inventory
- 179
- Price-to-rent
- 3.1×
Monthly cashflow live
- Estimated rent
- $1,904 medium interval (Pro) →
- Mortgage (P&I)
- −$367
- Tax from tax record
- −$38 /mo · $461/yr
- Insurance
- −$29
- HOA
- −$0
- Vacancy / Maint / Mgmt
- −$400
- Net cashflow
- $1,070
Break-even live
UW: 25.0% down · 7.5% · 30yr · 1.5% tax · 5.0% vac · 8.0% maint · 8.0% mgmt
Financing live
Cash to close
- Down payment
- $17,475
- Closing costs
- $2,097
- Reserves months
- —
- Total cash needed
- —
Loan-product check · same deal, 3 products live
Conventional
25% down · 7.5% · 30yr
- Down + closing
- —
- Monthly P&I
- —
- Monthly cashflow
- —
- DSCR
- —
- Eligible?
- —
Personal DTI + credit; lowest rate.
DSCR
20% down · 8.5% · 30yr
- Down + closing
- —
- Monthly P&I
- —
- Monthly cashflow
- —
- DSCR
- —
- Eligible?
- —
No personal income docs; deal must DSCR.
Hard money
10% down · 12.0% · 12mo
- Down + closing
- —
- Monthly P&I
- —
- Monthly cashflow
- —
- DSCR
- —
- Eligible?
- —
Short-term bridge; refi at stabilization.
Listing history 2 events
-
2021-04-12soldstatus $51,000 599-char remark
Show marketing remark (599 chars)
This 2000 Champion 3 bed 2 bath mobile home in Rapid Valley is on a rented lot. Leave it where it is or move it to a park/parcel of your choice. It features a large kitchen, spacious dining area and living room, and a master suite with walk-in closet. This home has washer/dryer hook-ups in the utility area and multiple upgrades including new master bedroom carpet and a new front door. It has newer vinyl plank flooring, newer hot water heater, newer fridge. Vinyl siding and skirting was replaced 3 years ago. Buyers must be approved by park prior to purchase. Listing agent is related to seller.
-
2021-02-24$56,900 599-char remark
Show marketing remark (599 chars)
This 2000 Champion 3 bed 2 bath mobile home in Rapid Valley is on a rented lot. Leave it where it is or move it to a park/parcel of your choice. It features a large kitchen, spacious dining area and living room, and a master suite with walk-in closet. This home has washer/dryer hook-ups in the utility area and multiple upgrades including new master bedroom carpet and a new front door. It has newer vinyl plank flooring, newer hot water heater, newer fridge. Vinyl siding and skirting was replaced 3 years ago. Buyers must be approved by park prior to purchase. Listing agent is related to seller.
ⓘ Source: listings_history table (triggers on properties + properties_extension) + one-shot
backfill from property_details.listing_events for pre-trigger history.
Tax reassessment forecast SD · Resets to sale price
- Current annual tax
- $461 · $38/mo
- Projected year-2 tax
- $916 · $76/mo
- Expected delta
- +$454/yr (+$38/mo · 98.5%)
ⓘ Screening estimate from a state-policy table — verify with the county assessor before closing.
Climate risk First Street
- Flood 1/10 Low FEMA zone X (unshaded) · 0% chance over 30 yrs
- Wildfire 7/10 Severe
- Heat 3/10 Moderate 7 d/yr ≥95°F today · 16 d/yr by 30 yrs out
- Wind 2/10 Low
- Air quality 3/10 Moderate 3 unhealthy d/yr today · 3 by 30 yrs out
Nearby sold comps map
Loading sold comps map…
Walkable amenities ~0.75 mi
Loading nearby amenities…
Taxation est. · year 1
- Rental income
- $22,846
- − Mortgage interest
- −$3,915
- − Property taxes
- −$461
- − Insurance
- −$350
- − Repairs & maintenance
- −$1,828
- − Management
- −$1,828
- − Depreciation
- −$2,033
- Taxable income
- $12,431
- Est. tax owed @ 24.0%
- −$2,983
- After-tax cash flow
- $9,855/yr
For passive investors: Depreciation is non-cash, so a rental often shows a tax loss while cash-flowing — sheltering income. Rental losses are passive: they offset passive income freely, and up to $25,000/yr can offset ordinary (W-2) income if you actively participate and your MAGI is under $100k (phasing out to $0 by $150k); unused losses carry forward. On sale, claimed depreciation is recaptured at up to 25%, and gains may owe capital-gains tax (a 1031 exchange can defer both). Figures are a year-1 estimate at your 24.0% rate — not tax advice; consult a CPA.
Schools (NCES district)
- District
- Rapid City Area School District 51-4
- NCES district ID
- 4659820
- Math proficiency
- 34% ▼ -8.00%
- Reading proficiency
- 46% ▼ -4.00%
- Median HH income
- $50,145
- Composite
- 34.47/100
- National rank
- #5189
- State rank
- #50 of 59 in SD
Livability — Rapid Valley
- Score
- 64/100
- State rank
- #160
- US rank
- #13677
Category grades
Schools grade is shown separately in the Schools card above.
Census & demographics
- Census place
- Rapid Valley, SD
- County
- Pennington County · 99,403 people
- Metro
- Rapid City, SD
- Population (ZIP)
- 18,013
- Household income
- $83,739
- Rent vs Own
- Severe rent burden
- 186.0
Population outlook (Pennington County) Hauer SSP2
- Today (2025)
- 125,504 people
- By 2030
- 133,370 · +6.3%
- By 2040
- 147,505 · +17.5%
- By 2050
- 160,507 · +27.9%
- By 2075
- 197,585 · +57.4%
- By 2100
- 241,736 · +92.6%
Race, ethnicity, and origin ACS 2023
- Neighborhood character
- Predominantly White (77%)
- Race & ethnicity
- White 77% Two or more races 10% Native American 7% Hispanic / Latino 6% Asian 1% Black 1%
- Hispanic origin (detail)
- Mexican 4% Puerto Rican 1%
- Common ancestry
- Portuguese 8% Iranian 5% Romanian 3%
- Foreign-born
- 2% · South Korea
- Languages at home
- 96% English-only · Spanish 1% German/W. Germanic 1%
Political lean MEDSL · Pennington
- 2024 margin
- Strong R (+26.4) · D 35.4% · R 61.9% · Other 2.7%
- 2008→2024 swing
- -5.3pp toward R · 2008: -21.2pp · 2024: -26.4pp
- All cycles
- 2024: R+26.4 2020: R+25.1 2016: R+33.0 2012: R+29.5 2008: R+21.2
Not yet ingested
- Civics
- —
Market trends
- HPI YoY
- ▼ -119.50%
- Current HPI
- 226.7266
- Rent YoY
- ▲ 7.27%
- Metro
- Rapid City, SD
- State GDP YoY
- ▲ 0.70%
- F500 in state
- 2
Industry mix (Fortune 500 HQ in SD)
| Industry | F500 HQs | Revenue |
|---|---|---|
| Utilities | 1 | $1B |
|
||
Price history
-10.4% since first listed2 events — show timeline
- 2021-04-12 Sold (MLS) $51,000 BHMLS
- 2021-02-24 Listed $56,900 BHMLS
Property tax history
+0.2%/yrLatest (2025): $461 · -6.0% YoY. Source: county tax records.
Cash-flow waterfall
monthlySold comps — $/sqft
last 12 mo · ≤1 miLoading sold comps…