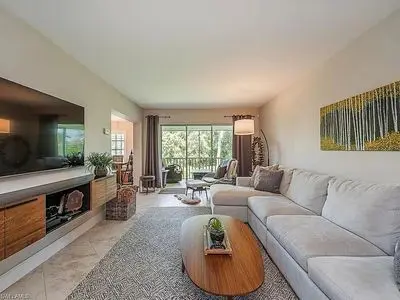
208 Bobolink Way · Naples, FL
Flood risk 6/10 · Moderate
- FEMA flood zone
- X (shaded)
- Chance of flooding over 30 yrs
- 0.53%
- Est. flood insurance / yr
- $507 – $1,088
Fire risk 1/10 · Minimal
- Est. fire insurance / yr
- $947 – $1,759
Heat risk 10/10 · Severe
- Hot days now (above 107°F)
- 7 days/yr
- Hot days in 30 yrs
- 28 days/yr
Wind risk 10/10 · Severe
- Chance of severe wind over 30 yrs
- 99.0%
Air-quality risk 2/10 · Minimal
- Unhealthy air days now
- 2 days/yr
- Unhealthy air days in 30 yrs
- 2 days/yr
Risk factors via First Street. Map © Google.
Why this score? — see what drove the D grade
The composite is a weighted blend of 9 inputs, each scored 0–100. Each bar is that input's sub-score; the figure is the points it added to the 100-point composite (weight × sub-score).
- Cash flow +11.5/30.0
- ARV discount +7.5/15.0
- 1% rule +6.1/10.0
- Schools +5.0/10.0
- Livability +4.0/5.0
- DSCR +3.4/10.0
- Rent growth +2.7/5.0
- Condition / age +1.0/5.0
- Appreciation +0.0/10.0
$378,000
🖨 Deal sheet (PDF) 📄 Offer letter ✓ Due diligence
Listing remarks MLS
This home is in a quiet neighborhood with shopping areas all around. Beautiful, cozy unit. Newly renovated kitchen fully equipped with extra bar sink, and new appliances. New tile throughout living areas and new carpet in bedrooms. Offered turnkey furnished. First floor unit has a nice screen in patio with access to a nice yard. Enjoy the great weather and long walks on the beach just a drive up the road. Downtown Naples is about a 10 minute drive, a pretty area for site seeing and more shopping. Lots of ponds for nice early morning fishing without driving. Naples Bath and Tennis is home to the Sanchez-Casal Tennis Academy and Club which has a clubhouse, many tennis courts, Jr. Olympic size pool, fitness and dining- all there for you to enjoy with private membership. Stop by the clubhouse for more information on club membership.
Key facts
- Pet-friendly
- New carpeting
- Spacious floor plan
Tags
Property features AI
Exterior
- Home design: Built in 1977
- Construction: Living area approximately 1660 square feet
- Exterior features: Located in the Central Naples subdivision
Neighborhood map
What this means for you Summary
Snapshot
- This is a 3-bed/2.0-bath condo listed at $378k. Condition is rated poor.
Deal economics
- At list price, monthly cash flow is $-125 ($-2k/yr) — negative.
- The deal already cash-flows at list — no discount required.
- Meets the 1% rule at list price ($4k rent vs $378k).
Location & tenants
- Location reads 80/100 on livability (#126 in FL, #1,903 nationally) — a professional / high-income tenant draw. Strengths: crime A+, amenities A+, employment A+; Watch: commute D+, cost of living F.
- Collier (suburban): math 60% / reading 56% proficiency, ranked #16 of 73 in FL (top 22%) — acceptable for families but not a draw, mixed tenant base, ~2y average lease.
- Market conditions: Rents flat; 329 active listings in the ZIP; 30 comparable units currently listed for rent nearby; rentals at typical pace (median 22d on market — plan ~3-4 weeks tenant-placement turnaround); solid renter incomes; 3,520 units permitted in Collier County in 2024 (959 in 5+ unit buildings).
- At $4,199/mo this rent would consume 55% of the median local household income ($92k/yr) (locally 780% of renters already pay >50% of income on rent) — very limited rent-growth headroom before tenants either downsize or default.
Forward outlook
- Local home prices are declining (-3.0%/yr); year-one equity from $3k of loan paydown is wiped out by about $11k of value loss. Plan a longer hold.
- Collier County population projected at +30% by 2050 — long-run rental-demand tailwind backs the buy-and-hold thesis.
Negotiation context
- Only 9 days on market — expect competitive offers; lowballing is unlikely to land.
- 2 sale attempts since 13y ago with the ask held roughly flat each time — persistent listings suggest the price (not the market) is what's stuck; bring a comps-based counter.
- Current owner paid $179k; list at $378k implies a 111% gain — meaningful room to come down on a strong offer.
Risks & watch-outs
- Climate carrying-cost: major flood risk; severe wind risk, 99% chance of damaging wind over 30y; extreme-heat days projected 7→28/yr by 2055 (HVAC capex compounding) — expect insurance premiums to compound above CPI over the hold.
Questions for the listing agent
- What do current leases actually rent for vs. the listed asking? Can we see a recent rent roll and the last 12 months of T-12 income?
- Have any recent inspections been done? Can we get a copy of the seller's disclosures and any deferred-maintenance estimates?
- Built in 1977 — when were the roof, HVAC, electrical panel, plumbing, and water heater last replaced?
- What does the HOA fee cover, when was the last increase, and are there any pending special assessments or reserve-fund shortfalls?
- Any open or pending special assessments — roof, HVAC, plumbing, elevator, façade? What's the per-unit balance and payoff schedule, and is the seller paying it off at close or rolling it to the buyer?
- Is there a deadline driving the sale (1031 exchange, divorce, estate, relocation)? That informs how much negotiation room exists.
- Schools are B-rated — typically a magnet for longer-tenancy family renters. What's the average tenant stay here, and is there a school-zone premium baked into asking?
- The area grade is low — what's the realistic commute time and amenity access for the typical tenant pool here? Any planned neighborhood developments (good or bad) we should know about?
- What's the average days-on-market for RENTAL listings here right now (not sales)? A rising rental-DOM trend means longer vacancies and softer asking-rent achievability than the comps imply.
- What's the recent tenant-quality profile in this submarket — average credit score on applications, eviction rate, late-payment / NSF rate, and stable-employment percentage? A property-management company in the area should have these aggregated.
- How much new apartment / multifamily construction is in the pipeline within 1–3 miles? Heavy new supply (>2% of stock underway) typically softens rents 12–24 months out; light construction supports rent growth.
Investment metrics
- 1% rule
- 1.11% ✓
- Cap rate
- 5.90%
- Cash-on-cash
- -1.42%
- DSCR
- 0.94
- GRM
- 7.5
CMA / ARV
No comps found within radius.
Projected returns pro-forma
-3.0% appreciation · 0.85% rent growth · sell at horizon
- IRR
- -21.7%
- Equity multiple
- 0.27×
- Total profit
- $-77,550
- Equity at exit
- $56,361
- IRR
- -23.9%
- Equity multiple
- -0.04×
- Total profit
- $-110,423
- Equity at exit
- $32,683
Cash invested: $105,840 (down + closing). Projections, not guarantees.
Landlord ↔ Tenant lean methodology
- Overall (STATE)
- 87 Strongly Landlord-Friendly
- State Florida
- 87 Strongly Landlord-Friendly · R+3
- County
- — inherits STATE
- City
- — inherits STATE
ZIP-level market 34105
- Home prices YoY
- -30.5%
- Rents YoY
- 0.8%
- Active inventory
- 329
- Price-to-rent
- 7.5×
Monthly cashflow live
- Estimated rent
- $4,199 high interval (Pro) →
- Mortgage (P&I)
- −$1,982
- Tax est. 1.5%
- −$472 /mo · $5,670/yr
- Insurance
- −$158
- HOA est. from 1 same-building comp
- −$830
- Vacancy / Maint / Mgmt
- −$882
- Net cashflow
- $-125
Break-even live
Sensitivity live
| Price | -10% $136 | -5% $5 | +0% $-125 | +5% $-256 | +10% $-387 |
|---|---|---|---|---|---|
| Rent | -10% $-457 | -5% $-291 | +0% $-125 | +5% $41 | +10% $206 |
| Rate | -1.0pp $65 | -0.5pp $-29 | base $-125 | +0.5pp $-223 | +1.0pp $-323 |
UW: 25.0% down · 7.5% · 30yr · 1.5% tax · 5.0% vac · 8.0% maint · 8.0% mgmt
Financing live
Cash to close
- Down payment
- $94,500
- Closing costs
- $11,340
- Reserves months
- —
- Total cash needed
- —
Loan-product check · same deal, 3 products live
Conventional
25% down · 7.5% · 30yr
- Down + closing
- —
- Monthly P&I
- —
- Monthly cashflow
- —
- DSCR
- —
- Eligible?
- —
Personal DTI + credit; lowest rate.
DSCR
20% down · 8.5% · 30yr
- Down + closing
- —
- Monthly P&I
- —
- Monthly cashflow
- —
- DSCR
- —
- Eligible?
- —
No personal income docs; deal must DSCR.
Hard money
10% down · 12.0% · 12mo
- Down + closing
- —
- Monthly P&I
- —
- Monthly cashflow
- —
- DSCR
- —
- Eligible?
- —
Short-term bridge; refi at stabilization.
Rent comps 30 comps
| Address | Beds | Baths | Sqft | Rent | $/sqft | DOM | Units | Dist |
|---|---|---|---|---|---|---|---|---|
| 1350 Misty Pines Cir Unit E-204 Naples, FL | 2.0 | 2.0 | 1200 | $7,500 | $6.25 | 14d | 1 | 0.10mi |
| 500 Misty Pines Cir Unit 2-204 Naples, FL | 2.0 | 2.0 | 1260 | $5,750 | $4.56 | 14d | 1 | 0.17mi |
| 500 Misty Pines Cir #206 Naples, FL | 2.0 | 2.0 | 1260 | $6,000 | $4.76 | 14d | 1 | 0.17mi |
| 1860 Bald Eagle Dr Unit 403B Naples, FL | 2.0 | 2.0 | 1325 | $3,000 | $2.26 | 14d | 1 | 0.27mi |
| 3308 Europa Dr #30 Naples, FL | 2.0 | 2.0 | 1205 | $5,500 | $4.56 | 24d | 1 | 0.28mi |
| 1629 Spoonbill Ln Unit 1629-A Naples, FL | 2.0 | 2.0 | 1250 | $2,000 | $1.60 | 14d | 1 | 0.38mi |
| 1545 Oyster Catcher Pt Unit A Naples, FL | 2.0 | 2.0 | 1124 | $2,200 | $1.96 | 14d | 1 | 0.41mi |
| 5025 Maxwell Cir Unit 2 Naples, FL | 3.0 | 2.0 | 2021 | $3,500 | $1.73 | 14d | 1 | 0.41mi |
| 1554 Oyster Catcher Pt Unit C Naples, FL | 2.0 | 2.0 | 1124 | $2,900 | $2.58 | 24d | 1 | 0.42mi |
| 1044 Woodshire Ln Unit B212 Naples, FL | 3.0 | 2.0 | 1250 | $8,000 | $6.40 | 24d | 1 | 0.48mi |
| 5050 Blauvelt Way Unit 8-102 Naples, FL | 3.0 | 2.0 | 2021 | $3,700 | $1.83 | 24d | 1 | 0.52mi |
| 1085 Forest Lakes Dr Unit 8202 Naples, FL | 2.0 | 2.0 | 1086 | $2,800 | $2.58 | 14d | 1 | 0.87mi |
| 2581 Poinciana St Naples, FL | 3.0 | 2.0 | 1255 | $9,000 | $7.17 | 24d | 1 | 0.94mi |
| 3099 Lancaster Dr Unit 7-701 Naples, FL | 2.0 | 2.0 | 2160 | $10,000 | $4.63 | 24d | 1 | 0.99mi |
| 1614 Forest Lakes Blvd Naples, FL | 3.0 | 2.0 | 1869 | $10,000 | $5.35 | 24d | 1 | 1.00mi |
| 3225 Cypress Glen Way #105 Naples, FL | 2.0 | 2.0 | 1191 | $2,900 | $2.43 | 24d | 1 | 1.01mi |
| 3511 Santiago Way Naples, FL | 4.0 | 2.0 | 1800 | $6,500 | $3.61 | 24d | 1 | 1.03mi |
| 3255 Tamara Dr #4 Naples, FL | 3.0 | 2.5 | 1437 | $2,500 | $1.74 | 14d | 1 | 1.06mi |
| 3105 La Costa Cir Naples, FL | 1.0–3.0 | 1.0–2.0 | 1050 | $2,235 | $2.13 | 14d | 20 | 1.07mi |
| 1719 Camelia Ln Naples, FL | 3.0 | 2.0 | 1534 | $3,900 | $2.54 | 24d | 1 | 1.09mi |
| 3250 Cypress Glen Way Naples, FL | 2.0 | 2.0 | 1242 | $3,300 | $2.66 | 22d | 3 | 1.09mi |
| 3250 Cypress Glen Way Naples, FL | 2.0 | 2.0 | 1191 | $3,488 | $2.93 | 24d | 2 | 1.09mi |
| 3268 Amanda Ln #3 Naples, FL | 3.0 | 2.5 | 1437 | $2,350 | $1.64 | 14d | 1 | 1.12mi |
| 3520 Bolero Way Unit 1325569P Naples, FL | 3.0 | 2.0 | 1399 | $5,021 | $3.59 | 14d | 1 | 1.14mi |
| 3304 Lisa Ln Unit 102 Naples, FL | 2.0 | 2.5 | 1272 | $2,350 | $1.85 | 14d | 1 | 1.19mi |
| 12832 Brynwood Way Naples, FL | 3.0 | 2.0 | 1714 | $5,250 | $3.06 | 14d | 1 | 1.21mi |
| 12902 Brynwood Preserve Ln Naples, FL | 3.0 | 3.0 | 2100 | $7,500 | $3.57 | 24d | 1 | 1.28mi |
| 13078 Pembroke Dr Naples, FL | 3.0 | 2.5 | 2024 | $6,500 | $3.21 | 24d | 1 | 1.29mi |
| 12914 Brynwood Preserve Ln Naples, FL | 2.0 | 2.0 | 1720 | $7,000 | $4.07 | 24d | 1 | 1.31mi |
| 2602 Fountain View Cir Naples, FL | 1.0–2.0 | 1.0–2.0 | 995 | $2,277 | $2.29 | 14d | 41 | 1.50mi |
HOA detail condo
- Monthly dues
- $0 · $0/yr
- Likely covers
- pool
- Assessments
- None detected in remarks — confirm with the listing agent.
Listing history 6 events
-
2026-06-18days on market $378,000 Active 9 DOM
-
2026-06-17days on market $378,000 Active 8 DOM
-
2026-06-16days on market $378,000 Active 7 DOM
-
2026-06-15days on market $378,000 Active 6 DOM
-
2026-06-10remarks 691-char remark
-
2026-06-10$378,000 Active 1 DOM
ⓘ Source: listings_history table (triggers on properties + properties_extension) + one-shot
backfill from property_details.listing_events for pre-trigger history.
Climate risk First Street
- Flood 6/10 Major FEMA zone X (shaded) · 53% chance over 30 yrs
- Wildfire 1/10 Low
- Heat 10/10 Extreme 7 d/yr ≥107°F today · 28 d/yr by 30 yrs out
- Wind 10/10 Extreme 99% chance of damaging wind over 30 yrs
- Air quality 2/10 Low 2 unhealthy d/yr today · 2 by 30 yrs out
Nearby sold comps map
Loading sold comps map…
Walkable amenities ~0.75 mi
Loading nearby amenities…
Taxation est. · year 1
- Rental income
- $50,385
- − Mortgage interest
- −$21,174
- − Property taxes
- −$5,670
- − Insurance
- −$1,890
- − Repairs & maintenance
- −$4,031
- − Management
- −$4,031
- − HOA
- −$9,960
- − Depreciation
- −$10,996
- Taxable loss
- −$7,367
- Est. tax savings @ 24.0%
- +$1,768
- After-tax cash flow
- $265/yr
For passive investors: Depreciation is non-cash, so a rental often shows a tax loss while cash-flowing — sheltering income. Rental losses are passive: they offset passive income freely, and up to $25,000/yr can offset ordinary (W-2) income if you actively participate and your MAGI is under $100k (phasing out to $0 by $150k); unused losses carry forward. On sale, claimed depreciation is recaptured at up to 25%, and gains may owe capital-gains tax (a 1031 exchange can defer both). Figures are a year-1 estimate at your 24.0% rate — not tax advice; consult a CPA.
Condition & rehab AI · 2 photos
This end-unit condo requires extensive repairs and updates to its interior and exterior, including appliances, cabinets, fixtures, flooring, paint, and landscaping. Upgrading these areas would significantly increase its resale and rental value.
Repairs flagged
- Major kitchen appliances — Outdated and non-functional appliances.
- Major kitchen cabinets — Outdated and worn-out cabinets.
- Major bathroom fixtures — Outdated and worn-out fixtures.
- Major flooring — Worn-out carpet in bedrooms.
- Major interior walls/paint — Outdated and worn-out paint and decor.
- Major landscaping — Lack of landscaping and curb appeal.
- Major HVAC system — No visible HVAC system in the attached images, but it may be outdated or non-functional.
- Major exterior siding — No visible exterior or siding in the attached images, but it may be in poor condition.
- Major windows — No visible windows in the attached images, but they may be in poor condition.
- Major foundation/structure — No visible foundation or structure in the attached images, but it may be in poor condition.
Value-add opportunities
- Resale kitchen appliances — Upgrading to modern, energy-efficient appliances would attract buyers.
- Resale kitchen cabinets — Updating the cabinets to a modern style would attract buyers.
- Resale bathroom fixtures — Upgrading to modern, energy-efficient fixtures would attract buyers.
- Resale flooring — Replacing worn-out carpet with modern, durable flooring would attract buyers.
- Resale interior walls/paint — Updating the paint and decor to a modern style would attract buyers.
- Both landscaping — Landscaping and curb appeal improvements would attract buyers and renters.
- Resale HVAC system — Upgrading the HVAC system to modern, energy-efficient equipment would attract buyers.
- Resale exterior siding — Upgrading the exterior siding to a modern style would attract buyers.
- Resale windows — Upgrading the windows to modern, energy-efficient ones would attract buyers.
- Resale foundation/structure — Upgrading the foundation and structure to modern standards would attract buyers.
Renovation cost estimate screening
| Repair item | Severity | Est. cost |
|---|---|---|
| kitchen appliances · Outdated and non-functional appliances. | Major | $15,000–50,000 |
| kitchen cabinets · Outdated and worn-out cabinets. | Major | $15,000–50,000 |
| bathroom fixtures · Outdated and worn-out fixtures. | Major | $15,000–50,000 |
| flooring · Worn-out carpet in bedrooms. | Major | $15,000–50,000 |
| interior walls/paint · Outdated and worn-out paint and decor. | Major | $15,000–50,000 |
| landscaping · Lack of landscaping and curb appeal. | Major | $15,000–50,000 |
| HVAC system · No visible HVAC system in the attached images, but it may be outdated or non-functional. | Major | $15,000–50,000 |
| exterior siding · No visible exterior or siding in the attached images, but it may be in poor condition. | Major | $15,000–50,000 |
| windows · No visible windows in the attached images, but they may be in poor condition. | Major | $15,000–50,000 |
| foundation/structure · No visible foundation or structure in the attached images, but it may be in poor condition. | Major | $15,000–50,000 |
| Total estimated repair cost · 10 items | $150,000–500,000 |
Value-add ROI direction
- Resale kitchen appliances — Upgrading to modern, energy-efficient appliances would attract buyers. ↑
- Resale kitchen cabinets — Updating the cabinets to a modern style would attract buyers. ↑
- Resale bathroom fixtures — Upgrading to modern, energy-efficient fixtures would attract buyers. ↑
- Resale flooring — Replacing worn-out carpet with modern, durable flooring would attract buyers. ↑
- Resale interior walls/paint — Updating the paint and decor to a modern style would attract buyers. ↑
- Both landscaping — Landscaping and curb appeal improvements would attract buyers and renters. ↑
- Resale HVAC system — Upgrading the HVAC system to modern, energy-efficient equipment would attract buyers. ↑
- Resale exterior siding — Upgrading the exterior siding to a modern style would attract buyers. ↑
- Resale windows — Upgrading the windows to modern, energy-efficient ones would attract buyers. ↑
- Resale foundation/structure — Upgrading the foundation and structure to modern standards would attract buyers. ↑
ⓘ Cost ranges are severity-bucket heuristics (US national rule-of-thumb). Get contractor quotes + a written scope before underwriting a rehab budget.
Schools (NCES district)
- District
- Collier
- NCES district ID
- 1200330
- Math proficiency
- 60% ▼ -4.00%
- Reading proficiency
- 56% ▼ -2.00%
- Median HH income
- $58,275
- Composite
- 50.23/100
- National rank
- #1892
- State rank
- #16 of 73 in FL
Livability — Naples
- Score
- 80/100
- State rank
- #126
- US rank
- #1903
Category grades
Schools grade is shown separately in the Schools card above.
Census & demographics
- County
- Collier County · 396,295 people
- City population
- 344,941
- Metro
- Naples-Marco Island, FL
- Population (ZIP)
- 15,441
- Household income
- $92,214
- Rent vs Own
- Severe rent burden
- 780.0
Population outlook (Collier County) Hauer SSP2
- Today (2025)
- 420,858 people
- By 2030
- 450,054 · +6.9%
- By 2040
- 502,232 · +19.3%
- By 2050
- 544,932 · +29.5%
- By 2075
- 627,203 · +49.0%
- By 2100
- 659,015 · +56.6%
Race, ethnicity, and origin ACS 2023
- Neighborhood character
- Predominantly White (79%)
- Race & ethnicity
- White 79% Hispanic / Latino 14% Two or more races 7% Asian 5%
- Hispanic origin (detail)
- Mexican 3% Puerto Rican 1% Cuban 3% Salvadoran 1%
- Common ancestry
- Romanian 3% Lithuanian 3% Italian 3%
- Foreign-born
- 22% · Canada, China, Jamaica
- Languages at home
- 77% English-only · Spanish 11% Other Indo-European 3% Russian/Polish/Slavic 3%
Political lean MEDSL · Collier
- 2024 margin
- Solid R (+33.1) · D 33.1% · R 66.2%
- 2008→2024 swing
- -10.6pp toward R · 2008: -22.5pp · 2024: -33.1pp
- All cycles
- 2024: R+33.1 2020: R+24.7 2016: R+26.0 2012: R+30.1 2008: R+22.5
Not yet ingested
- Civics
- —
Market trends
- HPI YoY
- ▼ -124.65%
- Current HPI
- 283.9084
- Rent YoY
- ▲ 0.85%
- Metro
- Naples-Marco Island, FL
- State GDP YoY
- ▲ 3.28%
- F500 in state
- 36
Industry mix (Fortune 500 HQ in FL)
| Industry | F500 HQs | Revenue |
|---|---|---|
| Industrial Technology | 2 | $29B |
|
||
| Insurance | 2 | $17B |
|
||
| Retail | 1 | $60B |
|
||
| Technology Distribution | 1 | $58B |
|
||
| Homebuilding | 1 | $35B |
|
||
| Technology Manufacturing | 1 | $35B |
|
||
Price history
+111.2% since first listed4 events — show timeline
- 2026-06-10 Listed $378,000 FSBO.com
- 2013-07-31 Price Changed $192,000 NAPLESMLS
- 2013-07-31 Sold (MLS) $179,000 NAPLESMLS
- 2013-06-11 Listed $179,000 NAPLESMLS
Cash-flow waterfall
monthlySold comps — $/sqft
last 12 mo · ≤1 miLoading sold comps…