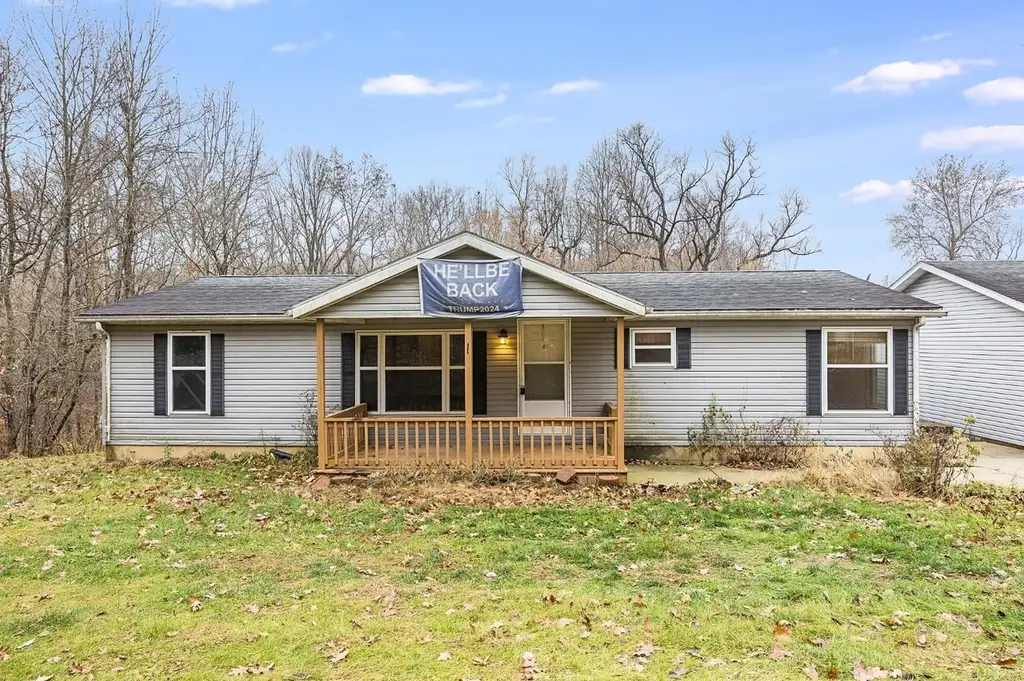
14156 Jim Run Rd · Blooming Grove, IN
Flood risk 1/10 · Minimal
- FEMA flood zone
- X (unshaded)
- Chance of flooding over 30 yrs
- 0.0%
- Est. flood insurance / yr
- $473 – $860
Fire risk 1/10 · Minimal
- Est. fire insurance / yr
- $717 – $1,331
Heat risk 3/10 · Minor
- Hot days now (above 100°F)
- 7 days/yr
- Hot days in 30 yrs
- 19 days/yr
Wind risk 2/10 · Minimal
- Chance of severe wind over 30 yrs
- 1.0%
Air-quality risk 2/10 · Minimal
- Unhealthy air days now
- 1 days/yr
- Unhealthy air days in 30 yrs
- 2 days/yr
Risk factors via First Street. Map © Google.
Why this score? — see what drove the D+ grade
The composite is a weighted blend of 9 inputs, each scored 0–100. Each bar is that input's sub-score; the figure is the points it added to the 100-point composite (weight × sub-score).
- Cash flow +11.0/30.0
- Appreciation +9.0/10.0
- ARV discount +7.5/15.0
- Schools +5.0/10.0
- DSCR +3.2/10.0
- Rent growth +2.5/5.0
- Livability +2.5/5.0
- Condition / age +2.5/5.0
- 1% rule +1.9/10.0
$190,000
🖨 Deal sheet 📄 Offer letter ✓ Due diligence
Listing remarks MLS
FIXER UPPER! 3 bedroom 2 bath with a full basement doublewide on 1.2 acres. House needs paint, carpet, new stairway and deck and pool needs rebuilt. (PLEASE DO NOT WALK ON DECK OR USE BASEMENT STAIRS). House must sell conventional loan or cash, NO USDA OR HUD. Sale is subject to court approval.
Key facts
- 1.2 acre lot
- 2 garage spots
- Pool
Neighborhood map
What this means for you Summary
Snapshot
- This is a 3-bed/2.0-bath manufactured listed at $190k.
Deal economics
- At list price, monthly cash flow is $-80 ($-957/yr) — negative.
- To cash-flow at today's rent, offer at most $176k (7.4% below list).
- To meet the 1% rule (rent ≥ 1% of price), the offer needs to be $131k (31.3% below list).
- Recommended offer: $131k (31.3% below list) — sets the bar for 1% rule.
Location & tenants
- Location reads: area grade D — affects rentability + tenant quality, not the cash-flow math above.
- Market conditions: 58 units permitted in Franklin County in 2024 (0 in 5+ unit buildings).
Forward outlook
- In year one you build about $16k of equity ($1k loan paydown + $15k appreciation (7.9% local appreciation)).
- Franklin County population projected to shrink 10% by 2050 — rents likely to lag national; underwrite the cash flow, not the appreciation.
- At projected returns (7.9% appreciation + 3.0% rent growth), your $53k cash investment doubles in ~4 years — after that, you're playing with house money.
- By year 3, paydown + projected appreciation supports a ~$41k cash-out refi (75% LTV) — recoverable capital for the next deal without selling this one.
Negotiation context
- It's been on market 73 days — a 6% lower offer ($179k) is reasonable based on typical stale-listing flexibility.
- 2 sale attempts; this cycle's ask is 31% above the opening price — seller raised mid-cycle; expect resistance to lowballs.
Risks & watch-outs
- Watch-outs: built in 1900 — expect roof / HVAC / electrical / plumbing capex.
Questions for the listing agent
- What do current leases actually rent for vs. the listed asking? Can we see a recent rent roll and the last 12 months of T-12 income?
- It's been on market 73 days. Have you received any prior offers? Is the seller open to a 31% concession, seller financing, or rate buy-down credit?
- Built in 1900 — when were the roof, HVAC, electrical panel, plumbing, and water heater last replaced?
- Why hasn't it sold? Are there any deal-killer items the seller is aware of (foundation, flood, title, zoning, code violations)?
- Is there a deadline driving the sale (1031 exchange, divorce, estate, relocation)? That informs how much negotiation room exists.
- The area grade is low — what's the realistic commute time and amenity access for the typical tenant pool here? Any planned neighborhood developments (good or bad) we should know about?
- What's the average days-on-market for RENTAL listings here right now (not sales)? A rising rental-DOM trend means longer vacancies and softer asking-rent achievability than the comps imply.
- What's the recent tenant-quality profile in this submarket — average credit score on applications, eviction rate, late-payment / NSF rate, and stable-employment percentage? A property-management company in the area should have these aggregated.
- How much new for-sale + rental construction is in the pipeline within 1–3 miles? Heavy new supply typically softens prices + rents 12–24 months out; constrained supply supports both.
Investment metrics
- 1% rule
- 0.69% ✗
- Cap rate
- 5.79%
- Cash-on-cash
- -1.80%
- DSCR
- 0.92
- GRM
- 12.1
CMA / ARV
- ARV (median comp)
- $396,770
- List price
- $190,000
- Delta
- -52.11%
- Verdict
- UNDERPRICED
- Comps
- 2 within 2.0 mi
Projected returns pro-forma
7.94% appreciation · 3.0% rent growth · sell at horizon
- IRR
- 18.5%
- Equity multiple
- 2.36×
- Total profit
- $72,389
- Equity at exit
- $143,609
- IRR
- 17.4%
- Equity multiple
- 5.01×
- Total profit
- $213,565
- Equity at exit
- $284,361
Cash invested: $53,200 (down + closing). Projections, not guarantees.
Landlord ↔ Tenant lean methodology
- Overall (STATE)
- 90 Strongly Landlord-Friendly
- State Indiana
- 90 Strongly Landlord-Friendly · R+11
- County
- — inherits STATE
- City
- — inherits STATE
ZIP-level market 47024
- Home prices YoY
- 3.2%
- Price-to-rent
- 12.1×
Monthly cashflow live
- Estimated rent
- $1,306 medium interval (Pro) →
- Mortgage (P&I)
- −$996
- Tax from tax record
- −$36 /mo · $430/yr
- Insurance
- −$79
- HOA
- −$0
- Vacancy / Maint / Mgmt
- −$274
- Net cashflow
- $-80
Break-even live
UW: 25.0% down · 7.5% · 30yr · 1.5% tax · 5.0% vac · 8.0% maint · 8.0% mgmt
Financing live
Cash to close
- Down payment
- $47,500
- Closing costs
- $5,700
- Reserves months
- —
- Total cash needed
- —
Loan-product check · same deal, 3 products live
Conventional
25% down · 7.5% · 30yr
- Down + closing
- —
- Monthly P&I
- —
- Monthly cashflow
- —
- DSCR
- —
- Eligible?
- —
Personal DTI + credit; lowest rate.
DSCR
20% down · 8.5% · 30yr
- Down + closing
- —
- Monthly P&I
- —
- Monthly cashflow
- —
- DSCR
- —
- Eligible?
- —
No personal income docs; deal must DSCR.
Hard money
10% down · 12.0% · 12mo
- Down + closing
- —
- Monthly P&I
- —
- Monthly cashflow
- —
- DSCR
- —
- Eligible?
- —
Short-term bridge; refi at stabilization.
Listing history 9 events
-
2026-06-04status $190,000 Pending 73 DOM
-
2026-06-03days on market $190,000 Active 73 DOM
-
2026-06-02days on market $190,000 Active 72 DOM
-
2026-06-01days on market $190,000 Active 71 DOM
-
2026-05-31days on market $190,000 Active 70 DOM
-
2026-03-23status Active 295-char remark
Show marketing remark (295 chars)
FIXER UPPER! 3 bedroom 2 bath with a full basement doublewide on 1.2 acres. House needs paint, carpet, new stairway and deck and pool needs rebuilt. (PLEASE DO NOT WALK ON DECK OR USE BASEMENT STAIRS). House must sell conventional loan or cash, NO USDA OR HUD. Sale is subject to court approval.
-
2026-03-23price $190,000 295-char remark
Show marketing remark (295 chars)
FIXER UPPER! 3 bedroom 2 bath with a full basement doublewide on 1.2 acres. House needs paint, carpet, new stairway and deck and pool needs rebuilt. (PLEASE DO NOT WALK ON DECK OR USE BASEMENT STAIRS). House must sell conventional loan or cash, NO USDA OR HUD. Sale is subject to court approval.
-
2025-11-20status Pending 295-char remark
Show marketing remark (295 chars)
FIXER UPPER! 3 bedroom 2 bath with a full basement doublewide on 1.2 acres. House needs paint, carpet, new stairway and deck and pool needs rebuilt. (PLEASE DO NOT WALK ON DECK OR USE BASEMENT STAIRS). House must sell conventional loan or cash, NO USDA OR HUD. Sale is subject to court approval.
-
2025-11-19$145,000 Active 295-char remark
Show marketing remark (295 chars)
FIXER UPPER! 3 bedroom 2 bath with a full basement doublewide on 1.2 acres. House needs paint, carpet, new stairway and deck and pool needs rebuilt. (PLEASE DO NOT WALK ON DECK OR USE BASEMENT STAIRS). House must sell conventional loan or cash, NO USDA OR HUD. Sale is subject to court approval.
ⓘ Source: listings_history table (triggers on properties + properties_extension) + one-shot
backfill from property_details.listing_events for pre-trigger history.
Tax reassessment forecast IN · Partial reset (capped growth)
- Current annual tax
- $430 · $36/mo
- Projected year-2 tax
- $1,023 · $85/mo
- Expected delta
- +$592/yr (+$49/mo · 137.7%)
ⓘ Screening estimate from a state-policy table — verify with the county assessor before closing.
Climate risk First Street
- Flood 1/10 Low FEMA zone X (unshaded) · 0% chance over 30 yrs
- Wildfire 1/10 Low
- Heat 3/10 Moderate 7 d/yr ≥100°F today · 19 d/yr by 30 yrs out
- Wind 2/10 Low 100% chance of damaging wind over 30 yrs
- Air quality 2/10 Low 1 unhealthy d/yr today · 2 by 30 yrs out
Nearby sold comps map
Loading sold comps map…
Walkable amenities ~0.75 mi
Loading nearby amenities…
Taxation est. · year 1
- Rental income
- $15,670
- − Mortgage interest
- −$10,643
- − Property taxes
- −$430
- − Insurance
- −$950
- − Repairs & maintenance
- −$1,254
- − Management
- −$1,254
- − Depreciation
- −$5,527
- Taxable loss
- −$4,388
- Est. tax savings @ 24.0%
- +$1,053
- After-tax cash flow
- $96/yr
For passive investors: Depreciation is non-cash, so a rental often shows a tax loss while cash-flowing — sheltering income. Rental losses are passive: they offset passive income freely, and up to $25,000/yr can offset ordinary (W-2) income if you actively participate and your MAGI is under $100k (phasing out to $0 by $150k); unused losses carry forward. On sale, claimed depreciation is recaptured at up to 25%, and gains may owe capital-gains tax (a 1031 exchange can defer both). Figures are a year-1 estimate at your 24.0% rate — not tax advice; consult a CPA.
Schools (NCES district)
No district data.
Livability — Blooming Grove
No livability data for this city. (Only ~50 U.S. cities are tracked.)
Census & demographics
- Population (ZIP)
- 2,909
Population outlook (Franklin County) Hauer SSP2
- Today (2025)
- 22,796 people
- By 2030
- 22,556 · -1.1%
- By 2040
- 21,762 · -4.5%
- By 2050
- 20,575 · -9.7%
- By 2075
- 17,810 · -21.9%
- By 2100
- 13,698 · -39.9%
Race, ethnicity, and origin ACS 2023
- Neighborhood character
- Predominantly White (93%)
- Race & ethnicity
- White 93% Two or more races 4% Hispanic / Latino 2%
- Common ancestry
- Slovak 2% Italian 2% Romanian 2%
- Languages at home
- 98% English-only · German/W. Germanic 1%
Political lean MEDSL · Franklin
- 2024 margin
- Solid R (+64.4) · D 17.1% · R 81.5% · Other 1.3%
- 2008→2024 swing
- -30.3pp toward R · 2008: -34.1pp · 2024: -64.4pp
- All cycles
- 2024: R+64.4 2020: R+63.0 2016: R+60.9 2012: R+42.8 2008: R+34.1
Not yet ingested
- Civics
- —
Market trends
- HPI YoY
- ▲ 7.94%
- Current HPI
- 255.8207
- Rent YoY
- —
- Metro
- —
- State GDP YoY
- ▲ 2.90%
- F500 in state
- 18
Industry mix (Fortune 500 HQ in IN)
| Industry | F500 HQs | Revenue |
|---|---|---|
| Industrial Machinery | 2 | $37B |
|
||
| Healthcare | 1 | $177B |
|
||
| Pharmaceuticals | 1 | $45B |
|
||
| Metals / Steel | 1 | $18B |
|
||
| Agriculture | 1 | $17B |
|
||
| Packaging | 1 | $12B |
|
||
Price history
+31.0% since first listed4 events — show timeline
- 2026-03-23 Relisted — SEIBR
- 2026-03-23 Price Changed $190,000 SEIBR
- 2025-11-20 Pending — SEIBR
- 2025-11-19 Listed $145,000 SEIBR
Property tax history
+3.2%/yrLatest (2024): $430 · +2.0% YoY. Source: county tax records.
Cash-flow waterfall
monthlySold comps — $/sqft
last 12 mo · ≤1 miLoading sold comps…