 Duplex
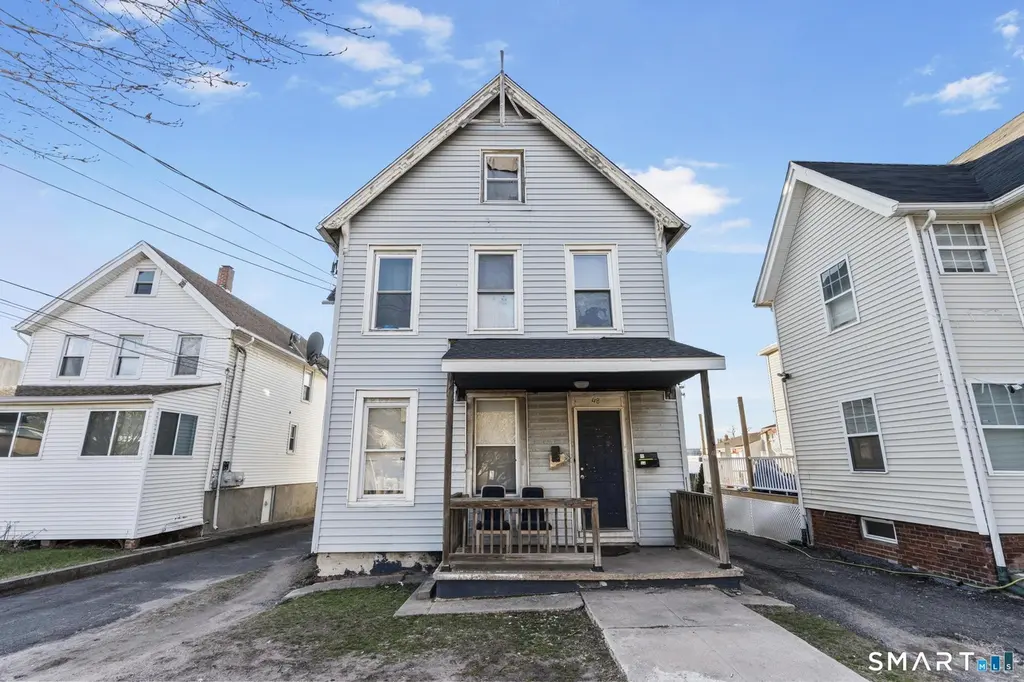
48 Fulton St · New Haven, CT
Flood risk 6/10 · Moderate
- FEMA flood zone
- X (unshaded)
- Chance of flooding over 30 yrs
- 0.54%
- Est. flood insurance / yr
- $473 – $860
Fire risk 1/10 · Minimal
- Est. fire insurance / yr
- $829 – $1,539
Heat risk 7/10 · Major
- Hot days now (above 99°F)
- 7 days/yr
- Hot days in 30 yrs
- 16 days/yr
Wind risk 6/10 · Moderate
- Chance of severe wind over 30 yrs
- 61.0%
Air-quality risk 5/10 · Moderate
- Unhealthy air days now
- 6 days/yr
- Unhealthy air days in 30 yrs
- 8 days/yr
Risk factors via First Street. Map © Google.
Why this score? — see what drove the B- grade
The composite is a weighted blend of 9 inputs, each scored 0–100. Each bar is that input's sub-score; the figure is the points it added to the 100-point composite (weight × sub-score).
- Cash flow +26.5/30.0
- ARV discount +15.0/15.0
- DSCR +9.0/10.0
- 1% rule +7.2/10.0
- Livability +4.0/5.0
- Rent growth +3.5/5.0
- Condition / age +2.5/5.0
- Schools +1.5/10.0
- Appreciation +0.0/10.0
$385,000
🖨 Deal sheet 📄 Offer letter ✓ Due diligence
Multi-family units
County records classify this as Multi-Family (2-4 Unit). Listing-text estimate: 2 units. confirmed
Listing remarks MLS
Two Family offers great Owner Occupied/rental potential for anyone looking to renovate. Second floor has finished attic with 2bedroom. This house would need a total renovation to bring out the value and reap the rewards! Note: First floor heats by oil 2nd floor Gas . This is a short sale final approval is the lien holders . Bring all reasonable Cash offers (preferred) ..
Key facts
- Finished attic
- Two family home
- Split utility setup
Tags
Property features AI
Exterior
- Parking: 3 total parking spaces; Other garage/parking type
- Utilities: Public water connected; Public sewer connected; Hot water: other
- Home design: Multi-family property (2-family)
- Construction: Frame construction; Concrete and masonry foundation; Light blue exterior
- Exterior features: Vinyl siding; Deck
Interior
- Bedrooms: 8 total bedrooms
- Bathrooms: 2 full bathrooms
- Heating & cooling: Hot air heating; Natural gas fuel
- Interior features: 12 total rooms; Partial, unfinished basement
- Laundry & utility: Laundry on lower level with basement hook-ups
Neighborhood map
What this means for you Summary
Snapshot
- This is a 2 × 4.0-bed/1.0-bath units multifamily listed at $385k.
Deal economics
- At list price, monthly cash flow is $1k ($12k/yr) — positive. Per door: $509/mo.
- The deal already cash-flows at list — no discount required.
- Meets the 1% rule at list price ($5k rent vs $385k).
- Recommended offer: $379k (1.5% below list) — sets the bar for market timing.
- Cap rate 9.5% vs local median 4.8% in New Haven — top-decile yield for the area; either an underpriced asset or a hidden risk that comps aren't pricing in. Stress-test before assuming the spread holds.
Location & tenants
- Location reads 79/100 on livability (#31 in CT, #2,190 nationally) — a middle-class / working-renter tenant base. Strengths: amenities A+, commute A+, health & safety A+; Watch: employment D, crime F.
- New Haven School District (urban): math 12% / reading 25% proficiency, ranked #147 of 153 in CT (top 96%) — low school quality limits family demand, transient renter base, plan for 1-2y turnover; 66% free/reduced lunch — lower-income household profile, screen leases tightly.
- Zoned schools: Ross/Woodward School (math 7% / reading 21%, grade F, #481 of 553 statewide, top 87%, 603 students, 77% FRL); Wilbur Cross High School (math 17% / reading 37%, grade F, #147 of 194 statewide, top 78%, 1,633 students, 76% FRL).
- Market conditions: Rents rising fast (+4.1%/yr); 101 active listings in the ZIP; 18 comparable units currently listed for rent nearby; rentals at typical pace (median 21d on market — plan ~3-4 weeks tenant-placement turnaround); 1,059 units permitted in South Central Connecticut Planning Region in 2024 (779 in 5+ unit buildings).
- At $4,707/mo this rent would consume 116% of the median local household income ($48k/yr) (locally 2664% of renters already pay >50% of income on rent) — very limited rent-growth headroom before tenants either downsize or default.
Forward outlook
- Local home prices are declining (-3.0%/yr); year-one equity from $3k of loan paydown is wiped out by about $12k of value loss. Plan a longer hold.
- At projected returns (-3.0% appreciation + 4.1% rent growth), your $108k cash investment doubles in ~9 years — after that, you're playing with house money.
Negotiation context
- It's been on market 25 days — a 2% lower offer ($379k) is reasonable based on typical stale-listing flexibility.
- 2 sale attempts since 10y ago with the ask held roughly flat each time — persistent listings suggest the price (not the market) is what's stuck; bring a comps-based counter.
- Current owner paid $75k; list at $385k implies a 413% gain — meaningful room to come down on a strong offer.
Risks & watch-outs
- Watch-outs: built in 1920 — expect roof / HVAC / electrical / plumbing capex.
- Climate carrying-cost: major flood risk; major wind risk, 61% chance of damaging wind over 30y; extreme-heat days projected 7→16/yr by 2055 (HVAC capex compounding) — expect insurance premiums to compound above CPI over the hold.
Questions for the listing agent
- Can we see the unit-by-unit rent roll, current vacancy, and any below-market leases? What's the average tenancy length?
- What capital expenditures (roof, boiler, parking lot, exteriors) have been made in the last 5 years, and what's planned in the next 2?
- Built in 1920 — when were the roof, HVAC, electrical panel, plumbing, and water heater last replaced?
- Is there a deadline driving the sale (1031 exchange, divorce, estate, relocation)? That informs how much negotiation room exists.
- Schools are D-rated, which usually means shorter tenancies and higher turnover. Who's the typical renter profile here, and what's been the actual vacancy rate?
- Crime grade is F in this area — have there been break-ins, vandalism, or insurance claims at this property in the last 3 years? What carrier currently insures it and at what premium?
- What's the average days-on-market for RENTAL listings here right now (not sales)? A rising rental-DOM trend means longer vacancies and softer asking-rent achievability than the comps imply.
- What's the recent tenant-quality profile in this submarket — average credit score on applications, eviction rate, late-payment / NSF rate, and stable-employment percentage? A property-management company in the area should have these aggregated.
- How much new apartment / multifamily construction is in the pipeline within 1–3 miles? Heavy new supply (>2% of stock underway) typically softens rents 12–24 months out; light construction supports rent growth.
Investment metrics
- 1% rule
- 1.22% ✓
- Cap rate
- 9.46%
- Cash-on-cash
- 11.32%
- DSCR
- 1.50
- GRM
- 6.8
CMA / ARV
- ARV (on-the-fly)
- $466,488
- Comps found
- 4
Show comp detail 4 sales within ~0.75 mi
| Address | Dist | Beds/Ba | Sqft | Sold | Price | $/sf | Match |
|---|---|---|---|---|---|---|---|
| 10 Pardee St | 0.32mi | 4/2.0 (+1) | 2,358 (+0%) | 12mo | $335,000 | $142 | 70 |
| 98 Quinnipiac Ave | 0.23mi | 4/2.0 (+1) | 2,112 (-10%) | 6mo | $417,500 | $198 | 62 |
| 64 Ashland Pl | 0.49mi | 4/4.0 (+1) | 2,400 (+2%) | 1mo | $620,000 | $258 | 60 |
| 175 Fairmont Ave | 0.27mi | 4/2.0 (+1) | 2,110 (-10%) | 12mo | $298,000 | $141 | 55 |
Match score weights: distance 35% · size 25% · config 20% · recency 20%. Top-matched comps best support the ARV.
Projected returns pro-forma
-3.0% appreciation · 4.12% rent growth · sell at horizon
- IRR
- 1.9%
- Equity multiple
- 1.07×
- Total profit
- $7,849
- Equity at exit
- $57,405
- IRR
- 12.6%
- Equity multiple
- 2.05×
- Total profit
- $113,151
- Equity at exit
- $33,288
Cash invested: $107,800 (down + closing). Projections, not guarantees.
Landlord ↔ Tenant lean methodology
- Overall (STATE)
- 27 Tenant-Leaning
- State Connecticut
- 27 Tenant-Leaning · D+7
- County
- — inherits STATE
- City
- — inherits STATE
ZIP-level market 06513
- Home prices YoY
- -7.8%
- Rents YoY
- 4.1%
- Active inventory
- 101
- Price-to-rent
- 13.6×
Monthly cashflow live
- Estimated rent
- $4,707 high interval (Pro) →
- Mortgage (P&I)
- −$2,019
- Tax from tax record
- −$522 /mo · $6,265/yr
- Insurance
- −$160
- HOA
- −$0
- Vacancy / Maint / Mgmt
- −$988
- Net cashflow
- $1,017
Break-even live
2-unit breakdown (identical units grouped — click to expand)
| Units | Beds | Baths | Est. rent |
|---|---|---|---|
| 2× units | 4.0 | 1 | $4,708 |
| #1 | 4.0 | 1 | $2,354 |
| #2 | 4.0 | 1 | $2,354 |
| Total (2 units) | $4,707 | ||
UW: 25.0% down · 7.5% · 30yr · 1.5% tax · 5.0% vac · 8.0% maint · 8.0% mgmt
Financing live
Cash to close
- Down payment
- $96,250
- Closing costs
- $11,550
- Reserves months
- —
- Total cash needed
- —
Loan-product check · same deal, 3 products live
Conventional
25% down · 7.5% · 30yr
- Down + closing
- —
- Monthly P&I
- —
- Monthly cashflow
- —
- DSCR
- —
- Eligible?
- —
Personal DTI + credit; lowest rate.
DSCR
20% down · 8.5% · 30yr
- Down + closing
- —
- Monthly P&I
- —
- Monthly cashflow
- —
- DSCR
- —
- Eligible?
- —
No personal income docs; deal must DSCR.
Hard money
10% down · 12.0% · 12mo
- Down + closing
- —
- Monthly P&I
- —
- Monthly cashflow
- —
- DSCR
- —
- Eligible?
- —
Short-term bridge; refi at stabilization.
Rent comps 18 comps
| Address | Beds | Baths | Sqft | Rent | $/sqft | DOM | Units | Dist |
|---|---|---|---|---|---|---|---|---|
| 115 Lloyd St #2 New Haven, CT | 4.0 | 2.0 | 2100 | $2,500 | $1.19 | 43d | 1 | 0.68mi |
| 39 Houston St Unit 3 New Haven, CT | 2.0 | 1.0 | 2863 | $2,100 | $0.73 | 3d | 1 | 0.71mi |
| 39 Houston St Unit 2 New Haven, CT | 3.0 | 1.0 | 2863 | $2,200 | $0.77 | 43d | 1 | 0.71mi |
| 37 E Pearl St New Haven, CT | 3.0 | 1.0 | 1600 | $2,595 | $1.62 | 43d | 1 | 0.72mi |
| 105 Hillside Ave New Haven, CT | 4.0 | 2.0 | 2080 | $3,500 | $1.68 | 10d | 1 | 0.73mi |
| 342 Exchange St New Haven, CT | 2.0 | 1.0 | 2996 | $1,500 | $0.50 | 43d | 1 | 0.86mi |
| 441 Chapel St Unit 2A1 (shared) New Haven, CT | 4.0 | 4.0 | 2151 | $3,600 | $1.67 | 2d | 1 | 1.02mi |
| 295 Lloyd St Unit 2 New Haven, CT | 4.0 | 2.0 | 2621 | $2,400 | $0.92 | 2d | 1 | 1.07mi |
| 37 Elizabeth Ann Dr New Haven, CT | 2.0 | 1.0 | 1617 | $2,000 | $1.24 | 23d | 1 | 1.07mi |
| 117 Elizabeth Ann Dr New Haven, CT | 2.0 | 1.0 | 2066 | $2,100 | $1.02 | 21d | 1 | 1.09mi |
| 426 Poplar St New Haven, CT | 3.0 | 1.0 | 1658 | $1,800 | $1.09 | 43d | 1 | 1.27mi |
| 607 Chapel St Unit D New Haven, CT | 2.0 | 1.0 | 2075 | $2,450 | $1.18 | 3d | 1 | 1.32mi |
| 114 Kneeland Rd New Haven, CT | 3.0 | 1.0 | 1800 | $2,900 | $1.61 | 43d | 1 | 1.33mi |
| 548 Ferry St Unit 1 New Haven, CT | 2.0 | 1.0 | 1610 | $2,150 | $1.34 | 14d | 1 | 1.36mi |
| 95 Olive St Unit 2 New Haven, CT | 2.0 | 1.0 | 1600 | $2,400 | $1.50 | 3d | 1 | 1.38mi |
| 90 Townsend Ter New Haven, CT | 2.0 | 1.0 | 2015 | $2,500 | $1.24 | 23d | 1 | 1.44mi |
| 90 Townsend Ter New Haven, CT | 2.0 | 1.0 | 2015 | $2,500 | $1.24 | 2d | 1 | 1.44mi |
| 896 Quinnipiac Ave #3 New Haven, CT | 2.0 | 2.0 | 1600 | $2,750 | $1.72 | 2d | 1 | 1.48mi |
Listing history 5 events
-
2026-04-17status Under Contract
-
2026-03-23$385,000 Active
-
2016-09-30soldstatus $75,000 373-char remark
Show marketing remark (373 chars)
Two Family offers great Owner Occupied/rental potential for anyone looking to renovate. Second floor has finished attic with 2bedroom. This house would need a total renovation to bring out the value and reap the rewards! Note: First floor heats by oil 2nd floor Gas . This is a short sale final approval is the lien holders . Bring all reasonable Cash offers (preferred) ..
-
2016-05-20$90,775 373-char remark
Show marketing remark (373 chars)
Two Family offers great Owner Occupied/rental potential for anyone looking to renovate. Second floor has finished attic with 2bedroom. This house would need a total renovation to bring out the value and reap the rewards! Note: First floor heats by oil 2nd floor Gas . This is a short sale final approval is the lien holders . Bring all reasonable Cash offers (preferred) ..
-
1991-10-25soldstatus $130,000
ⓘ Source: listings_history table (triggers on properties + properties_extension) + one-shot
backfill from property_details.listing_events for pre-trigger history.
Tax reassessment forecast CT · Partial reset (capped growth)
- Current annual tax
- $6,265 · $522/mo
- Projected year-2 tax
- $7,252 · $604/mo
- Expected delta
- +$987/yr (+$82/mo · 15.8%)
ⓘ Screening estimate from a state-policy table — verify with the county assessor before closing.
Climate risk First Street
- Flood 6/10 Major FEMA zone X (unshaded) · 54% chance over 30 yrs
- Wildfire 1/10 Low
- Heat 7/10 Severe 7 d/yr ≥99°F today · 16 d/yr by 30 yrs out
- Wind 6/10 Major 61% chance of damaging wind over 30 yrs
- Air quality 5/10 Major 6 unhealthy d/yr today · 8 by 30 yrs out
Nearby sold comps map
Loading sold comps map…
Walkable amenities ~0.75 mi
Loading nearby amenities…
Taxation est. · year 1
- Rental income
- $56,484
- − Mortgage interest
- −$21,566
- − Property taxes
- −$6,265
- − Insurance
- −$1,925
- − Repairs & maintenance
- −$4,519
- − Management
- −$4,519
- − Depreciation
- −$11,200
- Taxable income
- $6,491
- Est. tax owed @ 24.0%
- −$1,558
- After-tax cash flow
- $10,647/yr
For passive investors: Depreciation is non-cash, so a rental often shows a tax loss while cash-flowing — sheltering income. Rental losses are passive: they offset passive income freely, and up to $25,000/yr can offset ordinary (W-2) income if you actively participate and your MAGI is under $100k (phasing out to $0 by $150k); unused losses carry forward. On sale, claimed depreciation is recaptured at up to 25%, and gains may owe capital-gains tax (a 1031 exchange can defer both). Figures are a year-1 estimate at your 24.0% rate — not tax advice; consult a CPA.
Schools (NCES district)
- District
- New Haven School District
- NCES district ID
- 0902790
- Math proficiency
- 12% ▼ -10.00%
- Reading proficiency
- 25% ▼ -10.00%
- Median HH income
- $38,058
- Composite
- 15.48/100
- National rank
- #9308
- State rank
- #147 of 153 in CT
Livability — New Haven
- Score
- 79/100
- State rank
- #31
- US rank
- #2190
Category grades
Schools grade is shown separately in the Schools card above.
Census & demographics
- Census place
- New Haven, CT
- County
- New Haven County · 688,236 people
- City population
- 132,813
- Metro
- New Haven-Milford, CT
- Population (ZIP)
- 38,888
- Household income
- $48,500
- Rent vs Own
- Severe rent burden
- 2664.0
Population outlook (South Central Connecticut County) Hauer SSP2
- By 2040
- 608,362
Race, ethnicity, and origin ACS 2023
- Neighborhood character
- Diverse neighborhood (Simpson 0.66)
- Race & ethnicity
- Hispanic / Latino 47% White 26% Black 22% Two or more races 12% Asian 1%
- Hispanic origin (detail)
- Mexican 7% Puerto Rican 25% Dominican 2%
- Common ancestry
- Romanian 2% Lithuanian 1% Slovak 1%
- Foreign-born
- 17% · Canada, Jamaica, South Korea
- Languages at home
- 56% English-only · Spanish 39% Other Indo-European 1% Russian/Polish/Slavic 1%
Political lean MEDSL · South Central Connecticut
- 2024 margin
- Strong D (+20.1) · D 59.0% · R 38.9% · Other 2.1%
- All cycles
- 2024: D+20.1
Not yet ingested
- Civics
- —
Market trends
- HPI YoY
- ▼ -30.87%
- Current HPI
- 364.006
- Rent YoY
- ▲ 4.12%
- Metro
- New Haven-Milford, CT
- State GDP YoY
- ▲ 1.06%
- F500 in state
- 38
Industry mix (Fortune 500 HQ in CT)
| Industry | F500 HQs | Revenue |
|---|---|---|
| Industrial Machinery | 4 | $38B |
|
||
| Insurance | 3 | $71B |
|
||
| Financial Services | 2 | $25B |
|
||
| Transportation / Logistics | 2 | $18B |
|
||
| Healthcare | 1 | $247B |
|
||
| Telecommunications | 1 | $55B |
|
||
Price history
+196.2% since first listed5 events — show timeline
- 2026-04-17 Pending — Smart MLS
- 2026-03-23 Listed $385,000 Smart MLS
- 2016-09-30 Sold (MLS) $75,000 Smart MLS
- 2016-05-20 Listed $90,775 Smart MLS
- 1991-10-25 Sold (Public Records) $130,000 Public Records
Property tax history
+4.0%/yrLatest (2023): $6,265 · -6.4% YoY. Source: county tax records.
Cash-flow waterfall
monthlySold comps — $/sqft
last 12 mo · ≤1 miLoading sold comps…