 🏷️ Likely Rental
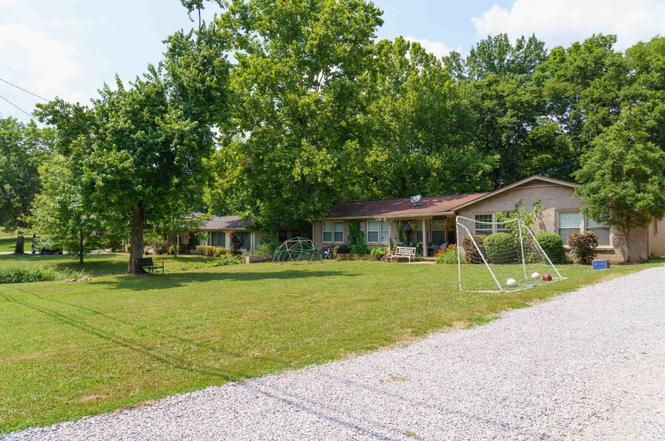
636 Harpeth Bend Dr · Nashville-Davidson metropolitan government (balance), TN
Flood risk 9/10 · Severe
- FEMA flood zone
- X (shaded)
- Chance of flooding over 30 yrs
- 0.99%
- Est. flood insurance / yr
- $507 – $1,088
Fire risk 1/10 · Minimal
- Est. fire insurance / yr
- $949 – $1,763
Heat risk 6/10 · Moderate
- Hot days now (above 106°F)
- 7 days/yr
- Hot days in 30 yrs
- 19 days/yr
Wind risk 4/10 · Minor
- Chance of severe wind over 30 yrs
- 10.0%
Air-quality risk 2/10 · Minimal
- Unhealthy air days now
- 1 days/yr
- Unhealthy air days in 30 yrs
- 2 days/yr
Risk factors via First Street. Map © Google.
Why this score? — see what drove the D+ grade
The composite is a weighted blend of 9 inputs, each scored 0–100. Each bar is that input's sub-score; the figure is the points it added to the 100-point composite (weight × sub-score).
- Cash flow +15.4/30.0
- ARV discount +15.0/15.0
- DSCR +4.7/10.0
- 1% rule +3.9/10.0
- Rent growth +2.9/5.0
- Livability +2.5/5.0
- Condition / age +2.5/5.0
- Schools +1.4/10.0
- Appreciation +0.0/10.0
$390,000
🖨 Deal sheet 📄 Offer letter ✓ Due diligence
Multi-family units
County records classify this as Multi-Family (2-4 Unit). Listing-text estimate: 2 units. confirmed
Listing remarks
Back on the Market !!! This Duplex features 2 Bedrooms, and 1.5 Bathrooms, Appliances, washer/dryer connections, large backyard with privacy fence & deck. The units are tenant occupied, do not disturb tenants. Call the office to discuss details & offers. Excellent tenants with leases that expire 03/31/2026, Current Leases remain in effect and follow the sale.
Key facts
- Large backyard
- Privacy fence
- Deck
Tags
Neighborhood map
What this means for you Summary
Snapshot
- This is a 2 × 2.0-bed/1.5-bath units multifamily listed at $390k.
Deal economics
- At list price, monthly cash flow is $86 ($1k/yr) — positive. Per door: $43/mo.
- The deal already cash-flows at list — no discount required.
- To meet the 1% rule (rent ≥ 1% of price), the offer needs to be $346k (11.3% below list).
- Recommended offer: $343k (12.0% below list) — sets the bar for market timing.
- Cap rate 6.8% vs local median 2.9% in Nashville-Davidson metropolitan government (balance) — top-decile yield for the area; either an underpriced asset or a hidden risk that comps aren't pricing in. Stress-test before assuming the spread holds.
Location & tenants
- Location reads: area grade D — affects rentability + tenant quality, not the cash-flow math above.
- Davidson County (urban): math 12% / reading 19% proficiency, ranked #126 of 139 in TN (top 91%) — low school quality limits family demand, transient renter base, plan for 1-2y turnover; 66% free/reduced lunch — lower-income household profile, screen leases tightly.
- Zoned schools: Harpeth Valley Elementary (math 47% / reading 52%, grade D, #119 of 952 statewide, top 14%, 607 students, 0% FRL); Hillsboro High (math 2% / reading 33%, grade F, #214 of 332 statewide, top 64%, 1,227 students, 0% FRL) — zoned schools average 0% FRL vs 66% district-wide (66 pts lower); this property's tenant base skews higher-income than the district average.
- Zoned-school proficiency averages 34% at this address vs 16% district-wide (+18 pts) — the actual schools serving this property are materially stronger than the Davidson County average implies; a family-tenant draw the district grade alone would hide.
- Market conditions: Rents rising (+1.6%/yr); 352 active listings in the ZIP; solid renter incomes; 6,873 units permitted in Davidson County in 2024 (4,138 in 5+ unit buildings).
Forward outlook
- Local home prices are declining (-3.0%/yr); year-one equity from $3k of loan paydown is wiped out by about $12k of value loss. Plan a longer hold.
- Davidson County population projected at +42% by 2050 — long-run rental-demand tailwind backs the buy-and-hold thesis.
Negotiation context
- It's been on market 175 days — a 12% lower offer ($343k) is reasonable based on typical stale-listing flexibility.
- 10 sale attempts since 16y ago; this cycle's ask has dropped $100k (20%) from the opening price — seller is motivated, your offer sets the floor, not the list.
- Current owner paid $98k; list at $390k implies a 296% gain — meaningful room to come down on a strong offer.
Risks & watch-outs
- Watch-outs: flood insurance adds $66/mo.
- Climate carrying-cost: severe flood risk; extreme-heat days projected 7→19/yr by 2055 (HVAC capex compounding) — expect insurance premiums to compound above CPI over the hold.
Questions for the listing agent
- It's been on market 175 days. Have you received any prior offers? Is the seller open to a 12% concession, seller financing, or rate buy-down credit?
- Can we see the unit-by-unit rent roll, current vacancy, and any below-market leases? What's the average tenancy length?
- What capital expenditures (roof, boiler, parking lot, exteriors) have been made in the last 5 years, and what's planned in the next 2?
- Built in 1965 — when were the roof, HVAC, electrical panel, plumbing, and water heater last replaced?
- What's the actual annual flood-insurance premium (NFIP or private), and is the property in a SFHA with mandatory coverage?
- Why hasn't it sold? Are there any deal-killer items the seller is aware of (foundation, flood, title, zoning, code violations)?
- Is there a deadline driving the sale (1031 exchange, divorce, estate, relocation)? That informs how much negotiation room exists.
- The area grade is low — what's the realistic commute time and amenity access for the typical tenant pool here? Any planned neighborhood developments (good or bad) we should know about?
- What's the average days-on-market for RENTAL listings here right now (not sales)? A rising rental-DOM trend means longer vacancies and softer asking-rent achievability than the comps imply.
- What's the recent tenant-quality profile in this submarket — average credit score on applications, eviction rate, late-payment / NSF rate, and stable-employment percentage? A property-management company in the area should have these aggregated.
- How much new apartment / multifamily construction is in the pipeline within 1–3 miles? Heavy new supply (>2% of stock underway) typically softens rents 12–24 months out; light construction supports rent growth.
Investment metrics
- 1% rule
- 0.89% ✗
- Cap rate
- 6.76%
- Cash-on-cash
- 1.68%
- DSCR
- 1.07
- GRM
- 9.4
CMA / ARV
- ARV (on-the-fly)
- $628,269
- Comps found
- 1
Show comp detail 1 sale within ~0.75 mi
| Address | Dist | Beds/Ba | Sqft | Sold | Price | $/sf | Match |
|---|---|---|---|---|---|---|---|
| 618 Harpeth Bend Dr | 0.15mi | 5/— (-1) | 1,958 (-9%) | 9mo | $570,000 | $291 | 65 |
Match score weights: distance 35% · size 25% · config 20% · recency 20%. Top-matched comps best support the ARV.
Projected returns pro-forma
-3.0% appreciation · 1.64% rent growth · sell at horizon
- IRR
- -16.3%
- Equity multiple
- 0.43×
- Total profit
- $-62,338
- Equity at exit
- $58,150
- IRR
- -10.5%
- Equity multiple
- 0.40×
- Total profit
- $-65,747
- Equity at exit
- $33,720
Cash invested: $109,200 (down + closing). Projections, not guarantees.
Landlord ↔ Tenant lean methodology
- Overall (STATE)
- 87 Strongly Landlord-Friendly
- State Tennessee
- 87 Strongly Landlord-Friendly · R+13
- County
- — inherits STATE
- City
- — inherits STATE
ZIP-level market 37221
- Rents YoY
- 1.6%
- Active inventory
- 352
- Price-to-rent
- 18.8×
Monthly cashflow live
- Estimated rent
- $3,458 high interval (Pro) →
- Mortgage (P&I)
- −$2,045
- Tax from tax record
- −$371 /mo · $4,455/yr
- Insurance
- −$162
- Flood insurance flood zone
- −$66 /mo · $798/yr
- HOA
- −$0
- Vacancy / Maint / Mgmt
- −$726
- Net cashflow
- $86
Break-even live
2-unit breakdown (identical units grouped — click to expand)
| Units | Beds | Baths | Est. rent |
|---|---|---|---|
| 2× units | 2.0 | 1.5 | $3,458 |
| #1 | 2.0 | 1.5 | $1,729 |
| #2 | 2.0 | 1.5 | $1,729 |
| Total (2 units) | $3,458 | ||
UW: 25.0% down · 7.5% · 30yr · 1.5% tax · 5.0% vac · 8.0% maint · 8.0% mgmt
Financing live
Cash to close
- Down payment
- $97,500
- Closing costs
- $11,700
- Reserves months
- —
- Total cash needed
- —
Loan-product check · same deal, 3 products live
Conventional
25% down · 7.5% · 30yr
- Down + closing
- —
- Monthly P&I
- —
- Monthly cashflow
- —
- DSCR
- —
- Eligible?
- —
Personal DTI + credit; lowest rate.
DSCR
20% down · 8.5% · 30yr
- Down + closing
- —
- Monthly P&I
- —
- Monthly cashflow
- —
- DSCR
- —
- Eligible?
- —
No personal income docs; deal must DSCR.
Hard money
10% down · 12.0% · 12mo
- Down + closing
- —
- Monthly P&I
- —
- Monthly cashflow
- —
- DSCR
- —
- Eligible?
- —
Short-term bridge; refi at stabilization.
Listing history 25 events
-
2026-02-06status Pending
-
2026-01-30status Active
-
2025-12-12status Pending
-
2025-12-02price $390,000
-
2025-06-27$490,000 Active
-
2024-11-25historical
-
2024-06-26$535,000 Active
-
2013-12-02historical
-
2013-09-02historical
-
2013-09-02$188,000
-
2013-06-03$188,000
-
2013-06-01historical
-
2013-02-02$188,000
-
2013-02-01historical
-
2012-12-03$195,900
-
2012-12-02historical
-
2012-07-01historical
-
2012-07-01$196,000
-
2012-02-04$196,000
-
2012-01-30historical
-
2010-10-16$196,000
-
2001-06-19soldstatus $98,400
-
1995-06-05soldstatus $68,000
-
1991-10-01soldstatus $65,247
-
1987-08-01soldstatus $45,000
ⓘ Source: listings_history table (triggers on properties + properties_extension) + one-shot
backfill from property_details.listing_events for pre-trigger history.
Tax reassessment forecast TN · Resets to sale price
- Current annual tax
- $4,455 · $371/mo
- Projected year-2 tax
- $4,455 · $371/mo
- Expected delta
- $0/yr ($0/mo · 0.0%)
ⓘ Screening estimate from a state-policy table — verify with the county assessor before closing.
Climate risk First Street
- Flood 9/10 Extreme FEMA zone X (shaded) · 99% chance over 30 yrs
- Wildfire 1/10 Low
- Heat 6/10 Major 7 d/yr ≥106°F today · 19 d/yr by 30 yrs out
- Wind 4/10 Moderate 10% chance of damaging wind over 30 yrs
- Air quality 2/10 Low 1 unhealthy d/yr today · 2 by 30 yrs out
Nearby sold comps map
Loading sold comps map…
Walkable amenities ~0.75 mi
Loading nearby amenities…
Taxation est. · year 1
- Rental income
- $41,496
- − Mortgage interest
- −$21,846
- − Property taxes
- −$4,455
- − Insurance
- −$2,748
- − Repairs & maintenance
- −$3,320
- − Management
- −$3,320
- − Depreciation
- −$11,345
- Taxable loss
- −$5,537
- Est. tax savings @ 24.0%
- +$1,329
- After-tax cash flow
- $2,366/yr
For passive investors: Depreciation is non-cash, so a rental often shows a tax loss while cash-flowing — sheltering income. Rental losses are passive: they offset passive income freely, and up to $25,000/yr can offset ordinary (W-2) income if you actively participate and your MAGI is under $100k (phasing out to $0 by $150k); unused losses carry forward. On sale, claimed depreciation is recaptured at up to 25%, and gains may owe capital-gains tax (a 1031 exchange can defer both). Figures are a year-1 estimate at your 24.0% rate — not tax advice; consult a CPA.
Schools (NCES district)
- District
- Davidson County
- NCES district ID
- 4703180
- Math proficiency
- 12% ▼ -17.00%
- Reading proficiency
- 19% ▼ -7.00%
- Median HH income
- $48,667
- Composite
- 14.03/100
- National rank
- #9472
- State rank
- #126 of 139 in TN
Livability — Nashville-Davidson metropolitan government (balance)
No livability data for this city. (Only ~50 U.S. cities are tracked.)
Census & demographics
- Census place
- Nashville-Davidson metropolitan government (balance), TN
- County
- Davidson County · 680,067 people
- City population
- 677,595
- Metro
- Nashville-Davidson--Murfreesboro--Franklin, TN
- Population (ZIP)
- 41,935
- Household income
- $97,751
- Rent vs Own
- Severe rent burden
- 1353.0
Population outlook (Davidson County) Hauer SSP2
- Today (2025)
- 808,568 people
- By 2030
- 874,489 · +8.2%
- By 2040
- 1,009,046 · +24.8%
- By 2050
- 1,147,294 · +41.9%
- By 2075
- 1,475,439 · +82.5%
- By 2100
- 1,714,101 · +112.0%
Race, ethnicity, and origin ACS 2023
- Neighborhood character
- Predominantly White (79%)
- Race & ethnicity
- White 79% Black 7% Hispanic / Latino 6% Two or more races 6% Asian 4%
- Hispanic origin (detail)
- Mexican 3% Puerto Rican 1%
- Common ancestry
- Lithuanian 3% Serbian 3% Italian 3%
- Foreign-born
- 9% · Canada, China, Vietnam
- Languages at home
- 89% English-only · Spanish 3% Arabic 1% Other Asian/Pacific 1%
Political lean MEDSL · Davidson
- 2024 margin
- Strong D (+27.4) · D 62.7% · R 35.3% · Other 2.0%
- 2008→2024 swing
- +6.5pp toward D · 2008: 21.0pp · 2024: 27.4pp
- All cycles
- 2024: D+27.4 2020: D+32.1 2016: D+26.0 2012: D+18.7 2008: D+21.0
Not yet ingested
- Civics
- —
Market trends
- HPI YoY
- ▼ -221.78%
- Current HPI
- 280.3107
- Rent YoY
- ▲ 1.64%
- Metro
- Nashville-Davidson--Murfreesboro--Franklin, TN
- State GDP YoY
- ▲ 2.78%
- F500 in state
- 22
Industry mix (Fortune 500 HQ in TN)
| Industry | F500 HQs | Revenue |
|---|---|---|
| Healthcare | 3 | $91B |
|
||
| Retail | 3 | $72B |
|
||
| Transportation / Logistics | 1 | $88B |
|
||
| Paper / Packaging | 1 | $19B |
|
||
| Insurance | 1 | $13B |
|
||
| Energy | 1 | $12B |
|
||
Price history
+766.7% since first listed25 events — show timeline
- 2026-02-06 Pending — REALTRACS as Distributed by MLS Grid
- 2026-01-30 Relisted — REALTRACS as Distributed by MLS Grid
- 2025-12-12 Pending — REALTRACS as Distributed by MLS Grid
- 2025-12-02 Price Changed $390,000 REALTRACS as Distributed by MLS Grid
- 2025-06-27 Listed $490,000 REALTRACS as Distributed by MLS Grid
- 2024-11-25 Listing Removed — REALTRACS as Distributed by MLS Grid
- 2024-06-26 Listed $535,000 REALTRACS as Distributed by MLS Grid
- 2013-12-02 Listing Removed — REALTRACS as Distributed by MLS Grid
- 2013-09-02 Listing Removed — REALTRACS as Distributed by MLS Grid
- 2013-09-02 Listed $188,000 REALTRACS as Distributed by MLS Grid
- 2013-06-03 Listed $188,000 REALTRACS as Distributed by MLS Grid
- 2013-06-01 Listing Removed — REALTRACS as Distributed by MLS Grid
- 2013-02-02 Listed $188,000 REALTRACS as Distributed by MLS Grid
- 2013-02-01 Listing Removed — REALTRACS as Distributed by MLS Grid
- 2012-12-03 Listed $195,900 REALTRACS as Distributed by MLS Grid
- 2012-12-02 Listing Removed — REALTRACS as Distributed by MLS Grid
- 2012-07-01 Listing Removed — REALTRACS as Distributed by MLS Grid
- 2012-07-01 Listed $196,000 REALTRACS as Distributed by MLS Grid
- 2012-02-04 Listed $196,000 REALTRACS as Distributed by MLS Grid
- 2012-01-30 Listing Removed — REALTRACS as Distributed by MLS Grid
- 2010-10-16 Listed $196,000 REALTRACS as Distributed by MLS Grid
- 2001-06-19 Sold (Public Records) $98,400 Public Records
- 1995-06-05 Sold (Public Records) $68,000 Public Records
- 1991-10-01 Sold (Public Records) $65,247 Public Records
- 1987-08-01 Sold (Public Records) $45,000 Public Records
Property tax history
+5.3%/yrLatest (2025): $4,455 · +33.9% YoY. Source: county tax records.
Cash-flow waterfall
monthlySold comps — $/sqft
last 12 mo · ≤1 miLoading sold comps…