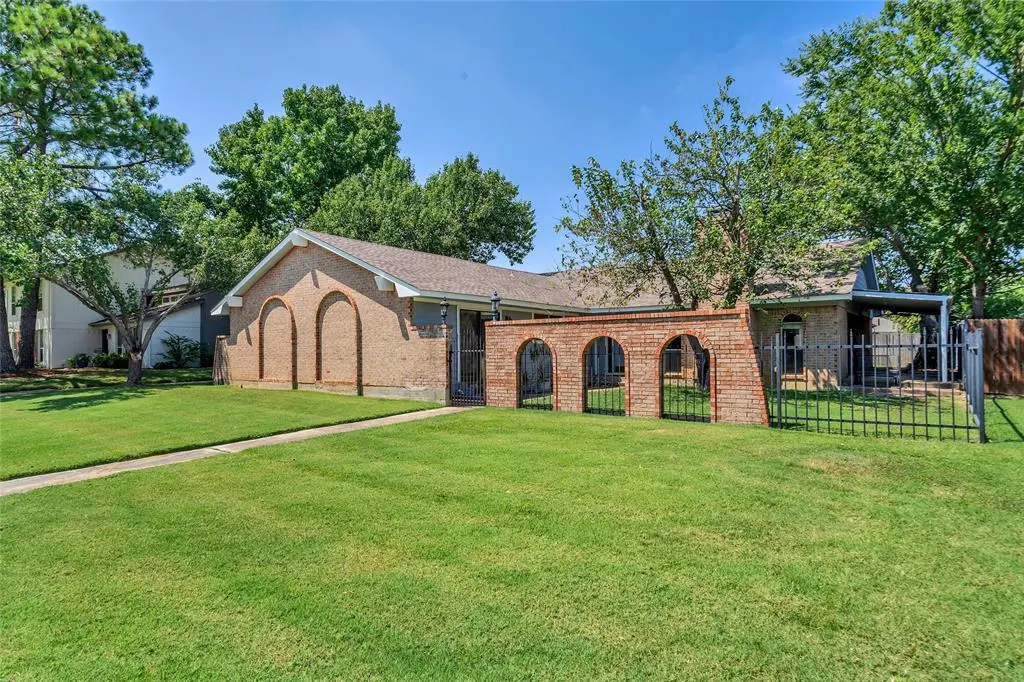
1382 Blue Teal Ct · Southlake, TX
Flood risk 1/10 · Minimal
- FEMA flood zone
- X (unshaded)
- Chance of flooding over 30 yrs
- 0.0%
- Est. flood insurance / yr
- $507 – $1,088
Fire risk 3/10 · Minor
- Est. fire insurance / yr
- $1,222 – $2,270
Heat risk 7/10 · Major
- Hot days now (above 109°F)
- 7 days/yr
- Hot days in 30 yrs
- 24 days/yr
Wind risk 4/10 · Minor
- Chance of severe wind over 30 yrs
- 24.0%
Air-quality risk 3/10 · Minor
- Unhealthy air days now
- 3 days/yr
- Unhealthy air days in 30 yrs
- 4 days/yr
Risk factors via First Street. Map © Google.
Why this score? — see what drove the D grade
The composite is a weighted blend of 9 inputs, each scored 0–100. Each bar is that input's sub-score; the figure is the points it added to the 100-point composite (weight × sub-score).
- Cash flow +12.2/30.0
- Schools +8.3/10.0
- ARV discount +6.1/15.0
- Livability +3.8/5.0
- DSCR +3.6/10.0
- 1% rule +3.4/10.0
- Rent growth +2.5/5.0
- Condition / age +2.5/5.0
- Appreciation +0.0/10.0
$650,000
🖨 Deal sheet (PDF) 📄 Offer letter ✓ Due diligence
Listing remarks MLS
Best-priced opportunity in Southlake under $700K - don't miss this one! Located in an unbeatable setting with walkability to Lake Grapevine, zoned to highly sought-after Carroll Independent School District, and just minutes from Southlake Town Square for premier dining and shopping. Inside, you'll find 4 bedrooms and 2 full baths, with a generously sized primary suite featuring a private en suite and walk-in closet. The standout family room with a soaring vaulted ceiling and a striking fireplace delivers the space and character buyers are looking for. The kitchen includes granite counters, an eat-in area, and a light-filled picture window. Bonus features like the climate-controlled garage and attached workroom-storage offers flexibility for hobbies, projects, or additional storage - features rarely found at this price point. Opportunities like this in Southlake - especially under $700K - are limited!
Key facts
- Private en suite
- Walk-in closet
- Striking fireplace
Tags
Neighborhood map
What this means for you Summary
Snapshot
- This is a 4-bed/2.0-bath single-family listed at $650k.
Deal economics
- At list price, monthly cash flow is $-132 ($-2k/yr) — negative.
- To cash-flow at today's rent, offer at most $627k (3.6% below list).
- To meet the 1% rule (rent ≥ 1% of price), the offer needs to be $544k (16.3% below list).
- Recommended offer: $544k (16.3% below list) — sets the bar for 1% rule.
- Cap rate 6.0% vs local median 1.3% in Southlake — top-decile yield for the area; either an underpriced asset or a hidden risk that comps aren't pricing in. Stress-test before assuming the spread holds.
Location & tenants
- Location reads 76/100 on livability (#107 in TX, #3,547 nationally) — a middle-class / working-renter tenant base. Strengths: crime A+, employment A+, housing A+; Watch: amenities F, commute F, cost of living F.
- Carroll ISD (suburban): math 84% / reading 83% proficiency, ranked #1 of 826 in TX (top 0%) — strong family-tenant draw, lease renewals of 3-5y typical; only 3% free/reduced lunch — higher-income household profile.
- Zoned schools: Jack D Johnson El (math 75% / reading 84%, grade A, #35 of 4,322 statewide, top 1%, 690 students, 0% FRL); Carroll Middle (math 84% / reading 83%, grade A+, #5 of 1,662 statewide, top 0%, 736 students, 0% FRL); Carroll Senior H S (math 100%, 1,444 students, 0% FRL) — zoned schools at 0% FRL track the district average.
- Market conditions: 287 active listings in the ZIP; 7 comparable units currently listed for rent nearby; rentals lingering (median 46d on market — plan ~5-8 weeks vacancy on turnover, expect pricing pressure); 57% of comp listings sitting > 30 days — soft ceiling on asking rent; high-income renter base; 18,938 units permitted in Tarrant County in 2024 (8,336 in 5+ unit buildings).
Forward outlook
- Local home prices are declining (-3.0%/yr); year-one equity from $4k of loan paydown is wiped out by about $20k of value loss. Plan a longer hold.
- Tarrant County population projected at +41% by 2050 — long-run rental-demand tailwind backs the buy-and-hold thesis.
Negotiation context
- It's been on market 79 days — a 6% lower offer ($611k) is reasonable based on typical stale-listing flexibility.
- 3 sale attempts since 2y ago; this cycle's ask has dropped $50k (7%) from the opening price — seller is motivated, your offer sets the floor, not the list.
Risks & watch-outs
- Climate carrying-cost: extreme-heat days projected 7→24/yr by 2055 (HVAC capex compounding) — expect insurance premiums to compound above CPI over the hold.
Questions for the listing agent
- What do current leases actually rent for vs. the listed asking? Can we see a recent rent roll and the last 12 months of T-12 income?
- It's been on market 79 days. Have you received any prior offers? Is the seller open to a 16% concession, seller financing, or rate buy-down credit?
- Built in 1978 — when were the roof, HVAC, electrical panel, plumbing, and water heater last replaced?
- Why hasn't it sold? Are there any deal-killer items the seller is aware of (foundation, flood, title, zoning, code violations)?
- Is there a deadline driving the sale (1031 exchange, divorce, estate, relocation)? That informs how much negotiation room exists.
- Schools are A-rated — typically a magnet for longer-tenancy family renters. What's the average tenant stay here, and is there a school-zone premium baked into asking?
- The area grade is low — what's the realistic commute time and amenity access for the typical tenant pool here? Any planned neighborhood developments (good or bad) we should know about?
- What's the average days-on-market for RENTAL listings here right now (not sales)? A rising rental-DOM trend means longer vacancies and softer asking-rent achievability than the comps imply.
- What's the recent tenant-quality profile in this submarket — average credit score on applications, eviction rate, late-payment / NSF rate, and stable-employment percentage? A property-management company in the area should have these aggregated.
- How much new for-sale + rental construction is in the pipeline within 1–3 miles? Heavy new supply typically softens prices + rents 12–24 months out; constrained supply supports both.
Investment metrics
- 1% rule
- 0.84% ✗
- Cap rate
- 6.05%
- Cash-on-cash
- -0.87%
- DSCR
- 0.96
- GRM
- 10.0
CMA / ARV
- ARV (median comp)
- $630,000
- List price
- $650,000
- Delta
- 3.17%
- Verdict
- FAIR
- Comps
- 20 within 1.0 mi
Show comp detail 10 sales within ~0.75 mi
| Address | Dist | Beds/Ba | Sqft | Sold | Price | $/sf | Match |
|---|---|---|---|---|---|---|---|
| 2901 Flamingo Cir | 0.08mi | 3/2.0 (-1) | 1,963 (-14%) | 3mo | $650,000 | $331 | 65 |
| 3524 Carlton St | 0.32mi | 4/2.0 | 2,248 (-1%) | 22mo | $664,900 | $296 | 65 |
| 2606 N Carroll Ave | 0.39mi | 3/2.0 (-1) | 2,398 (+5%) | 8mo | $1,100,000 | $459 | 61 |
| 3504 Carlton St | 0.38mi | 4/2.0 | 2,487 (+9%) | 8mo | $637,500 | $256 | 61 |
| 2994 Lake Dr | 0.09mi | 3/2.0 (-1) | 2,083 (-9%) | 20mo | $649,999 | $312 | 60 |
| 3001 Flamingo Cir | 0.07mi | 3/2.5 (-1) | 2,068 (-9%) | 20mo | $650,000 | $314 | 58 |
| 3421 Balboa Ct | 0.35mi | 4/3.0 | 2,487 (+9%) | 8mo | $827,000 | $333 | 58 |
| 3512 S Gravel Cir | 0.40mi | 4/3.0 | 2,496 (+10%) | 13mo | $765,000 | $306 | 50 |
| 1590 N Gravel Cir | 0.37mi | 3/2.0 (-1) | 2,503 (+10%) | 18mo | $674,999 | $270 | 46 |
| 3400 Fox Fire | 0.74mi | 3/3.0 (-1) | 2,327 (+2%) | 19mo | $4,250,000 | $1,826 | 37 |
Match score weights: distance 35% · size 25% · config 20% · recency 20%. Top-matched comps best support the ARV.
Projected returns pro-forma
-3.0% appreciation · 3.0% rent growth · sell at horizon
- IRR
- -17.7%
- Equity multiple
- 0.38×
- Total profit
- $-113,671
- Equity at exit
- $96,917
- IRR
- -9.8%
- Equity multiple
- 0.40×
- Total profit
- $-109,604
- Equity at exit
- $56,200
Cash invested: $182,000 (down + closing). Projections, not guarantees.
Landlord ↔ Tenant lean methodology
- Overall (STATE)
- 87 Strongly Landlord-Friendly
- State Texas
- 87 Strongly Landlord-Friendly · R+5
- County
- — inherits STATE
- City
- — inherits STATE
ZIP-level market 76092
- Home prices YoY
- -34.0%
- Active inventory
- 287
- Price-to-rent
- 10.0×
Monthly cashflow live
- Estimated rent
- $5,441 high interval (Pro) →
- Mortgage (P&I)
- −$3,409
- Tax from tax record
- −$750 /mo · $9,005/yr
- Insurance
- −$271
- HOA
- −$0
- Vacancy / Maint / Mgmt
- −$1,143
- Net cashflow
- $-132
Break-even live
Sensitivity live
| Price | -10% $236 | -5% $52 | +0% $-132 | +5% $-316 | +10% $-500 |
|---|---|---|---|---|---|
| Rent | -10% $-562 | -5% $-347 | +0% $-132 | +5% $83 | +10% $298 |
| Rate | -1.0pp $196 | -0.5pp $34 | base $-132 | +0.5pp $-300 | +1.0pp $-471 |
UW: 25.0% down · 7.5% · 30yr · 1.5% tax · 5.0% vac · 8.0% maint · 8.0% mgmt
Financing live
Cash to close
- Down payment
- $162,500
- Closing costs
- $19,500
- Reserves months
- —
- Total cash needed
- —
Loan-product check · same deal, 3 products live
Conventional
25% down · 7.5% · 30yr
- Down + closing
- —
- Monthly P&I
- —
- Monthly cashflow
- —
- DSCR
- —
- Eligible?
- —
Personal DTI + credit; lowest rate.
DSCR
20% down · 8.5% · 30yr
- Down + closing
- —
- Monthly P&I
- —
- Monthly cashflow
- —
- DSCR
- —
- Eligible?
- —
No personal income docs; deal must DSCR.
Hard money
10% down · 12.0% · 12mo
- Down + closing
- —
- Monthly P&I
- —
- Monthly cashflow
- —
- DSCR
- —
- Eligible?
- —
Short-term bridge; refi at stabilization.
Rent comps 7 comps
| Address | Beds | Baths | Sqft | Rent | $/sqft | DOM | Units | Dist |
|---|---|---|---|---|---|---|---|---|
| 2940 Flamingo Cir Southlake, TX | 4.0 | 3.0 | 2584 | $3,300 | $1.28 | 45d | 1 | 0.03mi |
| 1399 Flamingo Cir Southlake, TX | 3.0 | 2.0 | 1870 | $3,295 | $1.76 | 7d | 1 | 0.10mi |
| 3821 Sandlin St Southlake, TX | 4.0 | 2.5 | 2455 | $4,200 | $1.71 | 20d | 1 | 0.28mi |
| 3024 Sweet Briar St Grapevine, TX | 3.0 | 2.0 | 1890 | $3,400 | $1.80 | 45d | 1 | 1.31mi |
| 2937 Sweet Briar St Grapevine, TX | 4.0 | 2.5 | 2438 | $4,300 | $1.76 | 3d | 1 | 1.38mi |
| 500 Brooks Ct Southlake, TX | 3.0 | 2.5 | 1800 | $1,200 | $0.67 | 45d | 1 | 1.44mi |
| 408 Montpelier Dr Southlake, TX | 3.0 | 3.5 | 2929 | $6,200 | $2.12 | 45d | 1 | 1.49mi |
Listing history 24 events
-
2026-06-21days on market $650,000 Active 79 DOM
-
2026-06-18days on market $650,000 Active 76 DOM
-
2026-06-17days on market $650,000 Active 75 DOM
-
2026-06-16days on market $650,000 Active 74 DOM
-
2026-06-15days on market $650,000 Active 73 DOM
-
2026-06-13days on market $650,000 Active 71 DOM
-
2026-06-09days on market $650,000 Active 67 DOM
-
2026-06-08days on market $650,000 Active 66 DOM
-
2026-06-07pricedays on market $650,000 Active 65 DOM
-
2026-06-04days on market $660,000 Active 62 DOM
-
2026-06-03days on market $660,000 Active 61 DOM
-
2026-06-02days on market $660,000 Active 60 DOM
-
2026-06-01days on market $660,000 Active 59 DOM
-
2026-05-31days on market $660,000 Active 58 DOM
-
2026-04-30price $675,000 917-char remark
Show marketing remark (917 chars)
Best-priced opportunity in Southlake under $700K - don't miss this one! Located in an unbeatable setting with walkability to Lake Grapevine, zoned to highly sought-after Carroll Independent School District, and just minutes from Southlake Town Square for premier dining and shopping. Inside, you'll find 4 bedrooms and 2 full baths, with a generously sized primary suite featuring a private en suite and walk-in closet. The standout family room with a soaring vaulted ceiling and a striking fireplace delivers the space and character buyers are looking for. The kitchen includes granite counters, an eat-in area, and a light-filled picture window. Bonus features like the climate-controlled garage and attached workroom-storage offers flexibility for hobbies, projects, or additional storage - features rarely found at this price point. Opportunities like this in Southlake - especially under $700K - are limited!
-
2026-04-03$699,900 Active 917-char remark
Show marketing remark (917 chars)
Best-priced opportunity in Southlake under $700K - don't miss this one! Located in an unbeatable setting with walkability to Lake Grapevine, zoned to highly sought-after Carroll Independent School District, and just minutes from Southlake Town Square for premier dining and shopping. Inside, you'll find 4 bedrooms and 2 full baths, with a generously sized primary suite featuring a private en suite and walk-in closet. The standout family room with a soaring vaulted ceiling and a striking fireplace delivers the space and character buyers are looking for. The kitchen includes granite counters, an eat-in area, and a light-filled picture window. Bonus features like the climate-controlled garage and attached workroom-storage offers flexibility for hobbies, projects, or additional storage - features rarely found at this price point. Opportunities like this in Southlake - especially under $700K - are limited!
-
2024-09-10historical $3,300
-
2024-08-16$3,300
-
2024-08-16historical $3,500
-
2024-07-21price $3,500
-
2024-06-28$4,000
-
2000-02-15soldstatus
-
2000-02-11soldstatus
-
1990-06-01soldstatus
ⓘ Source: listings_history table (triggers on properties + properties_extension) + one-shot
backfill from property_details.listing_events for pre-trigger history.
Tax reassessment forecast TX · Resets to sale price
- Current annual tax
- $9,005 · $750/mo
- Projected year-2 tax
- $11,895 · $991/mo
- Expected delta
- +$2,890/yr (+$241/mo · 32.1%)
ⓘ Screening estimate from a state-policy table — verify with the county assessor before closing.
Climate risk First Street
- Flood 1/10 Low FEMA zone X (unshaded) · 0% chance over 30 yrs
- Wildfire 3/10 Moderate
- Heat 7/10 Severe 7 d/yr ≥109°F today · 24 d/yr by 30 yrs out
- Wind 4/10 Moderate 24% chance of damaging wind over 30 yrs
- Air quality 3/10 Moderate 3 unhealthy d/yr today · 4 by 30 yrs out
Nearby sold comps map
Loading sold comps map…
Walkable amenities ~0.75 mi
Loading nearby amenities…
Taxation est. · year 1
- Rental income
- $65,290
- − Mortgage interest
- −$36,410
- − Property taxes
- −$9,005
- − Insurance
- −$3,250
- − Repairs & maintenance
- −$5,223
- − Management
- −$5,223
- − Depreciation
- −$18,909
- Taxable loss
- −$12,731
- Est. tax savings @ 24.0%
- +$3,055
- After-tax cash flow
- $1,475/yr
For passive investors: Depreciation is non-cash, so a rental often shows a tax loss while cash-flowing — sheltering income. Rental losses are passive: they offset passive income freely, and up to $25,000/yr can offset ordinary (W-2) income if you actively participate and your MAGI is under $100k (phasing out to $0 by $150k); unused losses carry forward. On sale, claimed depreciation is recaptured at up to 25%, and gains may owe capital-gains tax (a 1031 exchange can defer both). Figures are a year-1 estimate at your 24.0% rate — not tax advice; consult a CPA.
Schools (NCES district)
- District
- Carroll ISD
- NCES district ID
- 4813020
- Math proficiency
- 84% ▼ -6.00%
- Reading proficiency
- 83% ▼ -3.00%
- Median HH income
- $176,203
- Composite
- 82.64/100
- National rank
- #21
- State rank
- #1 of 826 in TX
Livability — Southlake
- Score
- 76/100
- State rank
- #107
- US rank
- #3547
Category grades
Schools grade is shown separately in the Schools card above.
Census & demographics
- Census place
- Southlake, TX
- County
- Tarrant County · 2,033,669 people
- City population
- 31,520
- Metro
- Dallas-Fort Worth-Arlington, TX
- Population (ZIP)
- 31,520
- Household income
- $250,001
- Rent vs Own
- Severe rent burden
- 137.0
Population outlook (Tarrant County) Hauer SSP2
- Today (2025)
- 2,380,417 people
- By 2030
- 2,578,900 · +8.3%
- By 2040
- 2,974,995 · +25.0%
- By 2050
- 3,350,489 · +40.8%
- By 2075
- 4,216,909 · +77.2%
- By 2100
- 4,741,527 · +99.2%
Race, ethnicity, and origin ACS 2023
- Neighborhood character
- Predominantly White (69%)
- Race & ethnicity
- White 69% Asian 16% Hispanic / Latino 9% Two or more races 8% Black 2%
- Hispanic origin (detail)
- Mexican 4%
- Common ancestry
- Romanian 3% Slovak 2% Lithuanian 1%
- Foreign-born
- 16% · Canada, China, Vietnam
- Languages at home
- 82% English-only · Spanish 5% Chinese 4% Other Indo-European 3%
Political lean MEDSL · Tarrant
- 2024 margin
- Lean R (+5.1) · D 46.7% · R 51.9% · Other 1.4%
- 2008→2024 swing
- +6.6pp toward D · 2008: -11.7pp · 2024: -5.1pp
- All cycles
- 2024: R+5.1 2020: D+0.2 2016: R+8.7 2012: R+15.7 2008: R+11.7
Not yet ingested
- Civics
- —
Market trends
- HPI YoY
- ▼ -155.85%
- Current HPI
- 302.8677
- Rent YoY
- —
- Metro
- Dallas-Fort Worth-Arlington, TX
- State GDP YoY
- ▲ 3.95%
- F500 in state
- 110
Industry mix (Fortune 500 HQ in TX)
| Industry | F500 HQs | Revenue |
|---|---|---|
| Energy | 16 | $1,198B |
|
||
| Technology | 5 | $198B |
|
||
| Engineering / Construction | 4 | $72B |
|
||
| Energy Services | 3 | $60B |
|
||
| Utilities | 3 | $41B |
|
||
| Healthcare | 2 | $330B |
|
||
Price history
+16775.0% since first listed10 events — show timeline
- 2026-04-30 Price Changed $675,000 NTREIS
- 2026-04-03 Listed $699,900 NTREIS
- 2024-09-10 Rental Removed $3,300 NTREIS
- 2024-08-16 Listed for Rent $3,300 NTREIS
- 2024-08-16 Rental Removed $3,500 NTREIS
- 2024-07-21 Price Changed $3,500 NTREIS
- 2024-06-28 Listed for Rent $4,000 NTREIS
- 2000-02-15 Sold (Public Records) — Public Records
- 2000-02-11 Sold (Public Records) — Public Records
- 1990-06-01 Sold (Public Records) — Public Records
Property tax history
+5.1%/yrLatest (2025): $9,005 · +6.2% YoY. Source: county tax records.
Cash-flow waterfall
monthlySold comps — $/sqft
last 12 mo · ≤1 miLoading sold comps…