 Fourplex
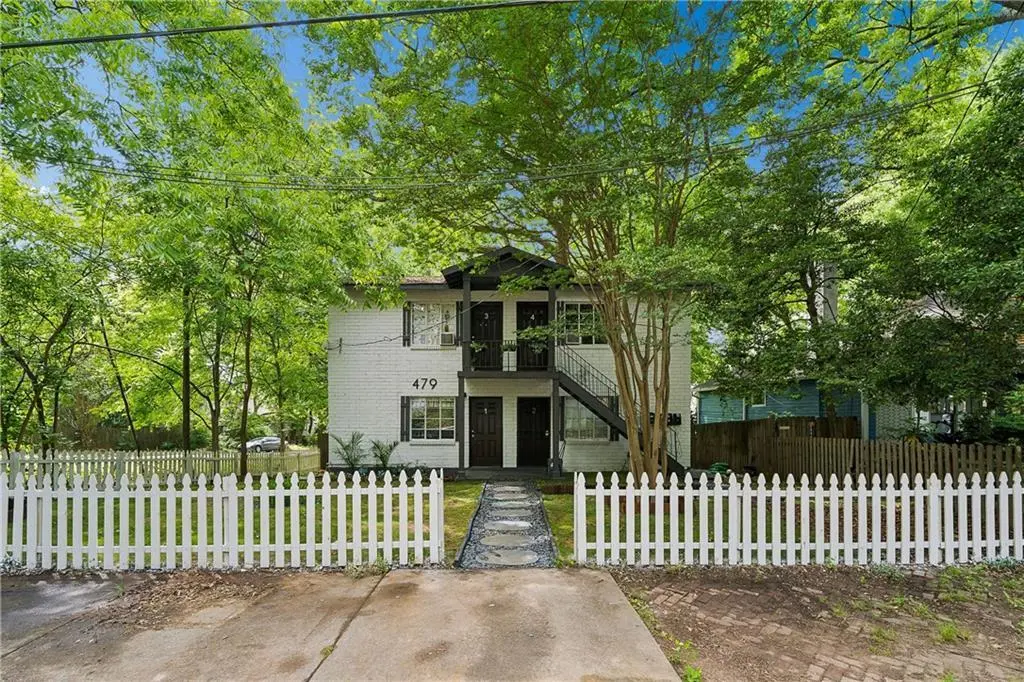
479 Kelly St SE · Atlanta, GA
Flood risk 4/10 · Minor
- FEMA flood zone
- X (unshaded)
- Chance of flooding over 30 yrs
- 0.22%
- Est. flood insurance / yr
- $507 – $1,088
Fire risk 1/10 · Minimal
- Est. fire insurance / yr
- $963 – $1,789
Heat risk 5/10 · Moderate
- Hot days now (above 104°F)
- 6 days/yr
- Hot days in 30 yrs
- 15 days/yr
Wind risk 5/10 · Moderate
- Chance of severe wind over 30 yrs
- 26.0%
Air-quality risk 4/10 · Minor
- Unhealthy air days now
- 4 days/yr
- Unhealthy air days in 30 yrs
- 6 days/yr
Risk factors via First Street. Map © Google.
Why this score? — see what drove the C grade
The composite is a weighted blend of 9 inputs, each scored 0–100. Each bar is that input's sub-score; the figure is the points it added to the 100-point composite (weight × sub-score).
- Cash flow +24.3/30.0
- DSCR +7.8/10.0
- ARV discount +7.5/15.0
- 1% rule +5.2/10.0
- Livability +4.2/5.0
- Rent growth +3.2/5.0
- Schools +2.7/10.0
- Condition / age +2.5/5.0
- Appreciation +0.0/10.0
$1,175,000
🖨 Deal sheet 📄 Offer letter ✓ Due diligence
Multi-family units
County records classify this as Multi-Family (5+ Unit). Listing-text estimate: 4 units. estimate disagrees with records
5+ unit building — per-unit beds/baths from public records are typically unavailable; the breakdown below (if shown) is an estimate from the listing text.
Listing remarks MLS
479 Kelly Street, Atlanta, GA 30316 A rare chance to acquire a stabilized and income-producing quadplex (fourplex) with the ability to build 2 Additional units in the rear. Located near the thriving areas of Grant Park and Summerhill. This property offers a desirable 4 unit mix with excellent rental income and future upside potential. 3 of the 4 unit apartments have happy, reliable, long-term tenants in place. The comfortable, well-maintained apartments and huge off-street parking lot attract quality tenants for this outstanding location that is walking distance to Grant Park and the Beltline. Parking is street parking. Unit 1 is vacant for showings. Please see additional info Sheets in the Docs.
Key facts
- 7,100 sq ft lot
- Built 1961
- Listed 50 days
Tags
Property features AI
Finance
- Other: Some units occupied by tenants; at least one unit vacant; Directions: Use GPS; County: Fulton
- Financial info: 4 total units; Unit rents recorded: $1,350; $1,350; $1,550 (individual unit rents noted); Deposits recorded for units
Exterior
- Parking: See remarks for parking details
- Utilities: Public water; Public sewer; Cable available; Electricity available; Natural gas available; Sewer available; Water available
- Home design: Two-story building; Brick on all sides
- Construction: Composition roof; Brick 4-sides construction
- Exterior features: Back yard with fencing; Fenced property; Near Beltline
Interior
- Kitchen: Some units include refrigerators
- Bedrooms: Four 1-bedroom units
- Flooring: Ceramic tile; Laminate; Hardwood floors in some units
- Bathrooms: Each unit has 1 bathroom
- Heating & cooling: Wall unit heating; Wall unit cooling; Central air in one vacant unit; Window units in several units
- Interior features: Unfurnished; Insulated windows
- Laundry & utility: Maintenance included for all units
Neighborhood map
What this means for you Summary
Snapshot
- This is a 4 × 4-bed/4.0-bath units multifamily listed at $1.18M.
Deal economics
- At list price, monthly cash flow is $2k ($28k/yr) — positive. Per door: $592/mo.
- The deal already cash-flows at list — no discount required.
- Meets the 1% rule at list price ($12k rent vs $1.18M).
- Recommended offer: $1.14M (3.0% below list) — sets the bar for market timing.
- Cap rate 8.7% vs local median 3.1% in Atlanta — top-decile yield for the area; either an underpriced asset or a hidden risk that comps aren't pricing in. Stress-test before assuming the spread holds.
Location & tenants
- Location reads 83/100 on livability (#6 in GA, #919 nationally) — a professional / high-income tenant draw. Strengths: amenities A+, commute A+, housing A+; Watch: cost of living C-.
- Atlanta Public Schools (urban): math 28% / reading 35% proficiency, ranked #80 of 174 in GA (top 46%) — families likely to look elsewhere, expect single-tenant / working-renter base with shorter leases; 71% free/reduced lunch — lower-income household profile, screen leases tightly.
- Zoned schools: Martin L. King Jr. Middle School (math 16% / reading 23%, grade F, #356 of 470 statewide, top 78%, 818 students, 100% FRL); Maynard Jackson High School (math 30% / reading 24%, grade F, #160 of 424 statewide, top 38%, 1,474 students, 44% FRL) — zoned schools at 72% FRL track the district average.
- Market conditions: Rents rising (+2.8%/yr); 237 active listings in the ZIP; 33 comparable units currently listed for rent nearby; rentals leasing fast (median 8d on market — plan ~1-2 weeks tenant-placement turnaround); solid renter incomes; 11,565 units permitted in Fulton County in 2024 (8,159 in 5+ unit buildings).
- At $12,001/mo this rent would consume 174% of the median local household income ($83k/yr) (locally 2010% of renters already pay >50% of income on rent) — very limited rent-growth headroom before tenants either downsize or default.
Forward outlook
- Local home prices are declining (-3.0%/yr); year-one equity from $8k of loan paydown is wiped out by about $35k of value loss. Plan a longer hold.
- Fulton County population projected at +38% by 2050 — long-run rental-demand tailwind backs the buy-and-hold thesis.
Negotiation context
- It's been on market 50 days — a 3% lower offer ($1.14M) is reasonable based on typical stale-listing flexibility.
- 8 sale attempts since 15y ago with the ask held roughly flat each time — persistent listings suggest the price (not the market) is what's stuck; bring a comps-based counter.
- Current owner paid $337k; list at $1.18M implies a 248% gain — meaningful room to come down on a strong offer.
Risks & watch-outs
- Climate carrying-cost: moderate wind risk, 26% chance of damaging wind over 30y; extreme-heat days projected 6→15/yr by 2055 (HVAC capex compounding) — expect insurance premiums to compound above CPI over the hold.
Questions for the listing agent
- It's been on market 50 days. Have you received any prior offers? Is the seller open to a 3% concession, seller financing, or rate buy-down credit?
- Can we see the unit-by-unit rent roll, current vacancy, and any below-market leases? What's the average tenancy length?
- What capital expenditures (roof, boiler, parking lot, exteriors) have been made in the last 5 years, and what's planned in the next 2?
- Built in 1961 — when were the roof, HVAC, electrical panel, plumbing, and water heater last replaced?
- Is there a deadline driving the sale (1031 exchange, divorce, estate, relocation)? That informs how much negotiation room exists.
- What's the average days-on-market for RENTAL listings here right now (not sales)? A rising rental-DOM trend means longer vacancies and softer asking-rent achievability than the comps imply.
- What's the recent tenant-quality profile in this submarket — average credit score on applications, eviction rate, late-payment / NSF rate, and stable-employment percentage? A property-management company in the area should have these aggregated.
- How much new apartment / multifamily construction is in the pipeline within 1–3 miles? Heavy new supply (>2% of stock underway) typically softens rents 12–24 months out; light construction supports rent growth.
Investment metrics
- 1% rule
- 1.02% ✓
- Cap rate
- 8.71%
- Cash-on-cash
- 8.64%
- DSCR
- 1.38
- GRM
- 8.2
CMA / ARV
No comps found within radius.
Projected returns pro-forma
-3.0% appreciation · 2.84% rent growth · sell at horizon
- IRR
- -3.4%
- Equity multiple
- 0.87×
- Total profit
- $-41,858
- Equity at exit
- $175,196
- IRR
- 6.1%
- Equity multiple
- 1.45×
- Total profit
- $148,199
- Equity at exit
- $101,593
Cash invested: $329,000 (down + closing). Projections, not guarantees.
Landlord ↔ Tenant lean methodology
- Overall (STATE)
- 90 Strongly Landlord-Friendly
- State Georgia
- 90 Strongly Landlord-Friendly · R+3
- County
- — inherits STATE
- City
- — inherits STATE
ZIP-level market 30312
- Rents YoY
- 2.8%
- Active inventory
- 237
- Price-to-rent
- 32.6×
Monthly cashflow live
- Estimated rent
- $12,001 high interval (Pro) →
- Mortgage (P&I)
- −$6,162
- Tax from tax record
- −$460 /mo · $5,519/yr
- Insurance
- −$490
- HOA
- −$0
- Vacancy / Maint / Mgmt
- −$2,520
- Net cashflow
- $2,369
Break-even live
4-unit breakdown (identical units grouped — click to expand)
| Units | Beds | Baths | Est. rent |
|---|---|---|---|
| 4× units | 4 | 4 | $12,000 |
| #1 | 4 | 4 | $3,000 |
| #2 | 4 | 4 | $3,000 |
| #3 | 4 | 4 | $3,000 |
| #4 | 4 | 4 | $3,000 |
| Total (4 units) | $12,001 | ||
UW: 25.0% down · 7.5% · 30yr · 1.5% tax · 5.0% vac · 8.0% maint · 8.0% mgmt
Financing live
Cash to close
- Down payment
- $293,750
- Closing costs
- $35,250
- Reserves months
- —
- Total cash needed
- —
Loan-product check · same deal, 3 products live
Conventional
25% down · 7.5% · 30yr
- Down + closing
- —
- Monthly P&I
- —
- Monthly cashflow
- —
- DSCR
- —
- Eligible?
- —
Personal DTI + credit; lowest rate.
DSCR
20% down · 8.5% · 30yr
- Down + closing
- —
- Monthly P&I
- —
- Monthly cashflow
- —
- DSCR
- —
- Eligible?
- —
No personal income docs; deal must DSCR.
Hard money
10% down · 12.0% · 12mo
- Down + closing
- —
- Monthly P&I
- —
- Monthly cashflow
- —
- DSCR
- —
- Eligible?
- —
Short-term bridge; refi at stabilization.
Rent comps 33 comps
| Address | Beds | Baths | Sqft | Rent | $/sqft | DOM | Units | Dist |
|---|---|---|---|---|---|---|---|---|
| 225 Woodward Ave SE Atlanta, GA | 2.0 | 2.0 | 1600 | $2,603 | $1.63 | 24d | 1 | 0.24mi |
| 230 Martin Luther King Jr Dr SE Atlanta, GA | 3.0 | 1.0–3.0 | 979 | $2,000 | $2.04 | 1d | 21 | 0.44mi |
| 565 Hank Aaron Dr SW Atlanta, GA | 1.0–3.0 | 1.0–2.0 | 1139 | $1,583 | $1.39 | 2d | 23 | 0.48mi |
| 679 Arcos Way SE Atlanta, GA | 2.0 | 2.5 | 1500 | $2,650 | $1.77 | 15d | 1 | 0.49mi |
| 197 South Ave SE Apt C Atlanta, GA | 2.0 | 1.0 | 2972 | $2,600 | $0.87 | 24d | 1 | 0.68mi |
| 210 Pryor St SW Atlanta, GA | 1.0 | 1.0 | 1374 | $2,575 | $1.87 | 2d | 2 | 0.81mi |
| 647 Bryan St SE Atlanta, GA | 2.0 | 2.0 | 1500 | $3,500 | $2.33 | 18d | 1 | 0.86mi |
| 171 Auburn Ave NE Atlanta, GA | 1.0–2.0 | 1.0–2.0 | 1080 | $1,295 | $1.20 | 1d | 34 | 0.93mi |
| 730 Glenwood Ave SE Atlanta, GA | 1.0–2.0 | 1.0–2.5 | 1032 | $1,402 | $1.36 | 1d | 16 | 0.99mi |
| 1000 Hill St SE Unit A Atlanta, GA | 2.0 | 1.0 | 1500 | $2,323 | $1.55 | 7d | 1 | 1.03mi |
| 728 Eloise Way SE Atlanta, GA | 2.0 | 2.5 | 1564 | $2,999 | $1.92 | 21d | 1 | 1.06mi |
| 685 Wylie St SE Atlanta, GA | 2.0 | 2.0 | 1434 | $5,200 | $3.63 | 21d | 1 | 1.16mi |
| 45 Boynton Ave SE Atlanta, GA | 2.0–4.0 | 2.5–4.0 | 1452 | $2,568 | $1.77 | 1d | 15 | 1.17mi |
| 133 Estoria St SE Atlanta, GA | 2.0 | 2.5 | 1491 | $6,200 | $4.16 | 24d | 1 | 1.18mi |
| 777 Memorial Dr SE Atlanta, GA | 3.0 | 1.0–2.0 | 1005 | $1,943 | $1.93 | 1d | 22 | 1.19mi |
| 670 DeKalb Ave NE Atlanta, GA | 3.0 | 1.0–2.0 | 1121 | $2,519 | $2.25 | 1d | 35 | 1.19mi |
| 342 Nelson St SW Atlanta, GA | 1.0 | 1.0 | 1461 | $2,522 | $1.73 | 24d | 1 | 1.20mi |
| 400 Pratt Dr SE #1401 Atlanta, GA | 2.0 | 2.0 | 1718 | $2,500 | $1.46 | 24d | 1 | 1.22mi |
| 161 Peachtree Center Ave NE Atlanta, GA | 3.0 | 1.0–3.5 | 1474 | $3,029 | $2.05 | 1d | 27 | 1.22mi |
| 123 Luckie St NW #1503 Atlanta, GA | 2.0 | 2.0 | 1488 | $3,800 | $2.55 | 24d | 1 | 1.25mi |
| 841 Killian St SE Atlanta, GA | 1.0–3.0 | 1.0–2.0 | 1242 | $1,994 | $1.60 | 2d | 6 | 1.26mi |
| 250 Martin Luther King Junior Dr SW Atlanta, GA | 3.0 | 1.0–3.0 | 989 | $3,000 | $3.03 | 1d | 78 | 1.30mi |
| 238 Walker St SW Atlanta, GA | 1.0–2.0 | 1.0–2.5 | 1550 | $1,650 | $1.06 | 13d | 2 | 1.31mi |
| 655 Mead St SE #67 Atlanta, GA | 2.0 | 2.0 | 1500 | $2,295 | $1.53 | 24d | 1 | 1.34mi |
| 375 Highland Ave NE #606 Atlanta, GA | 2.0 | 2.5 | 1478 | $2,800 | $1.89 | 24d | 1 | 1.35mi |
| 250 Piedmont Ave NE Atlanta, GA | 1.0–2.0 | 1.0–2.0 | 1110 | $1,523 | $1.37 | 2d | 20 | 1.35mi |
| 915 Glenwood Ave SE Atlanta, GA | 1.0–2.0 | 1.0–2.0 | 1119 | $1,906 | $1.70 | 1d | 16 | 1.35mi |
| 309 Skylar Ter SE Atlanta, GA | 2.0 | 4.0 | 1573 | $2,600 | $1.65 | 7d | 1 | 1.37mi |
| 1099 Boulevard SE Atlanta, GA | 2.0 | 1.0–2.0 | 928 | $1,766 | $1.90 | 1d | 30 | 1.38mi |
| 807 Field St SE Atlanta, GA | 2.0 | 1.0 | 1690 | $2,600 | $1.54 | 24d | 1 | 1.39mi |
| Mc Gill Park Ave #405 Atlanta, GA | 2.0 | 2.0 | 1458 | $3,000 | $2.06 | 24d | 1 | 1.39mi |
| 920 Memorial Dr SE #22 Atlanta, GA | 2.0 | 2.0 | 2000 | $3,600 | $1.80 | 18d | 1 | 1.43mi |
| 230 Bill Kennedy Way SE Atlanta, GA | 2.0 | 1.0–2.5 | 1062 | $2,372 | $2.23 | 1d | 42 | 1.44mi |
Listing history 36 events
-
2026-06-18days on market $1,175,000 Active 50 DOM
-
2026-06-17days on market $1,175,000 Active 49 DOM
-
2026-06-16days on market $1,175,000 Active 48 DOM
-
2026-06-15days on market $1,175,000 Active 47 DOM
-
2026-06-13days on market $1,175,000 Active 45 DOM
-
2026-06-13days on market $1,175,000 Active 44 DOM
-
2026-06-09days on market $1,175,000 Active 41 DOM
-
2026-06-08days on market $1,175,000 Active 40 DOM
-
2026-06-07days on market $1,175,000 Active 39 DOM
-
2026-06-04days on market $1,175,000 Active 36 DOM
Show marketing remark (710 chars)
479 Kelly Street, Atlanta, GA 30316 A rare chance to acquire a stabilized and income-producing quadplex (fourplex) with the ability to build 2 Additional units in the rear. Located near the thriving areas of Grant Park and Summerhill. This property offers a desirable 4 unit mix with excellent rental income and future upside potential. 3 of the 4 unit apartments have happy, reliable, long-term tenants in place. The comfortable, well-maintained apartments and huge off-street parking lot attract quality tenants for this outstanding location that is walking distance to Grant Park and the Beltline. Parking is street parking. Unit 1 is vacant for showings. Please see additional info Sheets in the Docs.
-
2026-06-03days on market $1,175,000 Active 35 DOM
-
2026-06-02days on market $1,175,000 Active 34 DOM
-
2026-06-01days on market $1,175,000 Active 33 DOM
-
2026-05-31days on market $1,175,000 Active 32 DOM
-
2026-04-29$1,175,000 Active 710-char remark
-
2026-03-04soldstatus $337,300
-
2026-01-08historical
-
2026-01-08historical
-
2025-11-24$895,000 Active
-
2025-11-24$895,000 New
-
2024-12-02historical $895
-
2024-11-27$895
-
2024-11-17historical $895
-
2024-11-01price $895
-
2024-09-05$995
-
2024-08-23historical $995
-
2024-08-13$995
-
2022-11-14historical
-
2011-06-30historical
-
2011-06-23soldstatus $72,118 Sold
-
2011-05-31status Pending
-
2011-05-12$58,410 Active
-
2003-03-14soldstatus $260,000
-
2002-11-06soldstatus $148,300
-
1997-06-10soldstatus $110,000
-
1979-09-26soldstatus $27,000
ⓘ Source: listings_history table (triggers on properties + properties_extension) + one-shot
backfill from property_details.listing_events for pre-trigger history.
Tax reassessment forecast GA · Resets to sale price
- Current annual tax
- $5,519 · $460/mo
- Projected year-2 tax
- $10,810 · $901/mo
- Expected delta
- +$5,291/yr (+$441/mo · 95.9%)
ⓘ Screening estimate from a state-policy table — verify with the county assessor before closing.
Climate risk First Street
- Flood 4/10 Moderate FEMA zone X (unshaded) · 22% chance over 30 yrs
- Wildfire 1/10 Low
- Heat 5/10 Major 6 d/yr ≥104°F today · 15 d/yr by 30 yrs out
- Wind 5/10 Major 26% chance of damaging wind over 30 yrs
- Air quality 4/10 Moderate 4 unhealthy d/yr today · 6 by 30 yrs out
Nearby sold comps map
Loading sold comps map…
Walkable amenities ~0.75 mi
Loading nearby amenities…
Taxation est. · year 1
- Rental income
- $144,012
- − Mortgage interest
- −$65,818
- − Property taxes
- −$5,519
- − Insurance
- −$5,875
- − Repairs & maintenance
- −$11,521
- − Management
- −$11,521
- − Depreciation
- −$34,182
- Taxable income
- $9,576
- Est. tax owed @ 24.0%
- −$2,298
- After-tax cash flow
- $26,135/yr
For passive investors: Depreciation is non-cash, so a rental often shows a tax loss while cash-flowing — sheltering income. Rental losses are passive: they offset passive income freely, and up to $25,000/yr can offset ordinary (W-2) income if you actively participate and your MAGI is under $100k (phasing out to $0 by $150k); unused losses carry forward. On sale, claimed depreciation is recaptured at up to 25%, and gains may owe capital-gains tax (a 1031 exchange can defer both). Figures are a year-1 estimate at your 24.0% rate — not tax advice; consult a CPA.
Schools (NCES district)
- District
- Atlanta Public Schools
- NCES district ID
- 1300120
- Math proficiency
- 28% ▼ -6.00%
- Reading proficiency
- 35% ▼ -2.00%
- Median HH income
- $48,306
- Composite
- 27.27/100
- National rank
- #7006
- State rank
- #80 of 174 in GA
Livability — Atlanta
- Score
- 83/100
- State rank
- #6
- US rank
- #919
Category grades
Schools grade is shown separately in the Schools card above.
Census & demographics
- Census place
- Atlanta, GA
- County
- Fulton County · 1,094,430 people
- City population
- 629,525
- Metro
- Atlanta-Sandy Springs-Alpharetta, GA
- Population (ZIP)
- 26,942
- Household income
- $82,779
- Rent vs Own
- Severe rent burden
- 2010.0
Population outlook (Fulton County) Hauer SSP2
- Today (2025)
- 1,203,707 people
- By 2030
- 1,299,706 · +8.0%
- By 2040
- 1,488,256 · +23.6%
- By 2050
- 1,664,580 · +38.3%
- By 2075
- 2,036,072 · +69.2%
- By 2100
- 2,222,402 · +84.6%
Race, ethnicity, and origin ACS 2023
- Neighborhood character
- Diverse neighborhood (Simpson 0.62)
- Race & ethnicity
- Black 46% White 41% Hispanic / Latino 6% Two or more races 5% Asian 4%
- Hispanic origin (detail)
- Mexican 2%
- Common ancestry
- Romanian 2% Lithuanian 1% Slovak 1%
- Foreign-born
- 9% · Canada
- Languages at home
- 88% English-only · Spanish 5% Other Indo-European 1% Chinese 1%
Political lean MEDSL · Fulton
- 2024 margin
- Solid D (+44.9) · D 71.9% · R 27.0% · Other 1.1%
- 2008→2024 swing
- +9.8pp toward D · 2008: 35.0pp · 2024: 44.9pp
- All cycles
- 2024: D+44.9 2020: D+46.4 2016: D+42.1 2012: D+29.6 2008: D+35.0
Not yet ingested
- Civics
- —
Market trends
- HPI YoY
- ▼ -507.19%
- Current HPI
- 240.8692
- Rent YoY
- ▲ 2.84%
- Metro
- Atlanta-Sandy Springs-Alpharetta, GA
- State GDP YoY
- ▲ 2.66%
- F500 in state
- 28
Industry mix (Fortune 500 HQ in GA)
| Industry | F500 HQs | Revenue |
|---|---|---|
| Paper / Packaging | 2 | $29B |
|
||
| Retail | 1 | $160B |
|
||
| Transportation / Logistics | 1 | $91B |
|
||
| Airlines | 1 | $62B |
|
||
| Consumer Goods | 1 | $47B |
|
||
| Utilities | 1 | $25B |
|
||
Price history
+4251.9% since first listed23 events — show timeline
- 2026-06-04 Listed $1,175,000 GAMLS
- 2026-04-29 Listed $1,175,000 FMLS
- 2026-03-04 Sold (Public Records) $337,300 Public Records
- 2026-01-08 Listing Removed — GAMLS
- 2026-01-08 Listing Removed — FMLS
- 2025-11-24 Listed $895,000 GAMLS
- 2025-11-24 Listed $895,000 FMLS
- 2024-12-02 Rental Removed $895 RENTALBEAST
- 2024-11-27 Listed for Rent $895 RENTALBEAST
- 2024-11-17 Rental Removed $895 RENTALBEAST
- 2024-11-01 Price Changed $895 RENTALBEAST
- 2024-09-05 Listed for Rent $995 RENTALBEAST
- 2024-08-23 Rental Removed $995 RENTALBEAST
- 2024-08-13 Listed for Rent $995 RENTALBEAST
- 2022-11-14 Rental Removed — RENT.
- 2011-06-30 Listing Removed — FMLS
- 2011-06-23 Sold (MLS) $72,118 FMLS
- 2011-05-31 Pending — FMLS
- 2011-05-12 Listed $58,410 FMLS
- 2003-03-14 Sold (Public Records) $260,000 Public Records
- 2002-11-06 Sold (Public Records) $148,300 Public Records
- 1997-06-10 Sold (Public Records) $110,000 Public Records
- 1979-09-26 Sold (Public Records) $27,000 Public Records
Property tax history
+3.2%/yrLatest (2025): $5,519 · +371.4% YoY. Source: county tax records.
Cash-flow waterfall
monthlySold comps — $/sqft
last 12 mo · ≤1 miLoading sold comps…