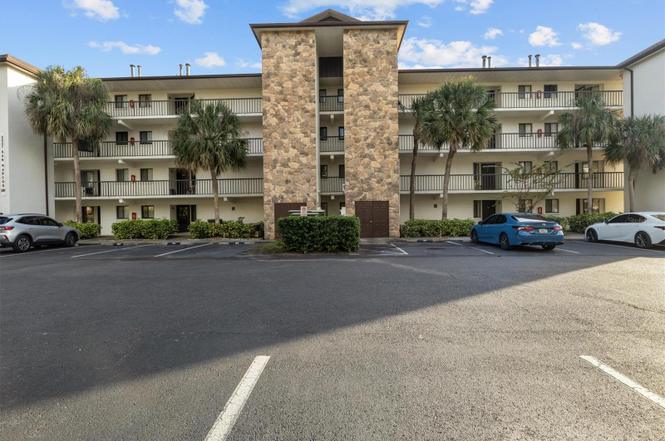
2037 San Marcos Dr SE #217 · Winter Haven, FL
Flood risk 1/10 · Minimal
- FEMA flood zone
- X (unshaded)
- Chance of flooding over 30 yrs
- 0.0%
- Est. flood insurance / yr
- $507 – $1,088
Fire risk 4/10 · Minor
- Est. fire insurance / yr
- $947 – $1,759
Heat risk 8/10 · Major
- Hot days now (above 107°F)
- 7 days/yr
- Hot days in 30 yrs
- 23 days/yr
Wind risk 9/10 · Severe
- Chance of severe wind over 30 yrs
- 99.0%
Air-quality risk 2/10 · Minimal
- Unhealthy air days now
- 0 days/yr
- Unhealthy air days in 30 yrs
- 2 days/yr
Risk factors via First Street. Map © Google.
Why this score? — see what drove the D grade
The composite is a weighted blend of 9 inputs, each scored 0–100. Each bar is that input's sub-score; the figure is the points it added to the 100-point composite (weight × sub-score).
- Cash flow +11.0/30.0
- 1% rule +7.9/10.0
- ARV discount +7.5/15.0
- Livability +3.7/5.0
- Schools +3.5/10.0
- DSCR +3.2/10.0
- Rent growth +3.1/5.0
- Condition / age +2.5/5.0
- Appreciation +0.0/10.0
$109,000
🖨 Deal sheet (PDF) 📄 Offer letter ✓ Due diligence
Listing remarks MLS
condo
Key facts
- Wet bar
- Water heater
- Ceiling fans
Tags
Property features AI
Finance
- Other: Total monthly fees $400; total annual fees $4,800
- HOA & community: Monthly condo/association fee of $400 (includes insurance, structure maintenance, grounds maintenance, and trash); Association name: Cynthia Paul Morales CMH Management; Association fees are required and paid monthly; Community mailbox; Deed restrictions; Pets allowed with limits (number limit, max pet weight ~25 lbs)
Exterior
- Parking: Paved road access
- Utilities: Public water; Public sewer; Cable available; High-speed internet available; Electricity connected
- Home design: Condominium; Residential property; Second-floor unit (floor 2); Faces north; One level living within the unit; Building has 4 stories
- Construction: Stucco construction; Shingle roof; Slab foundation; Built as part of building number 2037
- Exterior features: Sidewalks; Trees/landscaped
Interior
- Kitchen: Disposal; Microwave; Range; Refrigerator; Freezer; Gas water heater
- Bedrooms: 2 bedrooms
- Flooring: Carpet; Tile; Vinyl
- Bathrooms: 2 full bathrooms
- Heating & cooling: Central heating; Central air conditioning
- Interior features: Ceiling fans; Walk-in closet(s); Wet bar; Elevator in building; Inside utility
- Laundry & utility: Washer; Dryer; Laundry closet
Neighborhood map
What this means for you Summary
Snapshot
- This is a 2-bed/2.0-bath condo listed at $109k.
Deal economics
- At list price, monthly cash flow is $-46 ($-556/yr) — negative.
- To cash-flow at today's rent, offer at most $101k (7.5% below list).
- Meets the 1% rule at list price ($1k rent vs $109k).
- Recommended offer: $96k (12.0% below list) — sets the bar for market timing.
Location & tenants
- Location reads 74/100 on livability (#291 in FL, #4,898 nationally) — a middle-class / working-renter tenant base. Strengths: cost of living A+, housing A+, health & safety A; Watch: employment C-, amenities F, commute F.
- Polk (suburban): math 39% / reading 43% proficiency, ranked #62 of 73 in FL (top 85%) — families likely to look elsewhere, expect single-tenant / working-renter base with shorter leases.
- Zoned schools: John Snively Elementary (math 42% / reading 42%, grade F, #1,403 of 2,144 statewide, top 67%, 399 students, 72% FRL); Denison Middle School (math 24% / reading 25%, grade F, #522 of 571 statewide, top 93%, 738 students, 69% FRL); Winter Haven Senior High School (math 26% / reading 38%, grade F, #415 of 667 statewide, top 63%, 2,467 students, 50% FRL) — zoned schools at 64% FRL track the district average.
- Market conditions: Rents rising (+2.5%/yr); 345 active listings in the ZIP; 39 comparable units currently listed for rent nearby; rentals at typical pace (median 21d on market — plan ~3-4 weeks tenant-placement turnaround); 10,384 units permitted in Polk County in 2024 (1,716 in 5+ unit buildings).
Forward outlook
- Local home prices are declining (-3.0%/yr); year-one equity from $754 of loan paydown is wiped out by about $3k of value loss. Plan a longer hold.
- Polk County population projected at +33% by 2050 — long-run rental-demand tailwind backs the buy-and-hold thesis.
Negotiation context
- It's been on market 401 days — a 12% lower offer ($96k) is reasonable based on typical stale-listing flexibility.
- 3 sale attempts since 14y ago; this cycle's ask has dropped $35k (24%) from the opening price — seller is motivated, your offer sets the floor, not the list.
- Current owner paid $40k; list at $109k implies a 169% gain — meaningful room to come down on a strong offer.
Risks & watch-outs
- Watch-outs: HOA is 28% of rent.
- Climate carrying-cost: severe wind risk, 99% chance of damaging wind over 30y; extreme-heat days projected 7→23/yr by 2055 (HVAC capex compounding) — expect insurance premiums to compound above CPI over the hold.
Questions for the listing agent
- What do current leases actually rent for vs. the listed asking? Can we see a recent rent roll and the last 12 months of T-12 income?
- It's been on market 401 days. Have you received any prior offers? Is the seller open to a 12% concession, seller financing, or rate buy-down credit?
- What does the HOA fee cover, when was the last increase, and are there any pending special assessments or reserve-fund shortfalls?
- Any open or pending special assessments — roof, HVAC, plumbing, elevator, façade? What's the per-unit balance and payoff schedule, and is the seller paying it off at close or rolling it to the buyer?
- Why hasn't it sold? Are there any deal-killer items the seller is aware of (foundation, flood, title, zoning, code violations)?
- Is there a deadline driving the sale (1031 exchange, divorce, estate, relocation)? That informs how much negotiation room exists.
- The area grade is low — what's the realistic commute time and amenity access for the typical tenant pool here? Any planned neighborhood developments (good or bad) we should know about?
- What's the average days-on-market for RENTAL listings here right now (not sales)? A rising rental-DOM trend means longer vacancies and softer asking-rent achievability than the comps imply.
- What's the recent tenant-quality profile in this submarket — average credit score on applications, eviction rate, late-payment / NSF rate, and stable-employment percentage? A property-management company in the area should have these aggregated.
- How much new apartment / multifamily construction is in the pipeline within 1–3 miles? Heavy new supply (>2% of stock underway) typically softens rents 12–24 months out; light construction supports rent growth.
Investment metrics
- 1% rule
- 1.29% ✓
- Cap rate
- 5.78%
- Cash-on-cash
- -1.82%
- DSCR
- 0.92
- GRM
- 6.5
CMA / ARV
No comps found within radius.
Projected returns pro-forma
-3.0% appreciation · 2.47% rent growth · sell at horizon
- IRR
- -19.9%
- Equity multiple
- 0.31×
- Total profit
- $-21,088
- Equity at exit
- $16,252
- IRR
- -14.0%
- Equity multiple
- 0.21×
- Total profit
- $-24,094
- Equity at exit
- $9,424
Cash invested: $30,520 (down + closing). Projections, not guarantees.
Landlord ↔ Tenant lean methodology
- Overall (STATE)
- 87 Strongly Landlord-Friendly
- State Florida
- 87 Strongly Landlord-Friendly · R+3
- County
- — inherits STATE
- City
- — inherits STATE
ZIP-level market 33880
- Home prices YoY
- -16.2%
- Rents YoY
- 2.5%
- Active inventory
- 345
- Price-to-rent
- 6.5×
Monthly cashflow live
- Estimated rent
- $1,404 high interval (Pro) →
- Mortgage (P&I)
- −$572
- Tax from tax record
- −$138 /mo · $1,657/yr
- Insurance
- −$45
- HOA
- −$400
- Vacancy / Maint / Mgmt
- −$295
- Net cashflow
- $-46
Break-even live
Sensitivity live
| Price | -10% $15 | -5% $-15 | +0% $-46 | +5% $-77 | +10% $-108 |
|---|---|---|---|---|---|
| Rent | -10% $-157 | -5% $-102 | +0% $-46 | +5% $9 | +10% $65 |
| Rate | -1.0pp $9 | -0.5pp $-19 | base $-46 | +0.5pp $-75 | +1.0pp $-103 |
UW: 25.0% down · 7.5% · 30yr · 1.5% tax · 5.0% vac · 8.0% maint · 8.0% mgmt
Financing live
Cash to close
- Down payment
- $27,250
- Closing costs
- $3,270
- Reserves months
- —
- Total cash needed
- —
Loan-product check · same deal, 3 products live
Conventional
25% down · 7.5% · 30yr
- Down + closing
- —
- Monthly P&I
- —
- Monthly cashflow
- —
- DSCR
- —
- Eligible?
- —
Personal DTI + credit; lowest rate.
DSCR
20% down · 8.5% · 30yr
- Down + closing
- —
- Monthly P&I
- —
- Monthly cashflow
- —
- DSCR
- —
- Eligible?
- —
No personal income docs; deal must DSCR.
Hard money
10% down · 12.0% · 12mo
- Down + closing
- —
- Monthly P&I
- —
- Monthly cashflow
- —
- DSCR
- —
- Eligible?
- —
Short-term bridge; refi at stabilization.
Rent comps 39 comps
| Address | Beds | Baths | Sqft | Rent | $/sqft | DOM | Units | Dist |
|---|---|---|---|---|---|---|---|---|
| 2025 San Marcos Dr SE #27 Winter Haven, FL | 1.0 | 1.0 | 792 | $1,200 | $1.52 | 16d | 1 | 0.03mi |
| 2001 San Marcos Dr SE #11 Winter Haven, FL | 2.0 | 2.0 | 960 | $1,325 | $1.38 | 16d | 1 | 0.06mi |
| 2085 Isle Royale Ct SE #189 Winter Haven, FL | 1.0 | 1.0 | 648 | $1,150 | $1.77 | 5d | 1 | 0.10mi |
| 1800 3rd Ct SE Winter Haven, FL | 2.0 | 1.0 | 714 | $1,400 | $1.96 | 25d | 1 | 0.17mi |
| 1800 3rd Ct SE Apt E Winter Haven, FL | 2.0 | 1.5 | 714 | $1,400 | $1.96 | 25d | 1 | 0.17mi |
| 200 Avenue K SE Winter Haven, FL | 1.0–3.0 | 1.0–2.0 | 1095 | $1,442 | $1.32 | 4d | 45 | 0.54mi |
| 1150 3rd St SW Winter Haven, FL | 1.0–2.0 | 1.0–2.0 | 587 | $1,750 | $2.98 | 23d | 12 | 0.60mi |
| 1209 6th St SE Apt 3 Winter Haven, FL | 1.0 | 1.0 | 538 | $925 | $1.72 | 16d | 1 | 0.66mi |
| 403 Avenue J SE Winter Haven, FL | 2.0 | 1.0 | 1000 | $1,550 | $1.55 | 25d | 1 | 0.75mi |
| 513 Avenue J SE Winter Haven, FL | 2.0 | 1.0 | 875 | $1,350 | $1.54 | 16d | 1 | 0.83mi |
| 955 6th St SE #10 Winter Haven, FL | 1.0 | 1.0 | 650 | $1,145 | $1.76 | 25d | 1 | 0.84mi |
| 955 6th St SE #9 Winter Haven, FL | 1.0 | 1.0 | 550 | $1,175 | $2.14 | 5d | 1 | 0.84mi |
| 955 6th St SE #1 Winter Haven, FL | 1.0 | 1.0 | 550 | $1,075 | $1.95 | 25d | 1 | 0.84mi |
| 955 6th St SE #5 Winter Haven, FL | 1.0 | 1.0 | 550 | $1,190 | $2.16 | 25d | 1 | 0.84mi |
| 547 Snively Ave Eloise, FL | 2.0 | 1.0 | 1100 | $600 | $0.55 | 25d | 1 | 0.87mi |
| 534 Avenue H SE Winter Haven, FL | 1.0 | 1.0 | 555 | $875 | $1.58 | 5d | 1 | 0.91mi |
| 900 Ave Z SE Apt C6 Winter Haven, FL | 2.0 | 1.0 | 840 | $1,300 | $1.55 | 25d | 1 | 0.93mi |
| 601 2nd St SE Winter Haven, FL | 3.0 | 1.0 | 1072 | $1,195 | $1.11 | 5d | 1 | 0.95mi |
| 1103 Cypress Gardens Blvd Winter Haven, FL | 1.0 | 1.0 | 575 | $1,125 | $1.96 | 5d | 2 | 1.01mi |
| 609 Avenue G SE Winter Haven, FL | 2.0 | 1.0 | 875 | $1,399 | $1.60 | 25d | 1 | 1.03mi |
| 611 Avenue G SE Winter Haven, FL | 2.0 | 1.0 | 875 | $1,299 | $1.48 | 5d | 1 | 1.04mi |
| 106 Avenue D SW Winter Haven, FL | 2.0 | 1.0 | 920 | $1,600 | $1.74 | 5d | 1 | 1.07mi |
| 265 East St Winter Haven, FL | 2.0 | 1.0–2.0 | 757 | $2,250 | $2.97 | 4d | 41 | 1.07mi |
| 332 Avenue D SE Winter Haven, FL | 2.0 | 2.0 | 1090 | $1,800 | $1.65 | 5d | 1 | 1.08mi |
| 200 Avenue C SW Winter Haven, FL | 1.0–2.0 | 1.0–2.0 | 851 | $1,950 | $2.29 | 5d | 12 | 1.15mi |
| 151 Avenue C SW Winter Haven, FL | 2.0 | 1.0 | 819 | $1,300 | $1.59 | 25d | 1 | 1.17mi |
| 1304 15th St SW Winter Haven, FL | 3.0 | 1.0 | 900 | $1,750 | $1.94 | 25d | 1 | 1.18mi |
| 1300 S Lake Howard Dr Winter Haven, FL | 1.0–3.0 | 1.5–2.0 | 1464 | $1,788 | $1.22 | 12d | 20 | 1.21mi |
| 240 2nd St SW Apt 105 Winter Haven, FL | 1.0 | 1.0 | 778 | $1,399 | $1.80 | 25d | 1 | 1.27mi |
| 209 Avenue B SE Winter Haven, FL | 2.0 | 1.0 | 720 | $1,500 | $2.08 | 16d | 1 | 1.28mi |
| 301 Avenue B SW Unit 4 Winter Haven, FL | 1.0 | 1.0 | 600 | $1,000 | $1.67 | 25d | 1 | 1.30mi |
| 710 Avenue C SW Unit 4A Winter Haven, FL | 1.0 | 1.0 | 680 | $1,150 | $1.69 | 25d | 1 | 1.30mi |
| 163 Avenue A SE Winter Haven, FL | 2.0 | 1.5 | 854 | $1,250 | $1.46 | 25d | 1 | 1.33mi |
| 701 Bates Ave SW Unit 203 Winter Haven, FL | 3.0 | 2.0 | 1100 | $1,700 | $1.55 | 4d | 1 | 1.35mi |
| 701 Bates Ave SW Unit 101 Winter Haven, FL | 3.0 | 1.0 | 1000 | $1,600 | $1.60 | 25d | 1 | 1.35mi |
| 701 Bates Ave SW Unit 102 Winter Haven, FL | 3.0 | 2.0 | 1100 | $1,700 | $1.55 | 25d | 1 | 1.35mi |
| 103 4th St SE Unit A Winter Haven, FL | 2.0 | 1.0 | 1014 | $1,399 | $1.38 | 5d | 1 | 1.35mi |
| 407 Avenue A SE Winter Haven, FL | 3.0 | 2.0 | 1124 | $1,700 | $1.51 | 25d | 1 | 1.36mi |
| 1860 Avenue Q SW Winter Haven, FL | 2.0 | 1.5 | 995 | $1,199 | $1.21 | 21d | 1 | 1.48mi |
HOA detail condo
- Monthly dues
- $400 · $4,800/yr
- Assessments
- None detected in remarks — confirm with the listing agent.
Listing history 19 events
-
2026-06-13remarks 679-char remark
-
2026-06-13statusdays on market $109,000 Pending 401 DOM
-
2026-06-10days on market $109,000 Active 399 DOM
-
2026-06-09days on market $109,000 Active 398 DOM
-
2026-06-08pricedays on market $109,000 Active 397 DOM
-
2026-06-07days on market $115,000 Active 396 DOM
-
2026-06-05days on market $115,000 Active 393 DOM
-
2026-06-03days on market $115,000 Active 391 DOM
-
2026-06-01days on market $115,000 Active 390 DOM
-
2026-05-31days on market $115,000 Active 389 DOM
-
2026-02-24price $115,000
-
2025-08-06price $119,900
-
2025-06-29status Active
-
2025-06-29price $125,000
-
2025-03-26price $139,900
-
2025-03-13$144,000 Active
-
2013-10-23soldstatus $40,500
-
2013-09-03soldstatus $40,500 5-char remark
Show marketing remark (5 chars)
condo
-
2012-11-29$43,500 5-char remark
Show marketing remark (5 chars)
condo
ⓘ Source: listings_history table (triggers on properties + properties_extension) + one-shot
backfill from property_details.listing_events for pre-trigger history.
Tax reassessment forecast FL · Resets to sale price
- Current annual tax
- $1,657 · $138/mo
- Projected year-2 tax
- $1,657 · $138/mo
- Expected delta
- $0/yr ($0/mo · 0.0%)
ⓘ Screening estimate from a state-policy table — verify with the county assessor before closing.
Climate risk First Street
- Flood 1/10 Low FEMA zone X (unshaded) · 0% chance over 30 yrs
- Wildfire 4/10 Moderate
- Heat 8/10 Severe 7 d/yr ≥107°F today · 23 d/yr by 30 yrs out
- Wind 9/10 Extreme 99% chance of damaging wind over 30 yrs
- Air quality 2/10 Low 0 unhealthy d/yr today · 2 by 30 yrs out
Nearby sold comps map
Loading sold comps map…
Walkable amenities ~0.75 mi
Loading nearby amenities…
Taxation est. · year 1
- Rental income
- $16,843
- − Mortgage interest
- −$6,106
- − Property taxes
- −$1,657
- − Insurance
- −$545
- − Repairs & maintenance
- −$1,347
- − Management
- −$1,347
- − HOA
- −$4,800
- − Depreciation
- −$3,171
- Taxable loss
- −$2,131
- Est. tax savings @ 24.0%
- +$511
- After-tax cash flow
- $-44/yr
For passive investors: Depreciation is non-cash, so a rental often shows a tax loss while cash-flowing — sheltering income. Rental losses are passive: they offset passive income freely, and up to $25,000/yr can offset ordinary (W-2) income if you actively participate and your MAGI is under $100k (phasing out to $0 by $150k); unused losses carry forward. On sale, claimed depreciation is recaptured at up to 25%, and gains may owe capital-gains tax (a 1031 exchange can defer both). Figures are a year-1 estimate at your 24.0% rate — not tax advice; consult a CPA.
Schools (NCES district)
- District
- Polk
- NCES district ID
- 1201590
- Math proficiency
- 39% ▼ -11.00%
- Reading proficiency
- 43% ▼ -4.00%
- Median HH income
- $43,979
- Composite
- 34.74/100
- National rank
- #5132
- State rank
- #62 of 73 in FL
Livability — Winter Haven
- Score
- 74/100
- State rank
- #291
- US rank
- #4898
Category grades
Schools grade is shown separately in the Schools card above.
Census & demographics
- Census place
- Winter Haven, FL
- County
- Polk County · 740,051 people
- City population
- 121,740
- Metro
- Lakeland-Winter Haven, FL
- Population (ZIP)
- 43,371
- Household income
- $56,390
- Rent vs Own
- Severe rent burden
- 1412.0
Population outlook (Polk County) Hauer SSP2
- Today (2025)
- 752,975 people
- By 2030
- 804,621 · +6.9%
- By 2040
- 906,117 · +20.3%
- By 2050
- 1,000,476 · +32.9%
- By 2075
- 1,197,520 · +59.0%
- By 2100
- 1,271,518 · +68.9%
Race, ethnicity, and origin ACS 2023
- Neighborhood character
- Diverse neighborhood (Simpson 0.65)
- Race & ethnicity
- White 49% Hispanic / Latino 27% Black 17% Two or more races 14% Asian 1%
- Hispanic origin (detail)
- Mexican 11% Puerto Rican 10% Cuban 2%
- Common ancestry
- Hispanic 2% Lithuanian 1% Italian 1%
- Foreign-born
- 9% · Canada, Jamaica
- Languages at home
- 74% English-only · Spanish 21% French/Haitian/Cajun 4%
Political lean MEDSL · Polk
- 2024 margin
- Strong R (+20.7) · D 39.2% · R 59.9%
- 2008→2024 swing
- -14.6pp toward R · 2008: -6.1pp · 2024: -20.7pp
- All cycles
- 2024: R+20.7 2020: R+14.4 2016: R+14.1 2012: R+6.8 2008: R+6.1
Not yet ingested
- Civics
- —
Market trends
- HPI YoY
- ▼ -61.41%
- Current HPI
- 317.8788
- Rent YoY
- ▲ 2.47%
- Metro
- Lakeland-Winter Haven, FL
- State GDP YoY
- ▲ 3.28%
- F500 in state
- 36
Industry mix (Fortune 500 HQ in FL)
| Industry | F500 HQs | Revenue |
|---|---|---|
| Industrial Technology | 2 | $29B |
|
||
| Insurance | 2 | $17B |
|
||
| Retail | 1 | $60B |
|
||
| Technology Distribution | 1 | $58B |
|
||
| Homebuilding | 1 | $35B |
|
||
| Technology Manufacturing | 1 | $35B |
|
||
Price history
+164.4% since first listed9 events — show timeline
- 2026-02-24 Price Changed $115,000 Stellar MLS as Distributed by MLS Grid
- 2025-08-06 Price Changed $119,900 Stellar MLS as Distributed by MLS Grid
- 2025-06-29 Relisted — Stellar MLS as Distributed by MLS Grid
- 2025-06-29 Price Changed $125,000 Stellar MLS as Distributed by MLS Grid
- 2025-03-26 Price Changed $139,900 Stellar MLS as Distributed by MLS Grid
- 2025-03-13 Listed $144,000 Stellar MLS as Distributed by MLS Grid
- 2013-10-23 Sold (Public Records) $40,500 Public Records
- 2013-09-03 Sold (MLS) $40,500 Stellar MLS as Distributed by MLS Grid
- 2012-11-29 Listed $43,500 Stellar MLS as Distributed by MLS Grid
Property tax history
+6.0%/yrLatest (2025): $1,657 · +2.8% YoY. Source: county tax records.
Cash-flow waterfall
monthlySold comps — $/sqft
last 12 mo · ≤1 miLoading sold comps…