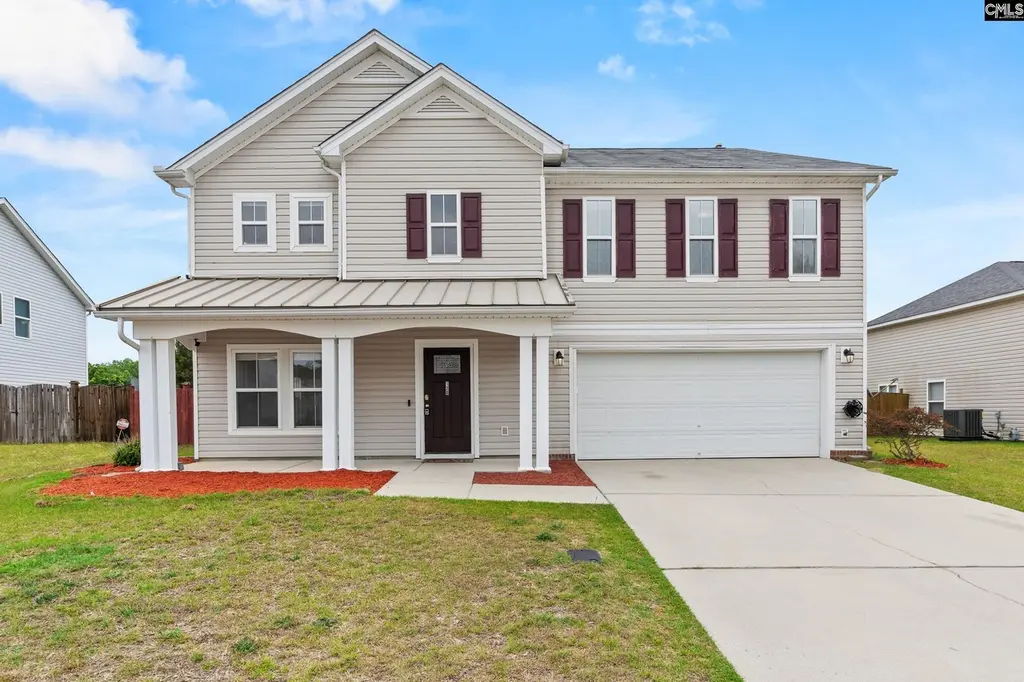
120 Thomaston Dr · Blythewood, SC
Flood risk 1/10 · Minimal
- FEMA flood zone
- X
- Chance of flooding over 30 yrs
- 0.0%
- Est. flood insurance / yr
- $435 – $905
Fire risk 2/10 · Minimal
- Est. fire insurance / yr
- $783 – $1,453
Heat risk 7/10 · Major
- Hot days now (above threshold)
- 7 days/yr
- Hot days in 30 yrs
- 16 days/yr
Wind risk No data
- Chance of severe wind over 30 yrs
- —
Air-quality risk No data
- Unhealthy air days now
- —
- Unhealthy air days in 30 yrs
- —
Risk factors via First Street. Map © Google.
Why this score? — see what drove the D- grade
The composite is a weighted blend of 9 inputs, each scored 0–100. Each bar is that input's sub-score; the figure is the points it added to the 100-point composite (weight × sub-score).
- Cash flow +12.4/30.0
- ARV discount +7.5/15.0
- DSCR +3.7/10.0
- Schools +3.6/10.0
- Livability +3.5/5.0
- Rent growth +3.2/5.0
- 1% rule +2.7/10.0
- Condition / age +2.5/5.0
- Appreciation +0.0/10.0
$325,000
🖨 Deal sheet (PDF) 📄 Offer letter ✓ Due diligence
Listing remarks
Welcome home to 120 Thomaston Drive, a 4-bedroom, 3-bathroom residence boasting 3,136 square feet of comfortable living space on a . 2-acre lot in the established Thomaston neighborhood. Built in 2005 and updated with a NEW ROOF in 2020, this home delivers room to grow, a prime location, and major-system peace of mind. Step inside to an open, spacious floor plan designed for everyday living and entertaining, anchored by an oversized family room that serves as the true heart of the home. Four generous bedrooms and three full baths give you the flexibility to create a home office, guest suite, or playroom. Outside, a covered patio provides a shaded retreat for morning coffee or weekend grilli
Key facts
- 8,712 sq ft lot
- 2 garage spots
- Built 2005
Property features AI
Finance
- Other: Directions: Merge onto Killian Rd, continue onto Clemson Rd, turn left onto Longreen Pkwy, then left onto Thomaston Dr
- HOA & community: Property is part of an association
Exterior
- Parking: Attached garage with space for 2 vehicles
- Utilities: Public water; Public sewer
- Home design: Single-family property
- Construction: Slab foundation
- Exterior features: Vinyl exterior finish; Paved road access
Interior
- Bedrooms: Master bedroom located on the second floor
- Bathrooms: Three full bathrooms total (including two secondary full baths and one main full bath)
- Heating & cooling: Central cooling; Electric heating
- Interior features: Total heated area approximately 3,136
Neighborhood map
What this means for you Summary
Snapshot
- This is a 4-bed/3.0-bath single-family listed at $325k.
Deal economics
- At list price, monthly cash flow is $-54 ($-650/yr) — negative.
- To cash-flow at today's rent, offer at most $315k (2.9% below list).
- To meet the 1% rule (rent ≥ 1% of price), the offer needs to be $250k (22.9% below list).
- Recommended offer: $250k (22.9% below list) — sets the bar for 1% rule.
Location & tenants
- Location reads 70/100 on livability (#58 in SC) — a middle-class / working-renter tenant base. Strengths: crime A+, employment A+, housing A+; Watch: amenities F, commute F, health & safety F.
- Richland 02 (suburban): math 35% / reading 47% proficiency, ranked #29 of 80 in SC (top 36%) — families likely to look elsewhere, expect single-tenant / working-renter base with shorter leases.
- Zoned schools: Sandlapper Elementary (math 30% / reading 34%, grade F, #369 of 597 statewide, top 64%, 656 students, 71% FRL); Westwood High (math 47% / reading 87%, grade B, #73 of 196 statewide, top 41%, 1,684 students, 66% FRL) — zoned schools average 69% FRL vs 38% district-wide (30 pts higher); higher-poverty schools than district average — tighter screening recommended.
- Market conditions: Rents rising (+2.8%/yr); 406 active listings in the ZIP; 7 comparable units currently listed for rent nearby; rentals leasing fast (median 4d on market — plan ~1-2 weeks tenant-placement turnaround); 3,472 units permitted in Richland County in 2024 (1,096 in 5+ unit buildings).
- This rent runs 41% of the median local income ($74k/yr) — at the standard rent-burdened threshold; future hikes will face affordability resistance.
Forward outlook
- Local home prices are declining (-3.0%/yr); year-one equity from $2k of loan paydown is wiped out by about $10k of value loss. Plan a longer hold.
- Richland County population projected at +30% by 2050 — long-run rental-demand tailwind backs the buy-and-hold thesis.
Negotiation context
- It's been on market 19 days — a 2% lower offer ($320k) is reasonable based on typical stale-listing flexibility.
- Current owner paid $202k; list at $325k implies a 61% gain — meaningful room to come down on a strong offer.
Risks & watch-outs
- Climate carrying-cost: extreme-heat days projected 7→16/yr by 2055 (HVAC capex compounding) — expect insurance premiums to compound above CPI over the hold.
Questions for the listing agent
- What do current leases actually rent for vs. the listed asking? Can we see a recent rent roll and the last 12 months of T-12 income?
- Is there a deadline driving the sale (1031 exchange, divorce, estate, relocation)? That informs how much negotiation room exists.
- Schools are B-rated — typically a magnet for longer-tenancy family renters. What's the average tenant stay here, and is there a school-zone premium baked into asking?
- The area grade is low — what's the realistic commute time and amenity access for the typical tenant pool here? Any planned neighborhood developments (good or bad) we should know about?
- What's the average days-on-market for RENTAL listings here right now (not sales)? A rising rental-DOM trend means longer vacancies and softer asking-rent achievability than the comps imply.
- What's the recent tenant-quality profile in this submarket — average credit score on applications, eviction rate, late-payment / NSF rate, and stable-employment percentage? A property-management company in the area should have these aggregated.
- How much new for-sale + rental construction is in the pipeline within 1–3 miles? Heavy new supply typically softens prices + rents 12–24 months out; constrained supply supports both.
Investment metrics
- 1% rule
- 0.77% ✗
- Cap rate
- 6.09%
- Cash-on-cash
- -0.71%
- DSCR
- 0.97
- GRM
- 10.8
CMA / ARV
No comps found within radius.
Projected returns pro-forma
-3.0% appreciation · 2.81% rent growth · sell at horizon
- IRR
- -17.7%
- Equity multiple
- 0.38×
- Total profit
- $-56,684
- Equity at exit
- $48,459
- IRR
- -10.2%
- Equity multiple
- 0.38×
- Total profit
- $-56,132
- Equity at exit
- $28,100
Cash invested: $91,000 (down + closing). Projections, not guarantees.
Landlord ↔ Tenant lean methodology
- Overall (STATE)
- 90 Strongly Landlord-Friendly
- State South Carolina
- 90 Strongly Landlord-Friendly · R+6
- County
- — inherits STATE
- City
- — inherits STATE
ZIP-level market 29229
- Home prices YoY
- -21.5%
- Rents YoY
- 2.8%
- Active inventory
- 406
- Price-to-rent
- 10.8×
Monthly cashflow live
- Estimated rent
- $2,504 high interval (Pro) →
- Mortgage (P&I)
- −$1,704
- Tax from tax record
- −$193 /mo · $2,313/yr
- Insurance
- −$135
- HOA
- −$0
- Vacancy / Maint / Mgmt
- −$526
- Net cashflow
- $-54
Break-even live
Sensitivity live
| Price | -10% $130 | -5% $38 | +0% $-54 | +5% $-146 | +10% $-238 |
|---|---|---|---|---|---|
| Rent | -10% $-252 | -5% $-153 | +0% $-54 | +5% $45 | +10% $144 |
| Rate | -1.0pp $110 | -0.5pp $29 | base $-54 | +0.5pp $-138 | +1.0pp $-224 |
UW: 25.0% down · 7.5% · 30yr · 1.5% tax · 5.0% vac · 8.0% maint · 8.0% mgmt
Financing live
Cash to close
- Down payment
- $81,250
- Closing costs
- $9,750
- Reserves months
- —
- Total cash needed
- —
Loan-product check · same deal, 3 products live
Conventional
25% down · 7.5% · 30yr
- Down + closing
- —
- Monthly P&I
- —
- Monthly cashflow
- —
- DSCR
- —
- Eligible?
- —
Personal DTI + credit; lowest rate.
DSCR
20% down · 8.5% · 30yr
- Down + closing
- —
- Monthly P&I
- —
- Monthly cashflow
- —
- DSCR
- —
- Eligible?
- —
No personal income docs; deal must DSCR.
Hard money
10% down · 12.0% · 12mo
- Down + closing
- —
- Monthly P&I
- —
- Monthly cashflow
- —
- DSCR
- —
- Eligible?
- —
Short-term bridge; refi at stabilization.
Rent comps 7 comps
| Address | Beds | Baths | Sqft | Rent | $/sqft | DOM | Units | Dist |
|---|---|---|---|---|---|---|---|---|
| 830 Wing Stripe Ct Columbia, SC | 5.0 | 3.5 | 3044 | $2,395 | $0.79 | 3d | 1 | 0.62mi |
| 2108 Wilkinson Dr Columbia, SC | 4.0 | 2.5 | 2181 | $2,139 | $0.98 | 3d | 1 | 0.68mi |
| 221 Meyer Ln Columbia, SC | 4.0 | 3.5 | 2184 | $2,349 | $1.08 | 14d | 1 | 0.79mi |
| 13 Coral Ct Columbia, SC | 5.0 | 2.5 | 2424 | $2,469 | $1.02 | 24d | 1 | 0.97mi |
| 429 Buttonbush Ct Columbia, SC | 4.0 | 2.5 | 2715 | $1,995 | $0.73 | 3d | 1 | 1.11mi |
| 669 Pine Lilly Dr Columbia, SC | 4.0 | 2.5 | 2912 | $2,595 | $0.89 | 24d | 1 | 1.33mi |
| 357 Heritage Forest Dr Blythewood, SC | 4.0 | 3.5 | 3698 | $3,350 | $0.91 | 3d | 1 | 1.44mi |
Listing history 8 events
-
2026-05-07$325,000 Active
-
2018-03-29soldstatus $202,000
-
2018-01-20price $207,000
-
2018-01-20price $209,900
-
2017-12-11price $204,800
-
2017-12-09price $214,800
-
2017-11-23price $214,900
-
2017-10-18price $219,400
ⓘ Source: listings_history table (triggers on properties + properties_extension) + one-shot
backfill from property_details.listing_events for pre-trigger history.
Tax reassessment forecast SC · Resets to sale price
- Current annual tax
- $2,313 · $193/mo
- Projected year-2 tax
- $2,313 · $193/mo
- Expected delta
- $0/yr ($0/mo · 0.0%)
ⓘ Screening estimate from a state-policy table — verify with the county assessor before closing.
Climate risk First Street
- Flood 1/10 Low FEMA zone X · 0% chance over 30 yrs
- Wildfire 2/10 Low
- Heat 7/10 Severe
Nearby sold comps map
Loading sold comps map…
Walkable amenities ~0.75 mi
Loading nearby amenities…
Taxation est. · year 1
- Rental income
- $30,051
- − Mortgage interest
- −$18,205
- − Property taxes
- −$2,313
- − Insurance
- −$1,625
- − Repairs & maintenance
- −$2,404
- − Management
- −$2,404
- − Depreciation
- −$9,455
- Taxable loss
- −$6,355
- Est. tax savings @ 24.0%
- +$1,525
- After-tax cash flow
- $875/yr
For passive investors: Depreciation is non-cash, so a rental often shows a tax loss while cash-flowing — sheltering income. Rental losses are passive: they offset passive income freely, and up to $25,000/yr can offset ordinary (W-2) income if you actively participate and your MAGI is under $100k (phasing out to $0 by $150k); unused losses carry forward. On sale, claimed depreciation is recaptured at up to 25%, and gains may owe capital-gains tax (a 1031 exchange can defer both). Figures are a year-1 estimate at your 24.0% rate — not tax advice; consult a CPA.
Schools (NCES district)
- District
- Richland 02
- NCES district ID
- 4503390
- Math proficiency
- 35% ▼ -15.00%
- Reading proficiency
- 47% ▼ -5.00%
- Median HH income
- $59,684
- Composite
- 36.2/100
- National rank
- #4730
- State rank
- #29 of 80 in SC
Livability — Blythewood
- Score
- 70/100
- State rank
- #58
- US rank
- #7406
Category grades
Schools grade is shown separately in the Schools card above.
Census & demographics
- County
- Richland County · 389,530 people
- City population
- 30,454
- Metro
- Columbia, SC
- Population (ZIP)
- 51,861
- Household income
- $74,043
- Rent vs Own
- Severe rent burden
- 1939.0
Population outlook (Richland County) Hauer SSP2
- Today (2025)
- 459,667 people
- By 2030
- 487,524 · +6.1%
- By 2040
- 542,035 · +17.9%
- By 2050
- 595,371 · +29.5%
- By 2075
- 732,998 · +59.5%
- By 2100
- 820,415 · +78.5%
Race, ethnicity, and origin ACS 2023
- Neighborhood character
- Diverse neighborhood (Simpson 0.56)
- Race & ethnicity
- Black 62% White 24% Hispanic / Latino 8% Two or more races 6% Asian 3%
- Hispanic origin (detail)
- Mexican 2% Puerto Rican 2%
- Common ancestry
- Slovak 1% Lithuanian 1% Romanian 1%
- Foreign-born
- 7% · Canada, South Korea, Jamaica
- Languages at home
- 89% English-only · Spanish 6% Other Indo-European 1% Korean 1%
Political lean MEDSL · Richland
- 2024 margin
- Solid D (+34.6) · D 66.4% · R 31.8% · Other 1.8%
- 2008→2024 swing
- +5.7pp toward D · 2008: 28.9pp · 2024: 34.6pp
- All cycles
- 2024: D+34.6 2020: D+38.3 2016: D+32.9 2012: D+33.3 2008: D+28.9
Not yet ingested
- Civics
- —
Market trends
- HPI YoY
- ▼ -51.11%
- Current HPI
- 186.782
- Rent YoY
- ▲ 2.81%
- Metro
- Columbia, SC
- State GDP YoY
- ▲ 4.51%
- F500 in state
- 2
Industry mix (Fortune 500 HQ in SC)
| Industry | F500 HQs | Revenue |
|---|---|---|
| Packaging | 1 | $7B |
|
||
Price history
+48.1% since first listed8 events — show timeline
- 2026-05-07 Listed $325,000 Consolidated MLS
- 2018-03-29 Sold (Public Records) $202,000 Public Records
- 2018-01-20 Price Changed $207,000 Consolidated MLS
- 2018-01-20 Price Changed $209,900 Consolidated MLS
- 2017-12-11 Price Changed $204,800 Consolidated MLS
- 2017-12-09 Price Changed $214,800 Consolidated MLS
- 2017-11-23 Price Changed $214,900 Consolidated MLS
- 2017-10-18 Price Changed $219,400 Consolidated MLS
Property tax history
+1.6%/yrLatest (2025): $2,313 · +3.6% YoY. Source: county tax records.
Cash-flow waterfall
monthlySold comps — $/sqft
last 12 mo · ≤1 miLoading sold comps…