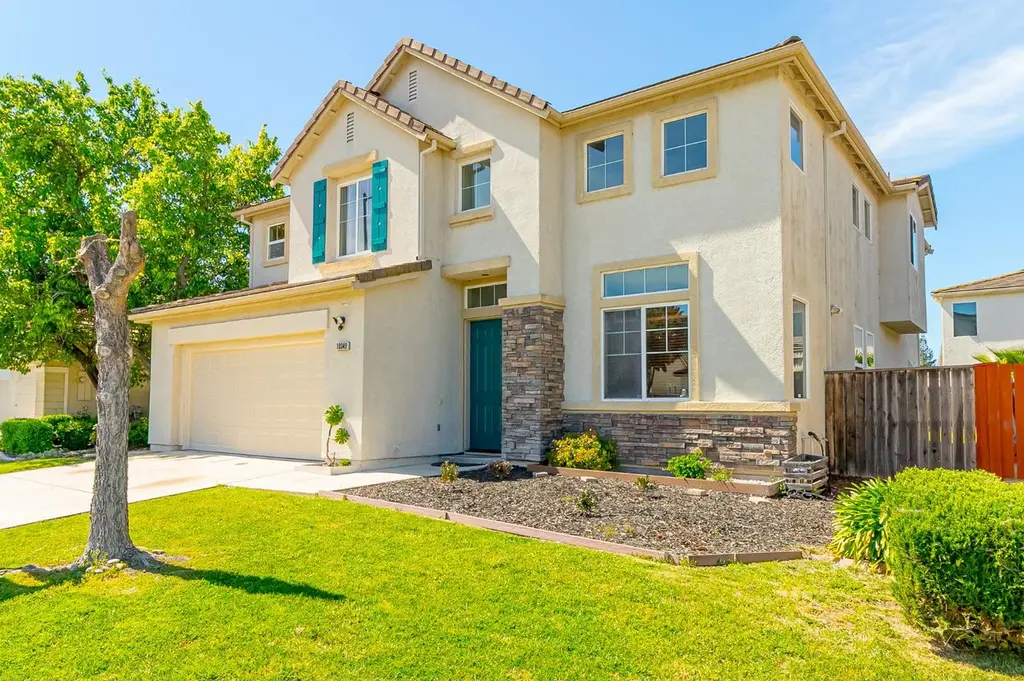
10349 Lanier Ln · Stockton, CA
Flood risk 1/10 · Minimal
- FEMA flood zone
- X
- Chance of flooding over 30 yrs
- 0.0%
- Est. flood insurance / yr
- $507 – $1,088
Fire risk 1/10 · Minimal
- Est. fire insurance / yr
- $659 – $1,223
Heat risk 7/10 · Major
- Hot days now (above 103°F)
- 7 days/yr
- Hot days in 30 yrs
- 15 days/yr
Wind risk 1/10 · Minimal
- Chance of severe wind over 30 yrs
- —
Air-quality risk 10/10 · Severe
- Unhealthy air days now
- 26 days/yr
- Unhealthy air days in 30 yrs
- 27 days/yr
Risk factors via First Street. Map © Google.
Why this score? — see what drove the D grade
The composite is a weighted blend of 9 inputs, each scored 0–100. Each bar is that input's sub-score; the figure is the points it added to the 100-point composite (weight × sub-score).
- ARV discount +13.7/15.0
- Appreciation +10.0/10.0
- Cash flow +4.9/30.0
- Rent growth +3.5/5.0
- Livability +2.9/5.0
- Schools +2.7/10.0
- Condition / age +2.5/5.0
- 1% rule +1.2/10.0
- DSCR +0.0/10.0
$544,000
🖨 Deal sheet (PDF) 📄 Offer letter ✓ Due diligence
Listing remarks
Welcome to 10349 Lanier Ln, a stunning 2,996 sq. ft. home located in the highly sought-after Spanos community. This spacious and beautifully maintained residence offers the perfect blend of comfort, elegance, and functionality. Step inside to a grand entry featuring soaring vaulted ceilings and an inviting formal living and dining area, creating a bright and sophisticated first impression. The expansive kitchen is designed for both entertaining and everyday living, offering abundant cabinetry, a pantry closet, and an open-concept layout that flows seamlessly into the cozy family room and breakfast nook. The thoughtfully designed floor plan includes all bedrooms upstairs, providing privacy a
Key facts
- Grand entry
- Expansive kitchen
- Abundant cabinetry
Tags
Property features AI
Finance
- HOA & community: Mandatory HOA with monthly fee; HOA amenities include pool, clubhouse, and barbeque
Exterior
- Parking: Attached garage with garage door opener and garage facing front; 3-car garage; Paved, level driveway
- Utilities: Public water; Public sewer; Natural gas connected; Irrigation from public district; 220 volts in laundry
- Home design: Single-family detached residence; Two-story home; Built in 2003; Tile roof
- Construction: Tile roof; Detached single-family construction; Year built 2003
- Exterior features: Wood fencing; Auto sprinkler front and rear; Landscaped front and back; Curb and gutter; Close to clubhouse
Interior
- Kitchen: Breakfast area; Butler's pantry; Pantry closet; Island; Kitchen open to family room; Tile countertops; Free-standing gas range and oven; Microwave; Dishwasher; Disposal; Ice maker
- Bedrooms: 5 bedrooms; Master suite with sitting area and walk-in closet
- Flooring: Simulated wood flooring; Vinyl flooring
- Bathrooms: 2 full bathrooms; 1 half bathroom; Master bath with shower stall, double sinks, tub, fiberglass surround and window; Other baths with double sinks and tub/shower over
- Heating & cooling: Central heating; Central air conditioning; Ceiling fans
- Interior features: Cathedral ceiling; Formal entry; Storage areas; Dual-pane full windows
- Laundry & utility: Indoor laundry room with cabinets and gas hook-up; 220V outlet in laundry
Neighborhood map
What this means for you Summary
Snapshot
- This is a 5-bed/2.5-bath single-family listed at $544k.
Deal economics
- At list price, monthly cash flow is $-1k ($-16k/yr) — negative.
- To cash-flow at today's rent, offer at most $315k (42.0% below list).
- To meet the 1% rule (rent ≥ 1% of price), the offer needs to be $337k (38.1% below list).
- Recommended offer: $315k (42.0% below list) — sets the bar for cash-flow.
Location & tenants
- Location reads 57/100 on livability (#734 in CA) — a working-class tenant base; expect higher turnover. Strengths: housing A+, health & safety A, amenities A-; Watch: employment C-, crime F, commute F.
- Lodi Unified (urban): math 24% / reading 36% proficiency, ranked #325 of 517 in CA (top 63%) — families likely to look elsewhere, expect single-tenant / working-renter base with shorter leases.
- Zoned schools: Manlio Silva Elementary (math 39% / reading 52%, grade D-, #485 of 1,571 statewide, top 31%, 757 students, 59% FRL); Christa Mcauliffe Middle (math 24% / reading 45%, grade F, #183 of 498 statewide, top 38%, 632 students, 58% FRL); Bear Creek High (math 30% / reading 44%, grade F, #578 of 1,170 statewide, top 51%, 1,937 students, 75% FRL).
- Market conditions: Rents rising fast (+4.2%/yr); 217 active listings in the ZIP; 6 comparable units currently listed for rent nearby; rentals lingering (median 46d on market — plan ~5-8 weeks vacancy on turnover, expect pricing pressure); 67% of comp listings sitting > 30 days — soft ceiling on asking rent; high-income renter base; 3,779 units permitted in San Joaquin County in 2024 (0 in 5+ unit buildings).
- This rent runs 36% of the median local income ($112k/yr) — at the standard rent-burdened threshold; future hikes will face affordability resistance.
Forward outlook
- In year one you build about $58k of equity ($4k loan paydown + $54k appreciation (10.0% local appreciation)).
- San Joaquin County population projected at +17% by 2050 — long-run rental-demand tailwind backs the buy-and-hold thesis.
- By year 2, paydown + projected appreciation supports a ~$93k cash-out refi (75% LTV) — recoverable capital for the next deal without selling this one.
Negotiation context
- It's been on market 21 days — a 2% lower offer ($536k) is reasonable based on typical stale-listing flexibility.
- Current owner paid $395k; 38% above their basis — modest negotiation headroom, anchor on the comps not their cost.
Risks & watch-outs
- Climate carrying-cost: extreme-heat days projected 7→15/yr by 2055 (HVAC capex compounding) — expect insurance premiums to compound above CPI over the hold.
Questions for the listing agent
- What do current leases actually rent for vs. the listed asking? Can we see a recent rent roll and the last 12 months of T-12 income?
- What does the HOA fee cover, when was the last increase, and are there any pending special assessments or reserve-fund shortfalls?
- Is there a deadline driving the sale (1031 exchange, divorce, estate, relocation)? That informs how much negotiation room exists.
- Schools are D-rated, which usually means shorter tenancies and higher turnover. Who's the typical renter profile here, and what's been the actual vacancy rate?
- Crime grade is F in this area — have there been break-ins, vandalism, or insurance claims at this property in the last 3 years? What carrier currently insures it and at what premium?
- The area grade is low — what's the realistic commute time and amenity access for the typical tenant pool here? Any planned neighborhood developments (good or bad) we should know about?
- What's the average days-on-market for RENTAL listings here right now (not sales)? A rising rental-DOM trend means longer vacancies and softer asking-rent achievability than the comps imply.
- What's the recent tenant-quality profile in this submarket — average credit score on applications, eviction rate, late-payment / NSF rate, and stable-employment percentage? A property-management company in the area should have these aggregated.
- How much new for-sale + rental construction is in the pipeline within 1–3 miles? Heavy new supply typically softens prices + rents 12–24 months out; constrained supply supports both.
Investment metrics
- 1% rule
- 0.62% ✗
- Cap rate
- 3.44%
- Cash-on-cash
- -10.19%
- DSCR
- 0.55
- GRM
- 13.5
CMA / ARV
- ARV (median comp)
- $631,075
- List price
- $544,000
- Delta
- -12.07%
- Verdict
- UNDERPRICED
- Comps
- 20 within 1.0 mi
Show comp detail 12 sales within ~0.75 mi
| Address | Dist | Beds/Ba | Sqft | Sold | Price | $/sf | Match |
|---|---|---|---|---|---|---|---|
| 10305 Bridgeview Ln | 0.13mi | 5/3.0 | 3,063 (+2%) | 4mo | $648,500 | $212 | 84 |
| 5433 Gladstone Dr | 0.26mi | 5/3.0 | 3,160 (+6%) | 0mo | $650,000 | $206 | 76 |
| 10219 Mono Ct | 0.10mi | 5/2.5 | 2,635 (-12%) | 2mo | $599,000 | $227 | 74 |
| 10831 Meadowmont Way | 0.43mi | 5/3.0 | 3,166 (+6%) | 8mo | $683,000 | $216 | 62 |
| 10301 Ultar Dr | 0.61mi | 5/3.5 | 2,966 (-1%) | 6mo | $671,500 | $226 | 61 |
| 10924 Lakemore | 0.43mi | 5/3.0 | 3,166 (+6%) | 9mo | $655,000 | $207 | 61 |
| 10349 Baldy Dr | 0.39mi | 4/3.5 (-1) | 2,776 (-7%) | 5mo | $590,000 | $213 | 56 |
| 5806 Lagrande Way | 0.16mi | 4/3.0 (-1) | 2,615 (-13%) | 10mo | $635,000 | $243 | 56 |
| 6907 Foraker Dr | 0.65mi | 5/3.0 | 2,833 (-5%) | 3mo | $615,000 | $217 | 56 |
| 5379 Ridgeview Cir | 0.60mi | 6/3.0 (+1) | 3,168 (+6%) | 4mo | $692,000 | $218 | 52 |
| 5914 Silveroak Cir | 0.43mi | 4/3.5 (-1) | 2,585 (-14%) | 2mo | $582,000 | $225 | 46 |
| 5651 Westchester Cir | 0.49mi | 5/3.5 | 2,585 (-14%) | 7mo | $600,000 | $232 | 44 |
Match score weights: distance 35% · size 25% · config 20% · recency 20%. Top-matched comps best support the ARV.
Projected returns pro-forma
10.0% appreciation · 4.16% rent growth · sell at horizon
- IRR
- 17.4%
- Equity multiple
- 2.43×
- Total profit
- $218,011
- Equity at exit
- $490,078
- IRR
- 16.7%
- Equity multiple
- 5.70×
- Total profit
- $715,613
- Equity at exit
- $1,056,872
Cash invested: $152,320 (down + closing). Projections, not guarantees.
Landlord ↔ Tenant lean methodology
- Overall (STATE)
- 18 Strongly Tenant-Friendly
- State California
- 18 Strongly Tenant-Friendly · D+13
- County
- — inherits STATE
- City
- — inherits STATE
ZIP-level market 95219
- Home prices YoY
- 6.6%
- Rents YoY
- 4.2%
- Active inventory
- 217
- Price-to-rent
- 13.5×
Monthly cashflow live
- Estimated rent
- $3,368 high interval (Pro) →
- Mortgage (P&I)
- −$2,853
- Tax from tax record
- −$767 /mo · $9,206/yr
- Insurance
- −$227
- HOA
- −$108
- Vacancy / Maint / Mgmt
- −$707
- Net cashflow
- $-1,294
Break-even live
Sensitivity live
| Price | -10% $-986 | -5% $-1,140 | +0% $-1,294 | +5% $-1,448 | +10% $-1,602 |
|---|---|---|---|---|---|
| Rent | -10% $-1,560 | -5% $-1,427 | +0% $-1,294 | +5% $-1,161 | +10% $-1,028 |
| Rate | -1.0pp $-1,020 | -0.5pp $-1,156 | base $-1,294 | +0.5pp $-1,435 | +1.0pp $-1,578 |
UW: 25.0% down · 7.5% · 30yr · 1.5% tax · 5.0% vac · 8.0% maint · 8.0% mgmt
Financing live
Cash to close
- Down payment
- $136,000
- Closing costs
- $16,320
- Reserves months
- —
- Total cash needed
- —
Loan-product check · same deal, 3 products live
Conventional
25% down · 7.5% · 30yr
- Down + closing
- —
- Monthly P&I
- —
- Monthly cashflow
- —
- DSCR
- —
- Eligible?
- —
Personal DTI + credit; lowest rate.
DSCR
20% down · 8.5% · 30yr
- Down + closing
- —
- Monthly P&I
- —
- Monthly cashflow
- —
- DSCR
- —
- Eligible?
- —
No personal income docs; deal must DSCR.
Hard money
10% down · 12.0% · 12mo
- Down + closing
- —
- Monthly P&I
- —
- Monthly cashflow
- —
- DSCR
- —
- Eligible?
- —
Short-term bridge; refi at stabilization.
Rent comps 6 comps
| Address | Beds | Baths | Sqft | Rent | $/sqft | DOM | Units | Dist |
|---|---|---|---|---|---|---|---|---|
| 10210 Copco Ln Stockton, CA | 4.0 | 2.0 | 2252 | $3,100 | $1.38 | 45d | 1 | 0.37mi |
| 10831 Larboard Ct Stockton, CA | 5.0 | 3.0 | 2160 | $3,950 | $1.83 | 45d | 1 | 0.54mi |
| 6831 Oakum Way Stockton, CA | 4.0 | 3.0 | 2318 | $3,100 | $1.34 | 45d | 1 | 0.61mi |
| 7017 Overlook Way Stockton, CA | 4.0 | 3.0 | 2403 | $3,095 | $1.29 | 45d | 1 | 1.03mi |
| 10100 Downy Birch Dr Stockton, CA | 5.0 | 3.0 | 2639 | $3,500 | $1.33 | 23d | 1 | 1.04mi |
| 10962 Admiral Cove Way Stockton, CA | 4.0 | 3.0 | 2403 | $3,200 | $1.33 | 16d | 1 | 1.11mi |
HOA detail
- Monthly dues
- $108 · $1,296/yr
Listing history 15 events
-
2026-06-17status $544,000 Pending 21 DOM
-
2026-06-17days on market $544,000 Active 21 DOM
-
2026-06-16days on market $544,000 Active 20 DOM
-
2026-06-15days on market $544,000 Active 19 DOM
-
2026-06-14days on market $544,000 Active 17 DOM
-
2026-06-10days on market $544,000 Active 14 DOM
-
2026-06-09days on market $544,000 Active 13 DOM
-
2026-06-08days on market $544,000 Active 12 DOM
-
2026-06-07days on market $544,000 Active 11 DOM
-
2026-06-05days on market $544,000 Active 8 DOM
-
2026-06-03days on market $544,000 Active 7 DOM
-
2026-06-03days on market $544,000 Active 6 DOM
-
2026-06-01days on market $544,000 Active 5 DOM
-
2026-05-31days on market $544,000 Active 4 DOM
-
2004-06-25soldstatus $395,000
ⓘ Source: listings_history table (triggers on properties + properties_extension) + one-shot
backfill from property_details.listing_events for pre-trigger history.
Tax reassessment forecast CA · Resets to sale price
- Current annual tax
- $9,206 · $767/mo
- Projected year-2 tax
- $9,206 · $767/mo
- Expected delta
- $0/yr ($0/mo · 0.0%)
ⓘ Screening estimate from a state-policy table — verify with the county assessor before closing.
Climate risk First Street
- Flood 1/10 Low FEMA zone X · 0% chance over 30 yrs
- Wildfire 1/10 Low
- Heat 7/10 Severe 7 d/yr ≥103°F today · 15 d/yr by 30 yrs out
- Wind 1/10 Low
- Air quality 10/10 Extreme 26 unhealthy d/yr today · 27 by 30 yrs out
Nearby sold comps map
Loading sold comps map…
Walkable amenities ~0.75 mi
Loading nearby amenities…
Taxation est. · year 1
- Rental income
- $40,415
- − Mortgage interest
- −$30,472
- − Property taxes
- −$9,206
- − Insurance
- −$2,720
- − Repairs & maintenance
- −$3,233
- − Management
- −$3,233
- − HOA
- −$1,296
- − Depreciation
- −$15,825
- Taxable loss
- −$25,571
- Est. tax savings @ 24.0%
- +$6,137
- After-tax cash flow
- $-9,390/yr
For passive investors: Depreciation is non-cash, so a rental often shows a tax loss while cash-flowing — sheltering income. Rental losses are passive: they offset passive income freely, and up to $25,000/yr can offset ordinary (W-2) income if you actively participate and your MAGI is under $100k (phasing out to $0 by $150k); unused losses carry forward. On sale, claimed depreciation is recaptured at up to 25%, and gains may owe capital-gains tax (a 1031 exchange can defer both). Figures are a year-1 estimate at your 24.0% rate — not tax advice; consult a CPA.
Schools (NCES district)
- District
- Lodi Unified
- NCES district ID
- 0622230
- Math proficiency
- 24% ▼ -8.00%
- Reading proficiency
- 36% ▼ -8.00%
- Median HH income
- $57,165
- Composite
- 26.84/100
- National rank
- #7108
- State rank
- #325 of 517 in CA
Livability — Stockton
- Score
- 57/100
- State rank
- #734
- US rank
- #21638
Category grades
Schools grade is shown separately in the Schools card above.
Census & demographics
- Census place
- Stockton, CA
- County
- San Joaquin County · 729,570 people
- City population
- 332,006
- Metro
- Stockton, CA
- Population (ZIP)
- 31,713
- Household income
- $112,268
- Rent vs Own
- Severe rent burden
- 825.0
Population outlook (San Joaquin County) Hauer SSP2
- Today (2025)
- 796,965 people
- By 2030
- 828,849 · +4.0%
- By 2040
- 885,611 · +11.1%
- By 2050
- 929,798 · +16.7%
- By 2075
- 994,578 · +24.8%
- By 2100
- 971,291 · +21.9%
Race, ethnicity, and origin ACS 2023
- Neighborhood character
- Highly diverse neighborhood (Simpson 0.75)
- Race & ethnicity
- White 33% Hispanic / Latino 30% Asian 21% Two or more races 18% Black 9%
- Hispanic origin (detail)
- Mexican 27%
- Common ancestry
- Slovak 2% Italian 2% Portuguese 1%
- Foreign-born
- 20% · Canada, China, Vietnam
- Languages at home
- 69% English-only · Spanish 14% Other Indo-European 4% Other Asian/Pacific 4%
Political lean MEDSL · San Joaquin
- 2024 margin
- Toss-up / Even · D 48.0% · R 48.9% · Other 3.0%
- 2008→2024 swing
- -11.6pp toward R · 2008: 10.7pp · 2024: -0.9pp
- All cycles
- 2024: R+0.9 2020: D+13.9 2016: D+12.9 2012: D+8.9 2008: D+10.7
Not yet ingested
- Civics
- —
Market trends
- HPI YoY
- ▲ 69.26%
- Current HPI
- 1122.61
- Rent YoY
- ▲ 4.16%
- Metro
- Stockton, CA
- State GDP YoY
- ▲ 3.21%
- F500 in state
- 116
Industry mix (Fortune 500 HQ in CA)
| Industry | F500 HQs | Revenue |
|---|---|---|
| Technology | 27 | $1,492B |
|
||
| Financial Services | 3 | $174B |
|
||
| Retail | 3 | $44B |
|
||
| Insurance | 3 | $26B |
|
||
| Media / Entertainment | 2 | $115B |
|
||
| Pharmaceuticals / Biotech | 2 | $62B |
|
||
Price history
1 event — show timeline
- 2004-06-25 Sold (Public Records) $395,000 Public Records
Property tax history
+2.8%/yrLatest (2025): $9,206 · +5.8% YoY. Source: county tax records.
Cash-flow waterfall
monthlySold comps — $/sqft
last 12 mo · ≤1 miLoading sold comps…