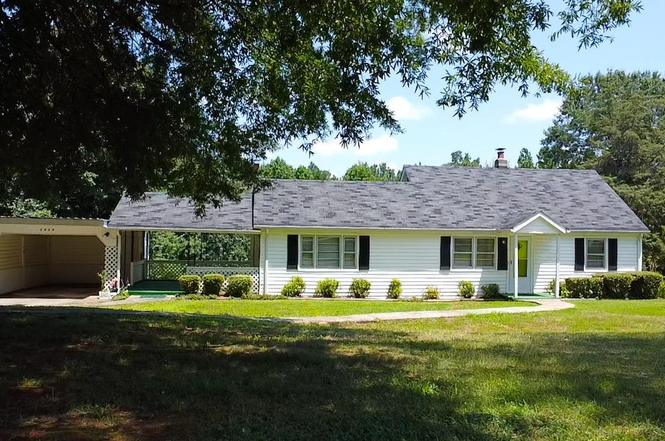
2929 Zion Rd Rd · Gretna, VA
Flood risk 1/10 · Minimal
- FEMA flood zone
- X (unshaded)
- Chance of flooding over 30 yrs
- 0.0%
- Est. flood insurance / yr
- $507 – $1,088
Fire risk 4/10 · Minor
- Est. fire insurance / yr
- $666 – $1,236
Heat risk 6/10 · Moderate
- Hot days now (above 103°F)
- 7 days/yr
- Hot days in 30 yrs
- 18 days/yr
Wind risk 3/10 · Minor
- Chance of severe wind over 30 yrs
- 4.0%
Air-quality risk 2/10 · Minimal
- Unhealthy air days now
- 1 days/yr
- Unhealthy air days in 30 yrs
- 1 days/yr
Risk factors via First Street. Map © Google.
Why this score? — see what drove the D grade
The composite is a weighted blend of 9 inputs, each scored 0–100. Each bar is that input's sub-score; the figure is the points it added to the 100-point composite (weight × sub-score).
- Cash flow +9.9/30.0
- ARV discount +7.5/15.0
- Appreciation +6.0/10.0
- Schools +6.0/10.0
- Livability +3.7/5.0
- DSCR +2.8/10.0
- Rent growth +2.5/5.0
- Condition / age +2.5/5.0
- 1% rule +1.8/10.0
$159,999
🖨 Deal sheet (PDF) 📄 Offer letter ✓ Due diligence
Listing remarks
3BR/1BA home situated on a quiet country road just 5 miles from town. Features a functional floor plan with spacious bedrooms, a finished attic for additional living or storage space, and a large lot. Enjoy the privacy of a rural setting with the benefit of being minutes from shopping, dining, and schools.
Key facts
- Quiet country road
- Finished attic
- Large lot
Tags
Neighborhood map
What this means for you Summary
Snapshot
- This is a 3-bed/1.0-bath single-family listed at $160k.
Deal economics
- At list price, monthly cash flow is $-98 ($-1k/yr) — negative.
- To cash-flow at today's rent, offer at most $143k (10.9% below list).
- To meet the 1% rule (rent ≥ 1% of price), the offer needs to be $109k (32.0% below list).
- Recommended offer: $109k (32.0% below list) — sets the bar for 1% rule.
Location & tenants
- Location reads 74/100 on livability (#157 in VA, #4,927 nationally) — a middle-class / working-renter tenant base. Strengths: crime A+, cost of living A+, health & safety A+; Watch: amenities F, commute F, employment F.
- Pittsylvania County Public School District (rural): math 65% / reading 78% proficiency, ranked #22 of 131 in VA (top 17%) — strong family-tenant draw, lease renewals of 3-5y typical.
- Zoned schools: Gretna Elementary (math 72% / reading 80%, grade A, #202 of 1,108 statewide, top 19%, 460 students, 83% FRL); Gretna Middle (math 47% / reading 72%, grade B, #160 of 342 statewide, top 48%, 397 students, 81% FRL); Gretna High (math 57% / reading 67%, grade B-, #231 of 319 statewide, top 75%, 535 students, 80% FRL) — zoned schools average 81% FRL vs 47% district-wide (34 pts higher); higher-poverty schools than district average — tighter screening recommended.
- Market conditions: 82 active listings in the ZIP; 72 units permitted in Pittsylvania County in 2024 (0 in 5+ unit buildings).
Forward outlook
- In year one you build about $4k of equity ($1k loan paydown + $3k appreciation (1.9% local appreciation)).
- Pittsylvania County population projected at -22% by 2050 — secular population decline; favor cash flow + early exit over multi-decade hold.
- By year 8, paydown + projected appreciation supports a ~$31k cash-out refi (75% LTV) — recoverable capital for the next deal without selling this one.
Negotiation context
- It's been on market 26 days — a 2% lower offer ($158k) is reasonable based on typical stale-listing flexibility.
Risks & watch-outs
- Watch-outs: built in 1955 — expect roof / HVAC / electrical / plumbing capex.
- Climate carrying-cost: extreme-heat days projected 7→18/yr by 2055 (HVAC capex compounding) — expect insurance premiums to compound above CPI over the hold.
Questions for the listing agent
- What do current leases actually rent for vs. the listed asking? Can we see a recent rent roll and the last 12 months of T-12 income?
- Built in 1955 — when were the roof, HVAC, electrical panel, plumbing, and water heater last replaced?
- Is there a deadline driving the sale (1031 exchange, divorce, estate, relocation)? That informs how much negotiation room exists.
- Schools are B-rated — typically a magnet for longer-tenancy family renters. What's the average tenant stay here, and is there a school-zone premium baked into asking?
- The area grade is low — what's the realistic commute time and amenity access for the typical tenant pool here? Any planned neighborhood developments (good or bad) we should know about?
- What's the average days-on-market for RENTAL listings here right now (not sales)? A rising rental-DOM trend means longer vacancies and softer asking-rent achievability than the comps imply.
- What's the recent tenant-quality profile in this submarket — average credit score on applications, eviction rate, late-payment / NSF rate, and stable-employment percentage? A property-management company in the area should have these aggregated.
- How much new for-sale + rental construction is in the pipeline within 1–3 miles? Heavy new supply typically softens prices + rents 12–24 months out; constrained supply supports both.
Investment metrics
- 1% rule
- 0.68% ✗
- Cap rate
- 5.56%
- Cash-on-cash
- -2.63%
- DSCR
- 0.88
- GRM
- 12.3
CMA / ARV
No comps found within radius.
Projected returns pro-forma
1.91% appreciation · 3.0% rent growth · sell at horizon
- IRR
- 1.6%
- Equity multiple
- 1.09×
- Total profit
- $3,945
- Equity at exit
- $62,376
- IRR
- 5.7%
- Equity multiple
- 1.77×
- Total profit
- $34,442
- Equity at exit
- $89,263
Cash invested: $44,800 (down + closing). Projections, not guarantees.
Landlord ↔ Tenant lean methodology
- Overall (STATE)
- 55 Moderately Landlord-Leaning
- State Virginia
- 55 Moderately Landlord-Leaning · D+2
- County
- — inherits STATE
- City
- — inherits STATE
ZIP-level market 24557
- Home prices YoY
- 1.2%
- Active inventory
- 82
- Price-to-rent
- 12.3×
Monthly cashflow live
- Estimated rent
- $1,088 medium interval (Pro) →
- Mortgage (P&I)
- −$839
- Tax from tax record
- −$52 /mo · $621/yr
- Insurance
- −$67
- HOA
- −$0
- Vacancy / Maint / Mgmt
- −$228
- Net cashflow
- $-98
Break-even live
Sensitivity live
| Price | -10% $-8 | -5% $-53 | +0% $-98 | +5% $-144 | +10% $-189 |
|---|---|---|---|---|---|
| Rent | -10% $-184 | -5% $-141 | +0% $-98 | +5% $-55 | +10% $-12 |
| Rate | -1.0pp $-18 | -0.5pp $-58 | base $-98 | +0.5pp $-140 | +1.0pp $-182 |
UW: 25.0% down · 7.5% · 30yr · 1.5% tax · 5.0% vac · 8.0% maint · 8.0% mgmt
Financing live
Cash to close
- Down payment
- $40,000
- Closing costs
- $4,800
- Reserves months
- —
- Total cash needed
- —
Loan-product check · same deal, 3 products live
Conventional
25% down · 7.5% · 30yr
- Down + closing
- —
- Monthly P&I
- —
- Monthly cashflow
- —
- DSCR
- —
- Eligible?
- —
Personal DTI + credit; lowest rate.
DSCR
20% down · 8.5% · 30yr
- Down + closing
- —
- Monthly P&I
- —
- Monthly cashflow
- —
- DSCR
- —
- Eligible?
- —
No personal income docs; deal must DSCR.
Hard money
10% down · 12.0% · 12mo
- Down + closing
- —
- Monthly P&I
- —
- Monthly cashflow
- —
- DSCR
- —
- Eligible?
- —
Short-term bridge; refi at stabilization.
Listing history 3 events
-
2026-01-05soldstatus $159,999
-
2025-10-22status Pending
-
2025-09-26$159,999 Active
ⓘ Source: listings_history table (triggers on properties + properties_extension) + one-shot
backfill from property_details.listing_events for pre-trigger history.
Tax reassessment forecast VA · Resets to sale price
- Current annual tax
- $621 · $52/mo
- Projected year-2 tax
- $1,312 · $109/mo
- Expected delta
- +$691/yr (+$58/mo · 111.3%)
ⓘ Screening estimate from a state-policy table — verify with the county assessor before closing.
Climate risk First Street
- Flood 1/10 Low FEMA zone X (unshaded) · 0% chance over 30 yrs
- Wildfire 4/10 Moderate
- Heat 6/10 Major 7 d/yr ≥103°F today · 18 d/yr by 30 yrs out
- Wind 3/10 Moderate 4% chance of damaging wind over 30 yrs
- Air quality 2/10 Low 1 unhealthy d/yr today · 1 by 30 yrs out
Nearby sold comps map
Loading sold comps map…
Walkable amenities ~0.75 mi
Loading nearby amenities…
Taxation est. · year 1
- Rental income
- $13,050
- − Mortgage interest
- −$8,962
- − Property taxes
- −$621
- − Insurance
- −$800
- − Repairs & maintenance
- −$1,044
- − Management
- −$1,044
- − Depreciation
- −$4,655
- Taxable loss
- −$4,076
- Est. tax savings @ 24.0%
- +$978
- After-tax cash flow
- $-202/yr
For passive investors: Depreciation is non-cash, so a rental often shows a tax loss while cash-flowing — sheltering income. Rental losses are passive: they offset passive income freely, and up to $25,000/yr can offset ordinary (W-2) income if you actively participate and your MAGI is under $100k (phasing out to $0 by $150k); unused losses carry forward. On sale, claimed depreciation is recaptured at up to 25%, and gains may owe capital-gains tax (a 1031 exchange can defer both). Figures are a year-1 estimate at your 24.0% rate — not tax advice; consult a CPA.
Schools (NCES district)
- District
- Pittsylvania County Public School District
- NCES district ID
- 5102940
- Math proficiency
- 65% ▼ -22.00%
- Reading proficiency
- 78% ▼ -4.00%
- Median HH income
- $41,672
- Composite
- 59.77/100
- National rank
- #900
- State rank
- #22 of 131 in VA
Livability — Gretna
- Score
- 74/100
- State rank
- #157
- US rank
- #4927
Category grades
Schools grade is shown separately in the Schools card above.
Census & demographics
- Population (ZIP)
- 7,832
Population outlook (Pittsylvania County) Hauer SSP2
- Today (2025)
- 58,725 people
- By 2030
- 56,388 · -4.0%
- By 2040
- 51,088 · -13.0%
- By 2050
- 45,875 · -21.9%
- By 2075
- 36,555 · -37.8%
- By 2100
- 28,288 · -51.8%
Race, ethnicity, and origin ACS 2023
- Neighborhood character
- Predominantly White (76%)
- Race & ethnicity
- White 76% Black 20% Two or more races 2% Hispanic / Latino 2%
- Common ancestry
- Slovak 2% Serbian 1% Lithuanian 1%
- Foreign-born
- 1% · Canada
- Languages at home
- 99% English-only · Spanish 1%
Political lean MEDSL · Pittsylvania
- 2024 margin
- Solid R (+43.1) · D 28.1% · R 71.3%
- 2008→2024 swing
- -19.1pp toward R · 2008: -24.0pp · 2024: -43.1pp
- All cycles
- 2024: R+43.1 2020: R+39.8 2016: R+39.6 2012: R+27.5 2008: R+24.0
Not yet ingested
- Civics
- —
Market trends
- HPI YoY
- ▲ 1.91%
- Current HPI
- 160.7742
- Rent YoY
- —
- Metro
- —
- State GDP YoY
- ▲ 2.40%
- F500 in state
- 50
Industry mix (Fortune 500 HQ in VA)
| Industry | F500 HQs | Revenue |
|---|---|---|
| Aerospace / Defense | 4 | $236B |
|
||
| Technology / Defense | 3 | $32B |
|
||
| Financial Services | 2 | $176B |
|
||
| Utilities | 2 | $27B |
|
||
| Insurance | 2 | $25B |
|
||
| Technology | 2 | $15B |
|
||
Price history
+0.0% since first listed3 events — show timeline
- 2026-01-05 Sold (Public Records) $159,999 Public Records
- 2025-10-22 Pending — LMLS
- 2025-09-26 Listed $159,999 LMLS
Property tax history
+4.5%/yrLatest (2025): $621 · +0.0% YoY. Source: county tax records.
Cash-flow waterfall
monthlySold comps — $/sqft
last 12 mo · ≤1 miLoading sold comps…