200 Jay St · Trinidad, TX
Flood risk No data
- FEMA flood zone
- —
- Chance of flooding over 30 yrs
- —
- Est. flood insurance / yr
- —
Fire risk No data
- Est. fire insurance / yr
- —
Heat risk No data
- Hot days now (above threshold)
- —
- Hot days in 30 yrs
- —
Wind risk No data
- Chance of severe wind over 30 yrs
- —
Air-quality risk No data
- Unhealthy air days now
- —
- Unhealthy air days in 30 yrs
- —
Risk factors via First Street. Map © Google.
Why this score? — see what drove the A- grade
The composite is a weighted blend of 9 inputs, each scored 0–100. Each bar is that input's sub-score; the figure is the points it added to the 100-point composite (weight × sub-score).
- Cash flow +30.0/30.0
- ARV discount +15.0/15.0
- 1% rule +10.0/10.0
- DSCR +10.0/10.0
- Appreciation +5.5/10.0
- Schools +3.7/10.0
- Livability +2.9/5.0
- Rent growth +2.5/5.0
- Condition / age +2.5/5.0
$95,000
🖨 Deal sheet 📄 Offer letter ✓ Due diligence
Listing remarks MLS
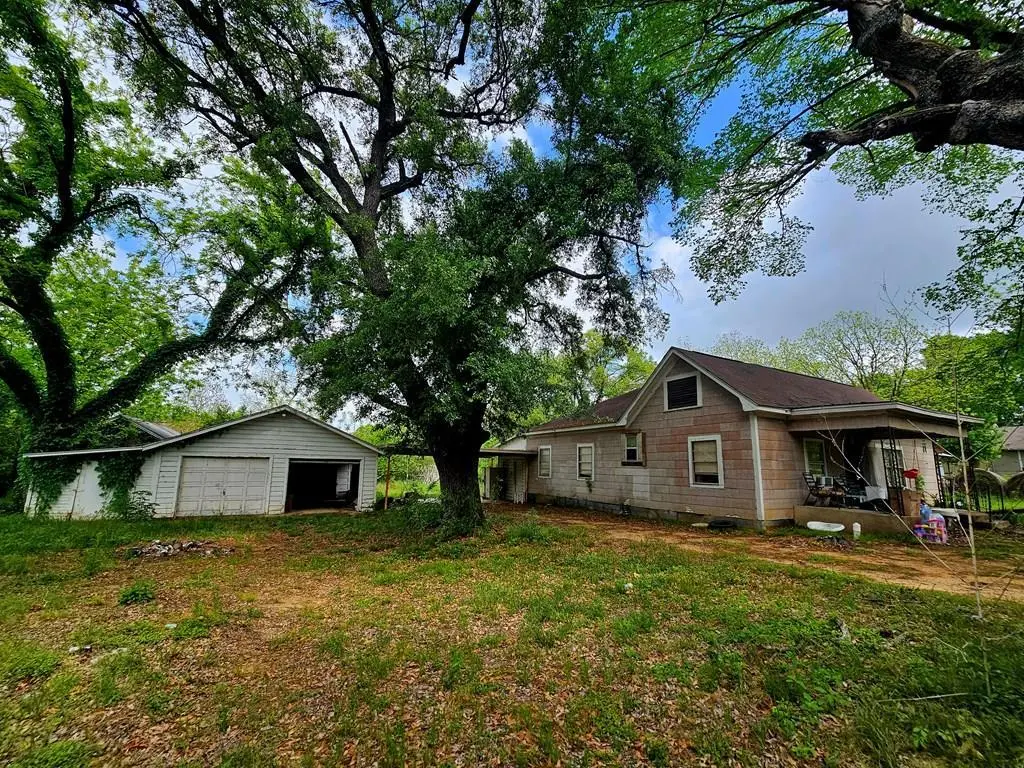
INVESTOR OPPORTUNITY! Charming 1940s farmhouse on 1.4 acres minutes from downtown Trinidad, offers character, space, and strong potential for restoration, rental, or resale. This 3 bed 1 bath home features spacious living & dining areas with original hardwood floors, vintage woodwork, and classic doors that highlight its timeless appeal. The country kitchen retains its original cabinetry and provides a solid footprint for updates. While the home does need repairs and improvements, it presents an excellent opportunity for investors, flippers, or buyers looking to create value and bring new life to a historic property. The exterior offers versatility and added value with an attached carport; oversized, detached 2-car garage with storage; and a separate 2-room frame outbuilding for future expansion, ideal for a workshop, storage, home office, or even potential guest quarters. Additional features include a concrete storm shelter, chicken coop, and partially fenced field. Set beneath mature shade trees, this property provides a peaceful, spacious setting tucked just inside the city limits, an increasingly rare find. Conveniently located close to Lake Trinidad and Cedar Creek Lake, with easy access to Corsicana and Athens, and approximately one hour from the DFW metroplex. A variety of dining options and enchanting nearby winery & longhorn ranch add even more country charm. Whether you're looking for your next project, an investment opportunity, or a property with room to create something special, this one is full of potential. Possible seller financing, contact listing agent for terms.
Key facts
- Vintage woodwork
- Country kitchen
- 1.4 acres
Tags
Property features AI
Finance
- Other: Property sits on approximately 1.4 acres; Will not subdivide; Parcel number available
- Financial info: Listing terms include cash, conventional financing, and seller financing (owner will carry)
- HOA & community: No association
Exterior
- Parking: 2-car garage; Carport (2 spaces); Covered parking for 4 vehicles; Additional parking; Garage with garage door opener and 2-car double doors; garage faces front; Other parking features
- Utilities: City water; City sewer; Well
- Home design: Single family residence; Residential property; One story; Entry level on main floor; Built in 1944
- Construction: Frame and wood construction; Composition roof; Pillar/post/pier foundation
- Exterior features: Storage; Other exterior structures; Outbuilding; Garage(s) as additional structures; Back yard and front yard fencing; Barbed wire and wire fencing; Acreage lot with many trees
Interior
- Kitchen: Disposal; Electric oven; Refrigerator; Other kitchen features
- Bedrooms: 3 bedrooms (primary bedroom on main level)
- Flooring: Hardwood
- Bathrooms: 1 full bathroom
- Heating & cooling: Central heating (electric); Central air; Attic fan; Ceiling fans; Window unit(s)
- Interior features: Cable TV available; Natural woodwork; One living area; One dining area; Room count: 2; One level (single-story)
- Laundry & utility: Washer hookup; Electric dryer hookup
Neighborhood map
What this means for you Summary
Snapshot
- This is a 3-bed/1.0-bath single-family listed at $95k.
Deal economics
- At list price, monthly cash flow is $488 ($6k/yr) — positive.
- The deal already cash-flows at list — no discount required.
- Meets the 1% rule at list price ($2k rent vs $95k).
- Recommended offer: $92k (3.0% below list) — sets the bar for market timing.
- Cap rate 12.5% vs local median 2.5% in Trinidad — top-decile yield for the area; either an underpriced asset or a hidden risk that comps aren't pricing in. Stress-test before assuming the spread holds.
Location & tenants
- Location reads 57/100 on livability (#1,274 in TX) — a working-class tenant base; expect higher turnover. Strengths: cost of living A+, housing A+; Watch: schools F, crime F, amenities F.
- Trinidad ISD (rural): math 40% / reading 45% proficiency, ranked #684 of 1,141 in TX (top 60%) — families likely to look elsewhere, expect single-tenant / working-renter base with shorter leases.
- Market conditions: 162 active listings in the ZIP; 263 units permitted in Henderson County in 2024 (0 in 5+ unit buildings).
Forward outlook
- In year one you build about $2k of equity ($657 loan paydown + $983 appreciation (1.0% local appreciation)).
- At projected returns (1.0% appreciation + 3.0% rent growth), your $27k cash investment doubles in ~4 years — after that, you're playing with house money.
Negotiation context
- It's been on market 33 days — a 3% lower offer ($92k) is reasonable based on typical stale-listing flexibility.
- 6 sale attempts since 3y ago; this cycle's ask has dropped $20k (17%) from the opening price — seller is motivated, your offer sets the floor, not the list.
Risks & watch-outs
- Watch-outs: property tax is 2.8% of price; built in 1944 — expect roof / HVAC / electrical / plumbing capex.
Questions for the listing agent
- It's been on market 33 days. Have you received any prior offers? Is the seller open to a 3% concession, seller financing, or rate buy-down credit?
- Built in 1944 — when were the roof, HVAC, electrical panel, plumbing, and water heater last replaced?
- Property tax is high relative to price — has the assessment been appealed recently, and will the sale trigger a re-assessment?
- Is there a deadline driving the sale (1031 exchange, divorce, estate, relocation)? That informs how much negotiation room exists.
- Schools are F-rated, which usually means shorter tenancies and higher turnover. Who's the typical renter profile here, and what's been the actual vacancy rate?
- Crime grade is F in this area — have there been break-ins, vandalism, or insurance claims at this property in the last 3 years? What carrier currently insures it and at what premium?
- What's the average days-on-market for RENTAL listings here right now (not sales)? A rising rental-DOM trend means longer vacancies and softer asking-rent achievability than the comps imply.
- What's the recent tenant-quality profile in this submarket — average credit score on applications, eviction rate, late-payment / NSF rate, and stable-employment percentage? A property-management company in the area should have these aggregated.
- How much new for-sale + rental construction is in the pipeline within 1–3 miles? Heavy new supply typically softens prices + rents 12–24 months out; constrained supply supports both.
Investment metrics
- 1% rule
- 1.66% ✓
- Cap rate
- 12.46%
- Cash-on-cash
- 22.03%
- DSCR
- 1.98
- GRM
- 5.0
CMA / ARV
- ARV (on-the-fly)
- $185,748
- Comps found
- 2
Show comp detail 2 sales within ~0.75 mi
| Address | Dist | Beds/Ba | Sqft | Sold | Price | $/sf | Match |
|---|---|---|---|---|---|---|---|
| 616 French St | 0.42mi | 2/2.0 (-1) | 1,500 (+11%) | 6mo | $185,000 | $123 | 48 |
| 705 French St | 0.48mi | 3/1.0 | 1,512 (+12%) | 13mo | $208,500 | $138 | 46 |
Match score weights: distance 35% · size 25% · config 20% · recency 20%. Top-matched comps best support the ARV.
Projected returns pro-forma
1.03% appreciation · 3.0% rent growth · sell at horizon
- IRR
- 24.3%
- Equity multiple
- 2.25×
- Total profit
- $33,118
- Equity at exit
- $32,602
- IRR
- 27.1%
- Equity multiple
- 4.28×
- Total profit
- $87,265
- Equity at exit
- $43,458
Cash invested: $26,600 (down + closing). Projections, not guarantees.
Landlord ↔ Tenant lean methodology
- Overall (STATE)
- 87 Strongly Landlord-Friendly
- State Texas
- 87 Strongly Landlord-Friendly · R+5
- County
- — inherits STATE
- City
- — inherits STATE
ZIP-level market 75163
- Home prices YoY
- 0.5%
- Active inventory
- 162
- Price-to-rent
- 5.0×
Monthly cashflow live
- Estimated rent
- $1,576 medium interval (Pro) →
- Mortgage (P&I)
- −$498
- Tax from tax record
- −$219 /mo · $2,632/yr
- Insurance
- −$40
- HOA
- −$0
- Vacancy / Maint / Mgmt
- −$331
- Net cashflow
- $488
Break-even live
UW: 25.0% down · 7.5% · 30yr · 1.5% tax · 5.0% vac · 8.0% maint · 8.0% mgmt
Financing live
Cash to close
- Down payment
- $23,750
- Closing costs
- $2,850
- Reserves months
- —
- Total cash needed
- —
Loan-product check · same deal, 3 products live
Conventional
25% down · 7.5% · 30yr
- Down + closing
- —
- Monthly P&I
- —
- Monthly cashflow
- —
- DSCR
- —
- Eligible?
- —
Personal DTI + credit; lowest rate.
DSCR
20% down · 8.5% · 30yr
- Down + closing
- —
- Monthly P&I
- —
- Monthly cashflow
- —
- DSCR
- —
- Eligible?
- —
No personal income docs; deal must DSCR.
Hard money
10% down · 12.0% · 12mo
- Down + closing
- —
- Monthly P&I
- —
- Monthly cashflow
- —
- DSCR
- —
- Eligible?
- —
Short-term bridge; refi at stabilization.
Listing history 15 events
-
2026-06-18days on market $95,000 Active 33 DOM
-
2026-06-17days on market $95,000 Active 32 DOM
-
2026-06-16days on market $95,000 Active 31 DOM
-
2026-06-15days on market $95,000 Active 30 DOM
-
2026-06-15days on market $95,000 Active 29 DOM
-
2026-06-13days on market $95,000 Active 28 DOM
-
2026-06-12days on market $95,000 Active 27 DOM
-
2026-06-09days on market $95,000 Active 24 DOM
-
2026-06-08days on market $95,000 Active 23 DOM
-
2026-06-08days on market $95,000 Active 22 DOM
-
2026-06-05days on market $95,000 Active 20 DOM
-
2026-06-03days on market $95,000 Active 18 DOM
-
2026-06-02days on market $95,000 Active 17 DOM
-
2026-06-02remarks 695-char remark
-
2026-06-02$95,000 Active 16 DOM
ⓘ Source: listings_history table (triggers on properties + properties_extension) + one-shot
backfill from property_details.listing_events for pre-trigger history.
Tax reassessment forecast TX · Resets to sale price
- Current annual tax
- $2,632 · $219/mo
- Projected year-2 tax
- $2,632 · $219/mo
- Expected delta
- $0/yr ($0/mo · 0.0%)
ⓘ Screening estimate from a state-policy table — verify with the county assessor before closing.
Nearby sold comps map
Loading sold comps map…
Walkable amenities ~0.75 mi
Loading nearby amenities…
Taxation est. · year 1
- Rental income
- $18,917
- − Mortgage interest
- −$5,321
- − Property taxes
- −$2,632
- − Insurance
- −$475
- − Repairs & maintenance
- −$1,513
- − Management
- −$1,513
- − Depreciation
- −$2,764
- Taxable income
- $4,698
- Est. tax owed @ 24.0%
- −$1,127
- After-tax cash flow
- $4,731/yr
For passive investors: Depreciation is non-cash, so a rental often shows a tax loss while cash-flowing — sheltering income. Rental losses are passive: they offset passive income freely, and up to $25,000/yr can offset ordinary (W-2) income if you actively participate and your MAGI is under $100k (phasing out to $0 by $150k); unused losses carry forward. On sale, claimed depreciation is recaptured at up to 25%, and gains may owe capital-gains tax (a 1031 exchange can defer both). Figures are a year-1 estimate at your 24.0% rate — not tax advice; consult a CPA.
Schools (NCES district)
- District
- Trinidad ISD
- NCES district ID
- 4843170
- Math proficiency
- 40% ▬ 0.00%
- Reading proficiency
- 45% ▲ 5.00%
- Median HH income
- $33,339
- Composite
- 37.29/100
- National rank
- #8962
- State rank
- #684 of 1141 in TX
Livability — Trinidad
- Score
- 57/100
- State rank
- #1274
- US rank
- #22143
Category grades
Schools grade is shown separately in the Schools card above.
Census & demographics
- Census place
- Trinidad, TX
- City population
- 2,569
- Population (ZIP)
- 2,569
Population outlook (Henderson County) Hauer SSP2
- Today (2025)
- 80,471 people
- By 2030
- 80,608 · +0.2%
- By 2040
- 80,087 · -0.5%
- By 2050
- 78,208 · -2.8%
- By 2075
- 72,423 · -10.0%
- By 2100
- 61,012 · -24.2%
Race, ethnicity, and origin ACS 2023
- Neighborhood character
- Predominantly White (77%)
- Race & ethnicity
- White 77% Two or more races 11% Hispanic / Latino 9% Black 6%
- Hispanic origin (detail)
- Mexican 8%
- Common ancestry
- Serbian 3% Lithuanian 1% European 1%
- Foreign-born
- 7% · Canada, Jamaica
- Languages at home
- 84% English-only · Arabic 10% Spanish 6%
Political lean MEDSL · Henderson
- 2024 margin
- Solid R (+63.5) · D 18.0% · R 81.4%
- 2008→2024 swing
- -18.8pp toward R · 2008: -44.6pp · 2024: -63.5pp
- All cycles
- 2024: R+63.5 2020: R+60.2 2016: R+60.0 2012: R+54.8 2008: R+44.6
Not yet ingested
- Civics
- —
Market trends
- HPI YoY
- ▲ 1.03%
- Current HPI
- 211.6125
- Rent YoY
- —
- Metro
- —
- State GDP YoY
- ▲ 3.95%
- F500 in state
- 110
Industry mix (Fortune 500 HQ in TX)
| Industry | F500 HQs | Revenue |
|---|---|---|
| Energy | 16 | $1,198B |
|
||
| Technology | 5 | $198B |
|
||
| Engineering / Construction | 4 | $72B |
|
||
| Energy Services | 3 | $60B |
|
||
| Utilities | 3 | $41B |
|
||
| Healthcare | 2 | $330B |
|
||
Price history
-13.6% since first listed14 events — show timeline
- 2026-06-01 Price Changed $95,000 NTREIS
- 2026-06-01 Relisted — NTREIS
- 2026-06-01 Relisted — HCBOR
- 2026-06-01 Price Changed $95,000 HCBOR
- 2026-04-11 Listed $115,000 HCBOR
- 2026-04-10 Listed $115,000 NTREIS
- 2024-03-25 Sold (Public Records) — Public Records
- 2024-03-21 Sold (MLS) — NTREIS
- 2024-03-21 Sold (MLS) — HCBOR
- 2024-02-05 Delisted — HCBOR
- 2024-02-05 Pending — NTREIS
- 2023-09-19 Listed $110,000 NTREIS
- 2023-09-19 Listed $110,000 HCBOR
- 2017-01-31 Sold (Public Records) — Public Records
Property tax history
+8.5%/yrLatest (2025): $2,632 · +106.3% YoY. Source: county tax records.
Cash-flow waterfall
monthlySold comps — $/sqft
last 12 mo · ≤1 miLoading sold comps…