21210 Chesterfield Ave · Ettrick, VA
Flood risk 1/10 · Minimal
- FEMA flood zone
- X (unshaded)
- Chance of flooding over 30 yrs
- 0.0%
- Est. flood insurance / yr
- $507 – $1,088
Fire risk 3/10 · Minor
- Est. fire insurance / yr
- $666 – $1,236
Heat risk 8/10 · Major
- Hot days now (above 108°F)
- 7 days/yr
- Hot days in 30 yrs
- 16 days/yr
Wind risk 6/10 · Moderate
- Chance of severe wind over 30 yrs
- 42.0%
Air-quality risk 2/10 · Minimal
- Unhealthy air days now
- 0 days/yr
- Unhealthy air days in 30 yrs
- 1 days/yr
Risk factors via First Street. Map © Google.
Why this score? — see what drove the C grade
The composite is a weighted blend of 9 inputs, each scored 0–100. Each bar is that input's sub-score; the figure is the points it added to the 100-point composite (weight × sub-score).
- ARV discount +15.0/15.0
- Cash flow +12.7/30.0
- Appreciation +5.7/10.0
- Schools +5.2/10.0
- Rent growth +4.0/5.0
- Livability +4.0/5.0
- DSCR +3.8/10.0
- 1% rule +3.0/10.0
- Condition / age +2.5/5.0
$169,000
🖨 Deal sheet 📄 Offer letter ✓ Due diligence
Listing remarks MLS
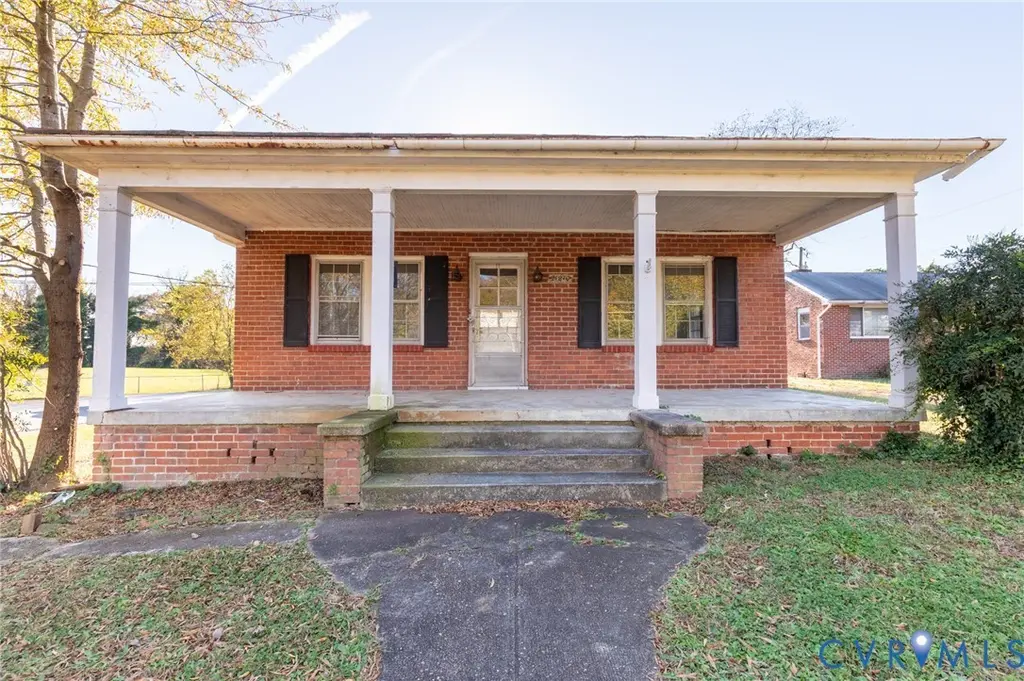
Chesterfield Schools! Great investment / rental property. Brick home, metal roof, wood floors, large lot. Property needs work. Property and out buildings convey in AS IS condition.
Key facts
- Metal roof
- Chesterfield schools
- Wood floors
Tags
Neighborhood map
What this means for you Summary
Snapshot
- This is a 2-bed/1.0-bath townhouse listed at $169k.
Deal economics
- At list price, monthly cash flow is $-18 ($-217/yr) — negative.
- To cash-flow at today's rent, offer at most $166k (1.9% below list).
- To meet the 1% rule (rent ≥ 1% of price), the offer needs to be $135k (20.2% below list).
- Recommended offer: $135k (20.2% below list) — sets the bar for 1% rule.
Location & tenants
- Location reads 79/100 on livability (#65 in VA, #2,105 nationally) — a middle-class / working-renter tenant base. Strengths: cost of living A+, health & safety A+, housing A; Watch: commute C-, amenities F, employment D-.
- Chesterfield County Public School District (suburban): math 52% / reading 64% proficiency, ranked #57 of 131 in VA (top 44%) — acceptable for families but not a draw, mixed tenant base, ~2y average lease.
- Market conditions: Rents rising fast (+5.9%/yr); 290 active listings in the ZIP; 40 comparable units currently listed for rent nearby; rentals at typical pace (median 20d on market — plan ~3-4 weeks tenant-placement turnaround); 2,307 units permitted in Chesterfield County in 2024 (462 in 5+ unit buildings).
Forward outlook
- In year one you build about $4k of equity ($1k loan paydown + $2k appreciation (1.4% local appreciation)).
- Chesterfield County population projected at +20% by 2050 — long-run rental-demand tailwind backs the buy-and-hold thesis.
- At projected returns (1.4% appreciation + 5.9% rent growth), your $47k cash investment doubles in ~8 years — after that, you're playing with house money.
- By year 9, paydown + projected appreciation supports a ~$32k cash-out refi (75% LTV) — recoverable capital for the next deal without selling this one.
Negotiation context
- It's been on market 54 days — a 3% lower offer ($164k) is reasonable based on typical stale-listing flexibility.
- 3 sale attempts since 10y ago; this cycle's ask has dropped $20k (11%) from the opening price — seller is motivated, your offer sets the floor, not the list.
- Current owner paid $75k; list at $169k implies a 125% gain — meaningful room to come down on a strong offer.
Risks & watch-outs
- Watch-outs: built in 1937 — expect roof / HVAC / electrical / plumbing capex.
- Climate carrying-cost: major wind risk, 42% chance of damaging wind over 30y; extreme-heat days projected 7→16/yr by 2055 (HVAC capex compounding) — expect insurance premiums to compound above CPI over the hold.
Questions for the listing agent
- What do current leases actually rent for vs. the listed asking? Can we see a recent rent roll and the last 12 months of T-12 income?
- It's been on market 54 days. Have you received any prior offers? Is the seller open to a 20% concession, seller financing, or rate buy-down credit?
- Built in 1937 — when were the roof, HVAC, electrical panel, plumbing, and water heater last replaced?
- Is there a deadline driving the sale (1031 exchange, divorce, estate, relocation)? That informs how much negotiation room exists.
- Schools are A-rated — typically a magnet for longer-tenancy family renters. What's the average tenant stay here, and is there a school-zone premium baked into asking?
- What's the average days-on-market for RENTAL listings here right now (not sales)? A rising rental-DOM trend means longer vacancies and softer asking-rent achievability than the comps imply.
- What's the recent tenant-quality profile in this submarket — average credit score on applications, eviction rate, late-payment / NSF rate, and stable-employment percentage? A property-management company in the area should have these aggregated.
- How much new for-sale + rental construction is in the pipeline within 1–3 miles? Heavy new supply typically softens prices + rents 12–24 months out; constrained supply supports both.
Investment metrics
- 1% rule
- 0.80% ✗
- Cap rate
- 6.16%
- Cash-on-cash
- -0.46%
- DSCR
- 0.98
- GRM
- 10.4
CMA / ARV
- ARV (median comp)
- $213,255
- List price
- $169,000
- Delta
- -20.75%
- Verdict
- UNDERPRICED
- Comps
- 20 within 1.0 mi
Projected returns pro-forma
1.45% appreciation · 5.89% rent growth · sell at horizon
- IRR
- 3.9%
- Equity multiple
- 1.21×
- Total profit
- $9,753
- Equity at exit
- $61,675
- IRR
- 9.5%
- Equity multiple
- 2.29×
- Total profit
- $60,885
- Equity at exit
- $85,132
Cash invested: $47,320 (down + closing). Projections, not guarantees.
Landlord ↔ Tenant lean methodology
- Overall (STATE)
- 55 Moderately Landlord-Leaning
- State Virginia
- 55 Moderately Landlord-Leaning · D+2
- County
- — inherits STATE
- City
- — inherits STATE
ZIP-level market 23803
- Home prices YoY
- 0.3%
- Rents YoY
- 5.9%
- Active inventory
- 290
- Price-to-rent
- 10.4×
Monthly cashflow live
- Estimated rent
- $1,349 high interval (Pro) →
- Mortgage (P&I)
- −$886
- Tax from tax record
- −$127 /mo · $1,525/yr
- Insurance
- −$70
- HOA
- −$0
- Vacancy / Maint / Mgmt
- −$283
- Net cashflow
- $-18
Break-even live
UW: 25.0% down · 7.5% · 30yr · 1.5% tax · 5.0% vac · 8.0% maint · 8.0% mgmt
Financing live
Cash to close
- Down payment
- $42,250
- Closing costs
- $5,070
- Reserves months
- —
- Total cash needed
- —
Loan-product check · same deal, 3 products live
Conventional
25% down · 7.5% · 30yr
- Down + closing
- —
- Monthly P&I
- —
- Monthly cashflow
- —
- DSCR
- —
- Eligible?
- —
Personal DTI + credit; lowest rate.
DSCR
20% down · 8.5% · 30yr
- Down + closing
- —
- Monthly P&I
- —
- Monthly cashflow
- —
- DSCR
- —
- Eligible?
- —
No personal income docs; deal must DSCR.
Hard money
10% down · 12.0% · 12mo
- Down + closing
- —
- Monthly P&I
- —
- Monthly cashflow
- —
- DSCR
- —
- Eligible?
- —
Short-term bridge; refi at stabilization.
Rent comps 40 comps
| Address | Beds | Baths | Sqft | Rent | $/sqft | DOM | Units | Dist |
|---|---|---|---|---|---|---|---|---|
| 3301 Main St Unit A South Chesterfield, VA | 2.0 | 1.0 | 990 | $1,150 | $1.16 | 1d | 1 | 0.17mi |
| 3716 Totty St South Chesterfield, VA | 3.0 | 1.0 | 1092 | $1,700 | $1.56 | 43d | 1 | 0.27mi |
| 21512 Jackson St South Chesterfield, VA | 1.0 | 1.0 | 1010 | $1,150 | $1.14 | 43d | 1 | 0.30mi |
| 214 N Dunlop St Unit 119 Petersburg, VA | 2.0 | 2.0 | 988 | $1,399 | $1.42 | 43d | 1 | 0.58mi |
| 214 N Dunlop St Petersburg, VA | 1.0–2.0 | 1.0–2.0 | 799 | $1,395 | $1.74 | 1d | 11 | 0.58mi |
| 214 N Dunlop St Unit 404 Petersburg, VA | 2.0 | 2.0 | 863 | $1,400 | $1.62 | 43d | 1 | 0.58mi |
| 214 N Dunlop St Apt 305 Petersburg, VA | 2.0 | 2.0 | 945 | $1,350 | $1.43 | 44d | 1 | 0.58mi |
| 20900 Riverterrace Rd Petersburg, VA | 2.0 | 1.0 | 950 | $1,262 | $1.33 | 1d | 4 | 0.60mi |
| 714 High St Apt E Petersburg, VA | 2.0 | 2.0 | 924 | $1,300 | $1.41 | 21d | 1 | 0.61mi |
| 214 N Dunlop St Unit 400 Petersburg, VA | 2.0 | 2.0 | 892 | $1,500 | $1.68 | 43d | 1 | 0.64mi |
| 20304 Loyal Ave South Chesterfield, VA | 3.0 | 1.0 | 991 | $1,650 | $1.66 | 20d | 1 | 0.69mi |
| 406 Bradsher Ave Unit A Colonial Heights, VA | 2.0 | 1.0 | 940 | $1,050 | $1.12 | 23d | 1 | 0.70mi |
| 801 Hinton St Petersburg, VA | 1.0–2.0 | 1.0–2.0 | 834 | $1,399 | $1.68 | 19d | 2 | 0.71mi |
| 801 Hinton St Petersburg, VA | 1.0–2.0 | 1.0–2.0 | 745 | $1,395 | $1.87 | 1d | 8 | 0.71mi |
| 712 W Washington St Unit B Petersburg, VA | 2.0 | 1.0 | 1209 | $1,250 | $1.03 | 23d | 1 | 0.80mi |
| 232 High St Unit B Petersburg, VA | 1.0 | 1.0 | 750 | $1,400 | $1.87 | 1d | 1 | 0.87mi |
| 226 High St Petersburg, VA | 1.0 | 1.0 | 922 | $1,500 | $1.63 | 2d | 1 | 0.87mi |
| 212 S Dunlop St Petersburg, VA | 2.0 | 1.0 | 700 | $1,250 | $1.79 | 43d | 1 | 0.94mi |
| 115 Pine St Unit 115 Petersburg, VA | 3.0 | 1.5 | 1400 | $1,462 | $1.04 | 43d | 1 | 0.96mi |
| 929 Farmer St Petersburg, VA | 2.0 | 1.0 | 850 | $895 | $1.05 | 23d | 1 | 0.98mi |
| 25 W Bank St Petersburg, VA | 1.0 | 1.0 | 765 | $995 | $1.30 | 1d | 7 | 0.99mi |
| 114 Lee Ave Colonial Heights, VA | 2.0 | 1.5 | 1088 | $1,750 | $1.61 | 23d | 1 | 1.00mi |
| 230 N Sycamore St Petersburg, VA | 1.0 | 1.0 | 622 | $1,150 | $1.85 | 1d | 7 | 1.04mi |
| 16 S Market St Petersburg, VA | 1.0–2.0 | 1.0–2.0 | 769 | $2,312 | $3.01 | 1d | 17 | 1.06mi |
| 109 Perry St Petersburg, VA | 1.0–2.0 | 1.0–2.0 | 787 | $1,577 | $2.00 | 2d | 15 | 1.07mi |
| 9 S Market St Petersburg, VA | 1.0–2.0 | 1.0–2.0 | 721 | $1,350 | $1.87 | 17d | 6 | 1.08mi |
| 325 Brown St Petersburg, VA | 1.0–2.0 | 1.0–2.0 | 775 | $1,310 | $1.69 | 21d | 2 | 1.10mi |
| 325 Brown St Petersburg, VA | 1.0–2.0 | 1.0–2.0 | 797 | $1,395 | $1.75 | 14d | 9 | 1.10mi |
| 408 S West St Petersburg, VA | 2.0 | 1.0 | 900 | $1,095 | $1.22 | 21d | 1 | 1.10mi |
| 15 N Union St Petersburg, VA | 1.0 | 1.0 | 660 | $1,072 | $1.62 | 17d | 9 | 1.13mi |
| 1111 Stainback St Apt 2 Petersburg, VA | 2.0 | 1.0 | 750 | $895 | $1.19 | 43d | 1 | 1.13mi |
| 1121 Stainback St Unit 5202 Petersburg, VA | 2.0 | 1.0 | 800 | $995 | $1.24 | 43d | 1 | 1.14mi |
| 1121 Stainback St Unit 2108 Petersburg, VA | 2.0 | 1.0 | 800 | $995 | $1.24 | 23d | 1 | 1.14mi |
| 30 Franklin St Petersburg, VA | 2.0 | 1.0–2.0 | 755 | $1,550 | $2.05 | 19d | 1 | 1.23mi |
| 147 Witten St Petersburg, VA | 3.0 | 1.0 | 1170 | $1,495 | $1.28 | 10d | 1 | 1.27mi |
| 250 E Bank St Petersburg, VA | 2.0 | 1.0–2.0 | 862 | $1,509 | $1.75 | 1d | 19 | 1.34mi |
| 20308 Hickory Branch Dr South Chesterfield, VA | 3.0 | 2.0 | 1484 | $1,850 | $1.25 | 3d | 1 | 1.35mi |
| 500 Floral Ave Colonial Heights, VA | 3.0 | 2.0 | 1196 | $1,895 | $1.58 | 23d | 1 | 1.35mi |
| 707 Hamilton Ave Colonial Heights, VA | 2.0 | 1.0 | 999 | $1,325 | $1.33 | 11d | 1 | 1.35mi |
| 1118 Jett Ave Colonial Heights, VA | 2.0 | 1.0 | 780 | $1,400 | $1.79 | 11d | 1 | 1.40mi |
Listing history 13 events
-
2026-05-11status Pending 181-char remark
Show marketing remark (181 chars)
Chesterfield Schools! Great investment / rental property. Brick home, metal roof, wood floors, large lot. Property needs work. Property and out buildings convey in AS IS condition.
-
2026-04-22price $169,000 181-char remark
Show marketing remark (181 chars)
Chesterfield Schools! Great investment / rental property. Brick home, metal roof, wood floors, large lot. Property needs work. Property and out buildings convey in AS IS condition.
-
2026-03-19price $179,000 181-char remark
Show marketing remark (181 chars)
Chesterfield Schools! Great investment / rental property. Brick home, metal roof, wood floors, large lot. Property needs work. Property and out buildings convey in AS IS condition.
-
2026-03-17$189,000 Active 181-char remark
Show marketing remark (181 chars)
Chesterfield Schools! Great investment / rental property. Brick home, metal roof, wood floors, large lot. Property needs work. Property and out buildings convey in AS IS condition.
-
2026-02-27historical
-
2025-11-14$189,000 Active
-
2019-05-22soldstatus $75,000
-
2018-03-22soldstatus $31,909
-
2018-03-06soldstatus $22,500
-
2017-02-13historical
-
2017-02-13status Pending
-
2017-01-25price $65,000
-
2016-11-17$80,000 Active
ⓘ Source: listings_history table (triggers on properties + properties_extension) + one-shot
backfill from property_details.listing_events for pre-trigger history.
Tax reassessment forecast VA · Resets to sale price
- Current annual tax
- $1,525 · $127/mo
- Projected year-2 tax
- $1,525 · $127/mo
- Expected delta
- $0/yr ($0/mo · 0.0%)
ⓘ Screening estimate from a state-policy table — verify with the county assessor before closing.
Climate risk First Street
- Flood 1/10 Low FEMA zone X (unshaded) · 0% chance over 30 yrs
- Wildfire 3/10 Moderate
- Heat 8/10 Severe 7 d/yr ≥108°F today · 16 d/yr by 30 yrs out
- Wind 6/10 Major 42% chance of damaging wind over 30 yrs
- Air quality 2/10 Low 0 unhealthy d/yr today · 1 by 30 yrs out
Nearby sold comps map
Loading sold comps map…
Walkable amenities ~0.75 mi
Loading nearby amenities…
Taxation est. · year 1
- Rental income
- $16,188
- − Mortgage interest
- −$9,467
- − Property taxes
- −$1,525
- − Insurance
- −$845
- − Repairs & maintenance
- −$1,295
- − Management
- −$1,295
- − Depreciation
- −$4,916
- Taxable loss
- −$3,156
- Est. tax savings @ 24.0%
- +$757
- After-tax cash flow
- $540/yr
For passive investors: Depreciation is non-cash, so a rental often shows a tax loss while cash-flowing — sheltering income. Rental losses are passive: they offset passive income freely, and up to $25,000/yr can offset ordinary (W-2) income if you actively participate and your MAGI is under $100k (phasing out to $0 by $150k); unused losses carry forward. On sale, claimed depreciation is recaptured at up to 25%, and gains may owe capital-gains tax (a 1031 exchange can defer both). Figures are a year-1 estimate at your 24.0% rate — not tax advice; consult a CPA.
Schools (NCES district)
- District
- Chesterfield County Public School District
- NCES district ID
- 5100840
- Math proficiency
- 52% ▼ -30.00%
- Reading proficiency
- 64% ▼ -15.00%
- Median HH income
- $72,821
- Composite
- 51.56/100
- National rank
- #1712
- State rank
- #57 of 131 in VA
Livability — Ettrick
- Score
- 79/100
- State rank
- #65
- US rank
- #2105
Category grades
Schools grade is shown separately in the Schools card above.
Census & demographics
- Census place
- Ettrick, VA
- County
- Chesterfield County · 406,988 people
- Metro
- Richmond, VA
- Population (ZIP)
- 42,012
- Household income
- $57,813
- Rent vs Own
- Severe rent burden
- 2485.0
Population outlook (Chesterfield County) Hauer SSP2
- Today (2025)
- 377,190 people
- By 2030
- 395,710 · +4.9%
- By 2040
- 427,694 · +13.4%
- By 2050
- 452,706 · +20.0%
- By 2075
- 505,533 · +34.0%
- By 2100
- 521,282 · +38.2%
Race, ethnicity, and origin ACS 2023
- Neighborhood character
- Diverse neighborhood (Simpson 0.57)
- Race & ethnicity
- Black 58% White 31% Hispanic / Latino 6% Two or more races 5%
- Hispanic origin (detail)
- Mexican 1% Puerto Rican 2%
- Common ancestry
- Italian 1% Romanian 1% Slovak 1%
- Foreign-born
- 4% · Canada
- Languages at home
- 93% English-only · Spanish 5%
Political lean MEDSL · Chesterfield
- 2024 margin
- Lean D (+9.0) · D 53.8% · R 44.8% · Other 1.4%
- 2008→2024 swing
- +16.4pp toward D · 2008: -7.5pp · 2024: 9.0pp
- All cycles
- 2024: D+9.0 2020: D+6.7 2016: R+2.2 2012: R+7.1 2008: R+7.5
Not yet ingested
- Civics
- —
Market trends
- HPI YoY
- ▲ 1.45%
- Current HPI
- 480.5365
- Rent YoY
- ▲ 5.89%
- Metro
- Richmond, VA
- State GDP YoY
- ▲ 2.40%
- F500 in state
- 50
Industry mix (Fortune 500 HQ in VA)
| Industry | F500 HQs | Revenue |
|---|---|---|
| Aerospace / Defense | 4 | $236B |
|
||
| Technology / Defense | 3 | $32B |
|
||
| Financial Services | 2 | $176B |
|
||
| Utilities | 2 | $27B |
|
||
| Insurance | 2 | $25B |
|
||
| Technology | 2 | $15B |
|
||
Price history
+111.2% since first listed13 events — show timeline
- 2026-05-11 Pending — CVRMLS
- 2026-04-22 Price Changed $169,000 CVRMLS
- 2026-03-19 Price Changed $179,000 CVRMLS
- 2026-03-17 Listed $189,000 CVRMLS
- 2026-02-27 Listing Removed — CVRMLS
- 2025-11-14 Listed $189,000 CVRMLS
- 2019-05-22 Sold (Public Records) $75,000 Public Records
- 2018-03-22 Sold (Public Records) $31,909 Public Records
- 2018-03-06 Sold (Public Records) $22,500 Public Records
- 2017-02-13 Listing Removed — CVRMLS
- 2017-02-13 Pending — CVRMLS
- 2017-01-25 Price Changed $65,000 CVRMLS
- 2016-11-17 Listed $80,000 CVRMLS
Property tax history
+5.0%/yrLatest (2025): $1,525 · +5.9% YoY. Source: county tax records.
Cash-flow waterfall
monthlySold comps — $/sqft
last 12 mo · ≤1 miLoading sold comps…