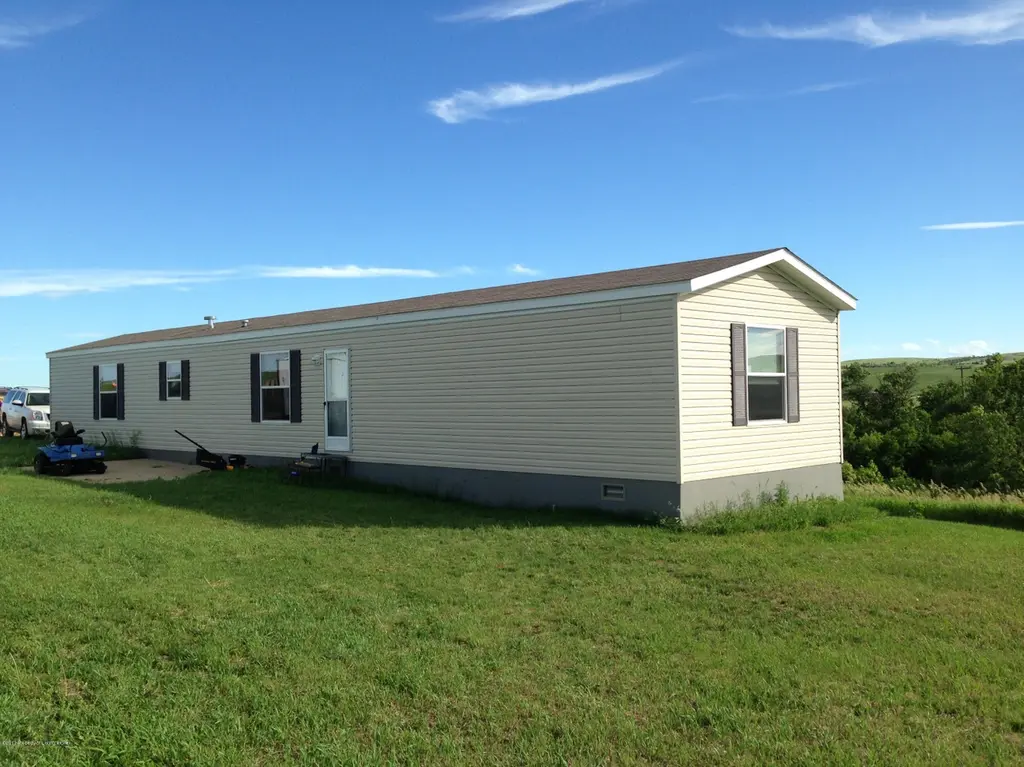
12656 22nd ST St NW · Watford City, ND
Flood risk No data
- FEMA flood zone
- —
- Chance of flooding over 30 yrs
- —
- Est. flood insurance / yr
- —
Fire risk No data
- Est. fire insurance / yr
- —
Heat risk 2/10 · Minimal
- Hot days now (above threshold)
- 7 days/yr
- Hot days in 30 yrs
- 13 days/yr
Wind risk No data
- Chance of severe wind over 30 yrs
- —
Air-quality risk 4/10 · Minor
- Unhealthy air days now
- 4 days/yr
- Unhealthy air days in 30 yrs
- 4 days/yr
Risk factors via First Street. Map © Google.
Why this score? — see what drove the D grade
The composite is a weighted blend of 9 inputs, each scored 0–100. Each bar is that input's sub-score; the figure is the points it added to the 100-point composite (weight × sub-score).
- Cash flow +14.2/30.0
- ARV discount +7.5/15.0
- DSCR +4.3/10.0
- 1% rule +4.0/10.0
- Livability +3.7/5.0
- Schools +3.2/10.0
- Rent growth +2.5/5.0
- Condition / age +2.5/5.0
- Appreciation +0.0/10.0
$179,900
🖨 Deal sheet (PDF) 📄 Offer letter ✓ Due diligence
Key facts
- Built 2010
Neighborhood map
What this means for you Summary
Snapshot
- This is a 3-bed/2.0-bath single-family listed at $180k.
Deal economics
- At list price, monthly cash flow is $30 ($357/yr) — positive.
- The deal already cash-flows at list — no discount required.
- To meet the 1% rule (rent ≥ 1% of price), the offer needs to be $161k (10.4% below list).
- Recommended offer: $161k (10.4% below list) — sets the bar for 1% rule.
- Cap rate 6.5% vs local median 2.5% in Watford City — top-decile yield for the area; either an underpriced asset or a hidden risk that comps aren't pricing in. Stress-test before assuming the spread holds.
Location & tenants
- Location reads 73/100 on livability (#39 in ND) — a middle-class / working-renter tenant base. Strengths: employment A+, housing A+, health & safety A+; Watch: amenities F, commute F.
- Mckenzie County 1 (rural): math 33% / reading 36% proficiency, ranked #34 of 53 in ND (top 64%) — families likely to look elsewhere, expect single-tenant / working-renter base with shorter leases.
- Zoned schools: Badlands Elementary School (math 37% / reading 47%, grade F, #118 of 236 statewide, top 54%, 566 students, 42% FRL); Watford City Middle School (math 30% / reading 36%, grade F, #29 of 35 statewide, top 82%, 455 students, 33% FRL); Watford City High School (math 22% / reading 22%, grade F, #128 of 144 statewide, top 90%, 477 students, 25% FRL).
- Market conditions: 180 active listings in the ZIP; solid renter incomes; 38 units permitted in McKenzie County in 2024 (0 in 5+ unit buildings).
Forward outlook
- Local home prices are declining (-3.0%/yr); year-one equity from $1k of loan paydown is wiped out by about $5k of value loss. Plan a longer hold.
- McKenzie County population projected at +180% by 2050 — long-run rental-demand tailwind backs the buy-and-hold thesis.
Negotiation context
- Only 0 days on market — expect competitive offers; lowballing is unlikely to land.
Questions for the listing agent
- Is there a deadline driving the sale (1031 exchange, divorce, estate, relocation)? That informs how much negotiation room exists.
- Schools are D-rated, which usually means shorter tenancies and higher turnover. Who's the typical renter profile here, and what's been the actual vacancy rate?
- The area grade is low — what's the realistic commute time and amenity access for the typical tenant pool here? Any planned neighborhood developments (good or bad) we should know about?
- What's the average days-on-market for RENTAL listings here right now (not sales)? A rising rental-DOM trend means longer vacancies and softer asking-rent achievability than the comps imply.
- What's the recent tenant-quality profile in this submarket — average credit score on applications, eviction rate, late-payment / NSF rate, and stable-employment percentage? A property-management company in the area should have these aggregated.
- How much new for-sale + rental construction is in the pipeline within 1–3 miles? Heavy new supply typically softens prices + rents 12–24 months out; constrained supply supports both.
Investment metrics
- 1% rule
- 0.90% ✗
- Cap rate
- 6.49%
- Cash-on-cash
- 0.71%
- DSCR
- 1.03
- GRM
- 9.3
CMA / ARV
No comps found within radius.
Projected returns pro-forma
-3.0% appreciation · 3.0% rent growth · sell at horizon
- IRR
- -15.2%
- Equity multiple
- 0.46×
- Total profit
- $-27,231
- Equity at exit
- $26,824
- IRR
- -6.6%
- Equity multiple
- 0.58×
- Total profit
- $-21,172
- Equity at exit
- $15,554
Cash invested: $50,372 (down + closing). Projections, not guarantees.
Landlord ↔ Tenant lean methodology
- Overall (STATE)
- 82 Strongly Landlord-Friendly
- State North Dakota
- 82 Strongly Landlord-Friendly · R+20
- County
- — inherits STATE
- City
- — inherits STATE
ZIP-level market 58854
- Home prices YoY
- -12.1%
- Active inventory
- 180
- Price-to-rent
- 9.3×
Monthly cashflow live
- Estimated rent
- $1,611 medium interval (Pro) →
- Mortgage (P&I)
- −$943
- Tax est. 1.5%
- −$225 /mo · $2,698/yr
- Insurance
- −$75
- HOA
- −$0
- Vacancy / Maint / Mgmt
- −$338
- Net cashflow
- $30
Break-even live
Sensitivity live
| Price | -10% $154 | -5% $92 | +0% $30 | +5% $-32 | +10% $-95 |
|---|---|---|---|---|---|
| Rent | -10% $-98 | -5% $-34 | +0% $30 | +5% $93 | +10% $157 |
| Rate | -1.0pp $120 | -0.5pp $76 | base $30 | +0.5pp $-17 | +1.0pp $-64 |
UW: 25.0% down · 7.5% · 30yr · 1.5% tax · 5.0% vac · 8.0% maint · 8.0% mgmt
Financing live
Cash to close
- Down payment
- $44,975
- Closing costs
- $5,397
- Reserves months
- —
- Total cash needed
- —
Loan-product check · same deal, 3 products live
Conventional
25% down · 7.5% · 30yr
- Down + closing
- —
- Monthly P&I
- —
- Monthly cashflow
- —
- DSCR
- —
- Eligible?
- —
Personal DTI + credit; lowest rate.
DSCR
20% down · 8.5% · 30yr
- Down + closing
- —
- Monthly P&I
- —
- Monthly cashflow
- —
- DSCR
- —
- Eligible?
- —
No personal income docs; deal must DSCR.
Hard money
10% down · 12.0% · 12mo
- Down + closing
- —
- Monthly P&I
- —
- Monthly cashflow
- —
- DSCR
- —
- Eligible?
- —
Short-term bridge; refi at stabilization.
Listing history 3 events
-
2014-02-18soldstatus
-
2013-08-15historical
-
2013-07-31$179,900
ⓘ Source: listings_history table (triggers on properties + properties_extension) + one-shot
backfill from property_details.listing_events for pre-trigger history.
Climate risk First Street
- Heat 2/10 Low
- Air quality 4/10 Moderate 4 unhealthy d/yr today · 4 by 30 yrs out
Nearby sold comps map
Loading sold comps map…
Walkable amenities ~0.75 mi
Loading nearby amenities…
Taxation est. · year 1
- Rental income
- $19,337
- − Mortgage interest
- −$10,077
- − Property taxes
- −$2,698
- − Insurance
- −$900
- − Repairs & maintenance
- −$1,547
- − Management
- −$1,547
- − Depreciation
- −$5,233
- Taxable loss
- −$2,666
- Est. tax savings @ 24.0%
- +$640
- After-tax cash flow
- $997/yr
For passive investors: Depreciation is non-cash, so a rental often shows a tax loss while cash-flowing — sheltering income. Rental losses are passive: they offset passive income freely, and up to $25,000/yr can offset ordinary (W-2) income if you actively participate and your MAGI is under $100k (phasing out to $0 by $150k); unused losses carry forward. On sale, claimed depreciation is recaptured at up to 25%, and gains may owe capital-gains tax (a 1031 exchange can defer both). Figures are a year-1 estimate at your 24.0% rate — not tax advice; consult a CPA.
Schools (NCES district)
- District
- Mckenzie County 1
- NCES district ID
- 3812540
- Math proficiency
- 33% ▲ 3.00%
- Reading proficiency
- 36% ▼ -3.00%
- Median HH income
- $69,150
- Composite
- 31.76/100
- National rank
- #5902
- State rank
- #34 of 53 in ND
Livability — Watford City
- Score
- 73/100
- State rank
- #39
- US rank
- #5688
Category grades
Schools grade is shown separately in the Schools card above.
Census & demographics
- County
- McKenzie County · 9,368 people
- City population
- 9,368
- Metro
- nan
- Population (ZIP)
- 9,368
- Household income
- $99,000
- Rent vs Own
- Severe rent burden
- 163.0
Population outlook (McKenzie County) Hauer SSP2
- Today (2025)
- 28,775 people
- By 2030
- 37,834 · +31.5%
- By 2040
- 58,116 · +102.0%
- By 2050
- 80,685 · +180.4%
- By 2075
- 142,630 · +395.7%
- By 2100
- 200,986 · +598.5%
Race, ethnicity, and origin ACS 2023
- Neighborhood character
- Predominantly White (76%)
- Race & ethnicity
- White 76% Hispanic / Latino 15% Two or more races 7% Native American 4% Black 2%
- Hispanic origin (detail)
- Mexican 10%
- Common ancestry
- Portuguese 18% Scottish 5% Lithuanian 2%
- Foreign-born
- 4% · Canada
- Languages at home
- 91% English-only · Spanish 7% German/W. Germanic 1%
Political lean MEDSL · McKenzie
- 2024 margin
- Solid R (+69.6) · D 14.8% · R 84.4%
- 2008→2024 swing
- -39.9pp toward R · 2008: -29.7pp · 2024: -69.6pp
- All cycles
- 2024: R+69.6 2020: R+67.7 2016: R+64.5 2012: R+44.5 2008: R+29.7
Not yet ingested
- Civics
- —
Market trends
- HPI YoY
- ▼ -17.91%
- Current HPI
- 129.8723
- Rent YoY
- —
- Metro
- nan
- State GDP YoY
- ▲ 2.09%
- F500 in state
- 2
Industry mix (Fortune 500 HQ in ND)
| Industry | F500 HQs | Revenue |
|---|---|---|
| Utilities / Construction | 1 | $6B |
|
||
Price history
3 events — show timeline
- 2014-02-18 Sold (Public Records) — Public Records
- 2013-08-15 Delisted — Badlands BOR MLS
- 2013-07-31 Listed $179,900 Badlands BOR MLS
Cash-flow waterfall
monthlySold comps — $/sqft
last 12 mo · ≤1 miLoading sold comps…