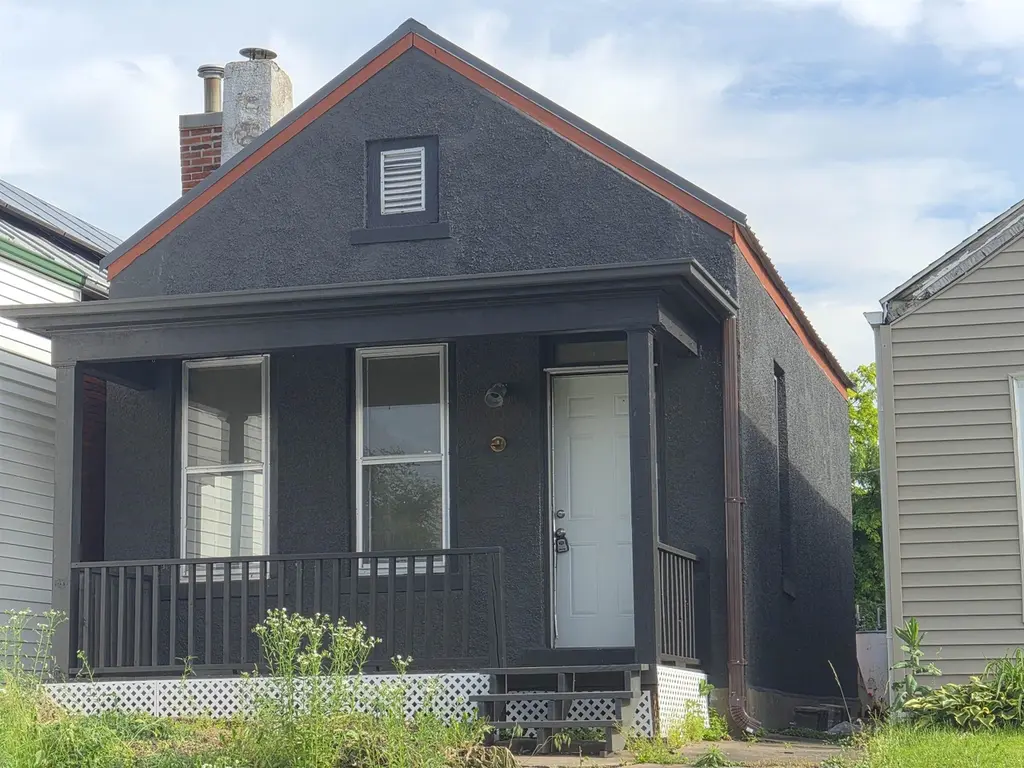
722 Payson Ave · Quincy, IL
Flood risk 1/10 · Minimal
- FEMA flood zone
- X (unshaded)
- Chance of flooding over 30 yrs
- 0.0%
- Est. flood insurance / yr
- $473 – $860
Fire risk 1/10 · Minimal
- Est. fire insurance / yr
- $804 – $1,492
Heat risk 4/10 · Minor
- Hot days now (above 106°F)
- 7 days/yr
- Hot days in 30 yrs
- 17 days/yr
Wind risk 2/10 · Minimal
- Chance of severe wind over 30 yrs
- —
Air-quality risk 2/10 · Minimal
- Unhealthy air days now
- 1 days/yr
- Unhealthy air days in 30 yrs
- 1 days/yr
Risk factors via First Street. Map © Google.
Why this score? — see what drove the B+ grade
The composite is a weighted blend of 9 inputs, each scored 0–100. Each bar is that input's sub-score; the figure is the points it added to the 100-point composite (weight × sub-score).
- Cash flow +30.0/30.0
- ARV discount +15.0/15.0
- 1% rule +10.0/10.0
- DSCR +10.0/10.0
- Rent growth +5.0/5.0
- Livability +3.4/5.0
- Condition / age +2.5/5.0
- Schools +2.2/10.0
- Appreciation +0.0/10.0
$50,000
🖨 Deal sheet 📄 Offer letter ✓ Due diligence
Listing remarks
Attention home buyers with skills or investors. .. check out this "Shotgun" style home that has been partially rehabbed. Some finish work to do could result in a nice equity return for the right buyer. Updates done by current owner include metal roof 2024; LVP flooring, plumbing, electrical, LED lighting, inside paint, and exterior finish 2025; stove, refrigerator and stool all still new and unused. Home is being sold "As-is", will not pass FHA/VA as some systems are incomplete.
Key facts
- Inside paint
- Metal roof
- Led lighting
Tags
Property features AI
Exterior
- Parking: Alley access
- Utilities: Public water; Public sewer; 100 Amp electric service
- Home design: Detached single-family home; 1 story; Facing direction not specified; Rehab work in 2025
- Construction: Built over 100 years ago; Vinyl siding and stucco exterior; Metal roof; Crawl space foundation
- Exterior features: Alley access; Lot dimensions approximately 20 x 213; Lot is less than 0.25 acre
Interior
- Kitchen: Microwave; Refrigerator
- Bedrooms: 1 bedroom (main level)
- Bathrooms: 1 full bathroom
- Heating & cooling: Natural gas heating
- Interior features: Separate dining room; Partial, unfinished basement with crawl space
Neighborhood map
What this means for you Summary
Snapshot
- This is a 1-bed/1.0-bath single-family listed at $50k.
Deal economics
- At list price, monthly cash flow is $285 ($3k/yr) — positive.
- The deal already cash-flows at list — no discount required.
- Meets the 1% rule at list price ($789 rent vs $50k).
- Cap rate 13.1% vs local median 4.3% in Quincy — top-decile yield for the area; either an underpriced asset or a hidden risk that comps aren't pricing in. Stress-test before assuming the spread holds.
Location & tenants
- Location reads 67/100 on livability (#506 in IL) — a middle-class / working-renter tenant base. Strengths: cost of living A+, housing A+; Watch: crime D, employment D, amenities D-.
- Quincy SD 172 (town): math 24% / reading 27% proficiency, ranked #328 of 620 in IL (top 53%) — low school quality limits family demand, transient renter base, plan for 1-2y turnover.
- Zoned schools: Lincoln-Douglas Elementary School (math 30% / reading 25%, grade F, #742 of 2,056 statewide, top 36%, 588 students, 0% FRL); Quincy Jr High School (math 25% / reading 30%, grade F, #295 of 665 statewide, top 45%, 1,348 students, 0% FRL); Quincy Sr High School (math 21% / reading 28%, grade F, #256 of 693 statewide, top 44%, 1,924 students, 0% FRL) — zoned schools average 0% FRL vs 48% district-wide (48 pts lower); this property's tenant base skews higher-income than the district average.
- Market conditions: Rents rising fast (+10.8%/yr); 180 active listings in the ZIP; 4 comparable units currently listed for rent nearby; rentals lingering (median 44d on market — plan ~5-8 weeks vacancy on turnover, expect pricing pressure); 100% of comp listings sitting > 30 days — soft ceiling on asking rent; 68 units permitted in Adams County in 2024 (0 in 5+ unit buildings).
Forward outlook
- Local home prices are declining (-3.0%/yr); year-one equity from $346 of loan paydown is wiped out by about $2k of value loss. Plan a longer hold.
- Adams County population projected at -14% by 2050 — secular population decline; favor cash flow + early exit over multi-decade hold.
- At projected returns (-3.0% appreciation + 8.0% rent growth), your $14k cash investment doubles in ~5 years — after that, you're playing with house money.
Negotiation context
- Only 11 days on market — expect competitive offers; lowballing is unlikely to land.
Risks & watch-outs
- Watch-outs: built in 1877 — expect roof / HVAC / electrical / plumbing capex.
Questions for the listing agent
- Built in 1877 — when were the roof, HVAC, electrical panel, plumbing, and water heater last replaced?
- Is there a deadline driving the sale (1031 exchange, divorce, estate, relocation)? That informs how much negotiation room exists.
- Schools are D-rated, which usually means shorter tenancies and higher turnover. Who's the typical renter profile here, and what's been the actual vacancy rate?
- Crime grade is D in this area — have there been break-ins, vandalism, or insurance claims at this property in the last 3 years? What carrier currently insures it and at what premium?
- What's the average days-on-market for RENTAL listings here right now (not sales)? A rising rental-DOM trend means longer vacancies and softer asking-rent achievability than the comps imply.
- What's the recent tenant-quality profile in this submarket — average credit score on applications, eviction rate, late-payment / NSF rate, and stable-employment percentage? A property-management company in the area should have these aggregated.
- How much new for-sale + rental construction is in the pipeline within 1–3 miles? Heavy new supply typically softens prices + rents 12–24 months out; constrained supply supports both.
Investment metrics
- 1% rule
- 1.58% ✓
- Cap rate
- 13.14%
- Cash-on-cash
- 24.46%
- DSCR
- 2.09
- GRM
- 5.3
CMA / ARV
- ARV (on-the-fly)
- $70,020
- Comps found
- 10
Show comp detail 10 sales within ~0.75 mi
| Address | Dist | Beds/Ba | Sqft | Sold | Price | $/sf | Match |
|---|---|---|---|---|---|---|---|
| 527 Washington St | 0.20mi | 2/1.0 (+1) | 736 (-5%) | 3mo | $80,000 | $109 | 74 |
| 420 Kentucky St | 0.40mi | 1/1.0 | 736 (-5%) | 6mo | $15,000 | $20 | 67 |
| 624 Monroe St | 0.39mi | 1/1.0 | 825 (+6%) | 6mo | $87,500 | $106 | 67 |
| 1323 S 6th St | 0.63mi | 2/1.0 (+1) | 720 (-8%) | 1mo | $92,000 | $128 | 53 |
| 1108 Adams St | 0.57mi | 2/2.0 (+1) | 734 (-6%) | 6mo | $30,000 | $41 | 50 |
| 630 York St | 0.38mi | 2/1.5 (+1) | 848 (+9%) | 15mo | $61,668 | $73 | 48 |
| 806 S 9th St | 0.15mi | 2/1.0 (+1) | 888 (+14%) | 20mo | $67,500 | $76 | 48 |
| 819 Jersey St | 0.49mi | 1/1.0 | 841 (+8%) | 22mo | $35,000 | $42 | 45 |
| 827 S 16th St | 0.75mi | 2/1.0 (+1) | 780 (+0%) | 19mo | $70,000 | $90 | 44 |
| 219 State St | 0.51mi | 1/1.0 | 675 (-13%) | 14mo | $95,000 | $141 | 42 |
Match score weights: distance 35% · size 25% · config 20% · recency 20%. Top-matched comps best support the ARV.
Projected returns pro-forma
-3.0% appreciation · 8.0% rent growth · sell at horizon
- IRR
- 23.3%
- Equity multiple
- 2.02×
- Total profit
- $14,251
- Equity at exit
- $7,455
- IRR
- 34.2%
- Equity multiple
- 4.92×
- Total profit
- $54,829
- Equity at exit
- $4,323
Cash invested: $14,000 (down + closing). Projections, not guarantees.
Landlord ↔ Tenant lean methodology
- Overall (STATE)
- 43 Moderately Tenant-Leaning
- State Illinois
- 43 Moderately Tenant-Leaning · D+7
- County
- — inherits STATE
- City
- — inherits STATE
ZIP-level market 62301
- Rents YoY
- 10.8%
- Active inventory
- 180
- Price-to-rent
- 5.3×
Monthly cashflow live
- Estimated rent
- $789 medium interval (Pro) →
- Mortgage (P&I)
- −$262
- Tax from tax record
- −$55 /mo · $663/yr
- Insurance
- −$21
- HOA
- −$0
- Vacancy / Maint / Mgmt
- −$166
- Net cashflow
- $285
Break-even live
UW: 25.0% down · 7.5% · 30yr · 1.5% tax · 5.0% vac · 8.0% maint · 8.0% mgmt
Financing live
Cash to close
- Down payment
- $12,500
- Closing costs
- $1,500
- Reserves months
- —
- Total cash needed
- —
Loan-product check · same deal, 3 products live
Conventional
25% down · 7.5% · 30yr
- Down + closing
- —
- Monthly P&I
- —
- Monthly cashflow
- —
- DSCR
- —
- Eligible?
- —
Personal DTI + credit; lowest rate.
DSCR
20% down · 8.5% · 30yr
- Down + closing
- —
- Monthly P&I
- —
- Monthly cashflow
- —
- DSCR
- —
- Eligible?
- —
No personal income docs; deal must DSCR.
Hard money
10% down · 12.0% · 12mo
- Down + closing
- —
- Monthly P&I
- —
- Monthly cashflow
- —
- DSCR
- —
- Eligible?
- —
Short-term bridge; refi at stabilization.
Rent comps 4 comps
| Address | Beds | Baths | Sqft | Rent | $/sqft | DOM | Units | Dist |
|---|---|---|---|---|---|---|---|---|
| 500 Maine St Quincy, IL | 1.0 | 1.0 | 937 | $700 | $0.75 | 43d | 1 | 0.56mi |
| 133 S 4th St Apt 206 Quincy, IL | 2.0 | 1.0 | 620 | $1,450 | $2.34 | 43d | 1 | 0.56mi |
| 115 N 8th St Unit 1/2-5 Quincy, IL | 2.0 | 1.0 | 750 | $475 | $0.63 | 43d | 1 | 0.58mi |
| 116 N 3rd St Quincy, IL | 1.0–4.0 | 1.0–2.0 | 1950 | $1,800 | $0.92 | 43d | 12 | 0.71mi |
Listing history 9 events
-
2026-06-19days on market $50,000 Active 11 DOM
-
2026-06-18days on market $50,000 Active 10 DOM
-
2026-06-17days on market $50,000 Active 9 DOM
-
2026-06-16days on market $50,000 Active 8 DOM
-
2026-06-15days on market $50,000 Active 7 DOM
-
2026-06-14days on market $50,000 Active 5 DOM
-
2026-06-12days on market $50,000 Active 4 DOM
-
2026-06-09remarks 483-char remark
-
2026-06-09$50,000 Active 1 DOM
ⓘ Source: listings_history table (triggers on properties + properties_extension) + one-shot
backfill from property_details.listing_events for pre-trigger history.
Tax reassessment forecast IL · Partial reset (capped growth)
- Current annual tax
- $663 · $55/mo
- Projected year-2 tax
- $899 · $75/mo
- Expected delta
- +$236/yr (+$20/mo · 35.6%)
ⓘ Screening estimate from a state-policy table — verify with the county assessor before closing.
Climate risk First Street
- Flood 1/10 Low FEMA zone X (unshaded) · 0% chance over 30 yrs
- Wildfire 1/10 Low
- Heat 4/10 Moderate 7 d/yr ≥106°F today · 17 d/yr by 30 yrs out
- Wind 2/10 Low
- Air quality 2/10 Low 1 unhealthy d/yr today · 1 by 30 yrs out
Nearby sold comps map
Loading sold comps map…
Walkable amenities ~0.75 mi
Loading nearby amenities…
Taxation est. · year 1
- Rental income
- $9,473
- − Mortgage interest
- −$2,801
- − Property taxes
- −$663
- − Insurance
- −$250
- − Repairs & maintenance
- −$758
- − Management
- −$758
- − Depreciation
- −$1,455
- Taxable income
- $2,789
- Est. tax owed @ 24.0%
- −$669
- After-tax cash flow
- $2,755/yr
For passive investors: Depreciation is non-cash, so a rental often shows a tax loss while cash-flowing — sheltering income. Rental losses are passive: they offset passive income freely, and up to $25,000/yr can offset ordinary (W-2) income if you actively participate and your MAGI is under $100k (phasing out to $0 by $150k); unused losses carry forward. On sale, claimed depreciation is recaptured at up to 25%, and gains may owe capital-gains tax (a 1031 exchange can defer both). Figures are a year-1 estimate at your 24.0% rate — not tax advice; consult a CPA.
Schools (NCES district)
- District
- Quincy SD 172
- NCES district ID
- 1733000
- Math proficiency
- 24% ▬ 0.00%
- Reading proficiency
- 27% ▬ 0.00%
- Median HH income
- $44,132
- Composite
- 21.91/100
- National rank
- #8229
- State rank
- #328 of 620 in IL
Livability — Quincy
- Score
- 67/100
- State rank
- #506
- US rank
- #10458
Category grades
Schools grade is shown separately in the Schools card above.
Census & demographics
- Census place
- Quincy, IL
- County
- Adams County · 30,746 people
- City population
- 30,746
- Metro
- Quincy, IL-MO
- Population (ZIP)
- 30,746
- Household income
- $52,055
- Rent vs Own
- Severe rent burden
- 1238.0
Population outlook (Adams County) Hauer SSP2
- Today (2025)
- 65,795 people
- By 2030
- 64,436 · -2.1%
- By 2040
- 61,007 · -7.3%
- By 2050
- 56,851 · -13.6%
- By 2075
- 46,424 · -29.4%
- By 2100
- 34,305 · -47.9%
Race, ethnicity, and origin ACS 2023
- Neighborhood character
- Predominantly White (84%)
- Race & ethnicity
- White 84% Two or more races 7% Black 6% Hispanic / Latino 3% Asian 1%
- Common ancestry
- Slovak 2% Iranian 1% Lithuanian 1%
- Foreign-born
- 2% · Canada
- Languages at home
- 96% English-only · Spanish 2%
Political lean MEDSL · Adams
- 2024 margin
- Solid R (+47.4) · D 25.6% · R 73.0% · Other 1.5%
- 2008→2024 swing
- -25.0pp toward R · 2008: -22.4pp · 2024: -47.4pp
- All cycles
- 2024: R+47.4 2020: R+46.5 2016: R+47.5 2012: R+35.2 2008: R+22.4
Not yet ingested
- Civics
- —
Market trends
- HPI YoY
- ▼ -121.44%
- Current HPI
- 131.7344
- Rent YoY
- ▲ 10.78%
- Metro
- Quincy, IL-MO
- State GDP YoY
- ▲ 1.59%
- F500 in state
- 60
Industry mix (Fortune 500 HQ in IL)
| Industry | F500 HQs | Revenue |
|---|---|---|
| Insurance | 4 | $201B |
|
||
| Consumer Goods | 4 | $87B |
|
||
| Industrial Machinery | 3 | $64B |
|
||
| Healthcare | 2 | $55B |
|
||
| Retail / Pharmacy | 1 | $148B |
|
||
| Agriculture / Food | 1 | $86B |
|
||
Price history
1 event — show timeline
- 2026-06-08 Listed $50,000 MRED as Distributed by MLS Grid
Property tax history
+2.0%/yrLatest (2023): $663 · +5.7% YoY. Source: county tax records.
Cash-flow waterfall
monthlySold comps — $/sqft
last 12 mo · ≤1 miLoading sold comps…