 Multi-family
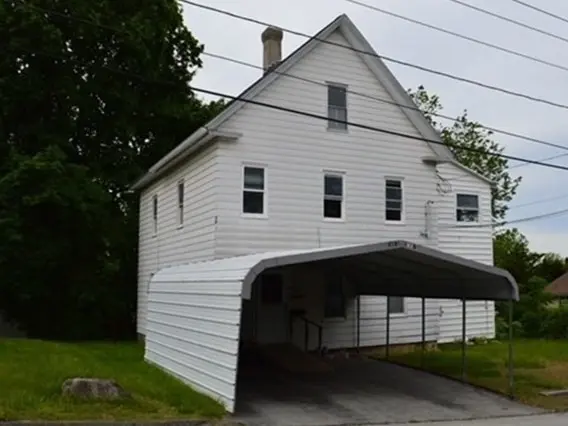
5 Anna St · Worcester, MA
Flood risk 1/10 · Minimal
- FEMA flood zone
- X (unshaded)
- Chance of flooding over 30 yrs
- 0.0%
- Est. flood insurance / yr
- $473 – $860
Fire risk 1/10 · Minimal
- Est. fire insurance / yr
- $915 – $1,699
Heat risk 4/10 · Minor
- Hot days now (above 94°F)
- 7 days/yr
- Hot days in 30 yrs
- 16 days/yr
Wind risk 6/10 · Moderate
- Chance of severe wind over 30 yrs
- 27.0%
Air-quality risk 2/10 · Minimal
- Unhealthy air days now
- 1 days/yr
- Unhealthy air days in 30 yrs
- 2 days/yr
Risk factors via First Street. Map © Google.
Why this score? — see what drove the B+ grade
The composite is a weighted blend of 9 inputs, each scored 0–100. Each bar is that input's sub-score; the figure is the points it added to the 100-point composite (weight × sub-score).
- Cash flow +30.0/30.0
- ARV discount +13.9/15.0
- DSCR +10.0/10.0
- 1% rule +9.0/10.0
- Livability +4.4/5.0
- Rent growth +3.6/5.0
- Condition / age +2.5/5.0
- Schools +2.0/10.0
- Appreciation +0.0/10.0
$594,000
🖨 Deal sheet 📄 Offer letter ✓ Due diligence
Multi-family units
County records classify this as Multi-Family (2-4 Unit). Listing-text estimate: 1 unit. estimate disagrees with records
Listing remarks
Conveniently located in the area of UMass Medical School, Property located near major routes including I-290, I-90, Rt. 9 and Rt. 20, this well-positioned multi-family home offers incredible potential for both investors and owner-occupants alike. Unit 1 features 2 bedrooms and 1 full bath, while Unit 2 also offers 2 bedrooms and 1 full bath, providing comfortable living spaces with excellent rental appeal. Situated close to shopping, dining, and everyday conveniences, this property is located in a high-demand area with strong rental potential. Whether you're looking to expand your investment portfolio or live in one unit while generating income from the other, this versatile multi-family is
Key facts
- Growing neighborhood
- High-demand area
- Commuter access
Tags
Property features AI
Finance
- HOA & community: Community amenities include public transportation, shopping, parks, walk/jog trails, medical facility access, highway access, house of worship, and public schools; Not a senior community
Exterior
- Parking: 3 off-street parking spaces
- Utilities: Public water; Public sewer; Electric: 110 volts, common service, individually metered; Gas available for gas range
- Home design: Multi-family property; 2 stories
- Construction: Frame construction; Stone foundation; Shingle roof; White exterior
- Exterior features: Wood deck; Level lot; Paved public road frontage
Interior
- Flooring: Vinyl; Carpet; Laminate
- Bathrooms: 2 full bathrooms
- Interior features: Total of 10 rooms; Full basement with bulkhead
Neighborhood map
What this means for you Summary
Snapshot
- This is a 4-bed/2.0-bath multifamily listed at $594k.
Deal economics
- At list price, monthly cash flow is $3k ($33k/yr) — positive.
- The deal already cash-flows at list — no discount required.
- Meets the 1% rule at list price ($8k rent vs $594k).
- Recommended offer: $585k (1.5% below list) — sets the bar for market timing.
- Cap rate 11.9% vs local median 4.1% in Worcester — top-decile yield for the area; either an underpriced asset or a hidden risk that comps aren't pricing in. Stress-test before assuming the spread holds.
Location & tenants
- Location reads 87/100 on livability (#9 in MA, #312 nationally) — a professional / high-income tenant draw. Strengths: crime A+, amenities A+, commute A+; Watch: cost of living D.
- Worcester (urban): math 17% / reading 30% proficiency, ranked #280 of 302 in MA (top 93%) — low school quality limits family demand, transient renter base, plan for 1-2y turnover; 66% free/reduced lunch — lower-income household profile, screen leases tightly.
- Zoned schools: North High (math 10% / reading 28%, grade F, #313 of 343 statewide, top 92%, 1,377 students, 0% FRL) — zoned schools average 0% FRL vs 66% district-wide (66 pts lower); this property's tenant base skews higher-income than the district average.
- Market conditions: Rents rising fast (+4.5%/yr); 19 active listings in the ZIP; 7 comparable units currently listed for rent nearby; rentals at typical pace (median 24d on market — plan ~3-4 weeks tenant-placement turnaround); 43% of comp listings sitting > 30 days — soft ceiling on asking rent; solid renter incomes; 2,293 units permitted in Worcester County in 2024 (1,205 in 5+ unit buildings).
- At $8,313/mo this rent would consume 108% of the median local household income ($92k/yr) (locally 634% of renters already pay >50% of income on rent) — very limited rent-growth headroom before tenants either downsize or default.
Forward outlook
- Local home prices are declining (-3.0%/yr); year-one equity from $4k of loan paydown is wiped out by about $18k of value loss. Plan a longer hold.
- At projected returns (-3.0% appreciation + 4.5% rent growth), your $166k cash investment doubles in ~6 years — after that, you're playing with house money.
Negotiation context
- It's been on market 22 days — a 2% lower offer ($585k) is reasonable based on typical stale-listing flexibility.
- Current owner paid $152k; list at $594k implies a 291% gain — meaningful room to come down on a strong offer.
Risks & watch-outs
- Watch-outs: built in 1898 — expect roof / HVAC / electrical / plumbing capex.
- Climate carrying-cost: major wind risk, 27% chance of damaging wind over 30y — expect insurance premiums to compound above CPI over the hold.
Questions for the listing agent
- Built in 1898 — when were the roof, HVAC, electrical panel, plumbing, and water heater last replaced?
- Is there a deadline driving the sale (1031 exchange, divorce, estate, relocation)? That informs how much negotiation room exists.
- What's the average days-on-market for RENTAL listings here right now (not sales)? A rising rental-DOM trend means longer vacancies and softer asking-rent achievability than the comps imply.
- What's the recent tenant-quality profile in this submarket — average credit score on applications, eviction rate, late-payment / NSF rate, and stable-employment percentage? A property-management company in the area should have these aggregated.
- How much new apartment / multifamily construction is in the pipeline within 1–3 miles? Heavy new supply (>2% of stock underway) typically softens rents 12–24 months out; light construction supports rent growth.
Investment metrics
- 1% rule
- 1.40% ✓
- Cap rate
- 11.86%
- Cash-on-cash
- 19.89%
- DSCR
- 1.88
- GRM
- 6.0
CMA / ARV
- ARV (on-the-fly)
- $692,384
- Comps found
- 4
Show comp detail 4 sales within ~0.75 mi
| Address | Dist | Beds/Ba | Sqft | Sold | Price | $/sf | Match |
|---|---|---|---|---|---|---|---|
| 66 Locust Ave | 0.14mi | 4/3.0 | 2,448 (-1%) | 9mo | $615,000 | $251 | 81 |
| 176 Coburn Ave | 0.07mi | 5/3.0 (+1) | 2,628 (+7%) | 14mo | $738,000 | $281 | 65 |
| 15 Superior Rd | 0.63mi | 4/2.0 | 2,236 (-9%) | 14mo | $560,000 | $250 | 44 |
| 28-30 Villa Rd | 0.71mi | 5/2.5 (+1) | 2,249 (-9%) | 11mo | $720,000 | $320 | 36 |
Match score weights: distance 35% · size 25% · config 20% · recency 20%. Top-matched comps best support the ARV.
Projected returns pro-forma
-3.0% appreciation · 4.46% rent growth · sell at horizon
- IRR
- 13.6%
- Equity multiple
- 1.55×
- Total profit
- $91,639
- Equity at exit
- $88,567
- IRR
- 23.4%
- Equity multiple
- 3.15×
- Total profit
- $358,008
- Equity at exit
- $51,358
Cash invested: $166,320 (down + closing). Projections, not guarantees.
Landlord ↔ Tenant lean methodology
- Overall (STATE)
- 20 Strongly Tenant-Friendly
- State Massachusetts
- 20 Strongly Tenant-Friendly · D+15
- County
- — inherits STATE
- City
- — inherits STATE
ZIP-level market 01606
- Rents YoY
- 4.5%
- Active inventory
- 19
- Price-to-rent
- 23.8×
Monthly cashflow live
- Estimated rent
- $8,313 high interval (Pro) →
- Mortgage (P&I)
- −$3,115
- Tax from tax record
- −$448 /mo · $5,380/yr
- Insurance
- −$248
- HOA
- −$0
- Vacancy / Maint / Mgmt
- −$1,746
- Net cashflow
- $2,756
Break-even live
4-unit breakdown (identical units grouped — click to expand)
| Units | Beds | Baths | Est. rent |
|---|---|---|---|
| 4× units | 2 | 1 | $8,312 |
| #1 | 2 | 1 | $2,078 |
| #2 | 2 | 1 | $2,078 |
| #3 | 2 | 1 | $2,078 |
| #4 | 2 | 1 | $2,078 |
| Total (4 units) | $8,313 | ||
UW: 25.0% down · 7.5% · 30yr · 1.5% tax · 5.0% vac · 8.0% maint · 8.0% mgmt
Financing live
Cash to close
- Down payment
- $148,500
- Closing costs
- $17,820
- Reserves months
- —
- Total cash needed
- —
Loan-product check · same deal, 3 products live
Conventional
25% down · 7.5% · 30yr
- Down + closing
- —
- Monthly P&I
- —
- Monthly cashflow
- —
- DSCR
- —
- Eligible?
- —
Personal DTI + credit; lowest rate.
DSCR
20% down · 8.5% · 30yr
- Down + closing
- —
- Monthly P&I
- —
- Monthly cashflow
- —
- DSCR
- —
- Eligible?
- —
No personal income docs; deal must DSCR.
Hard money
10% down · 12.0% · 12mo
- Down + closing
- —
- Monthly P&I
- —
- Monthly cashflow
- —
- DSCR
- —
- Eligible?
- —
Short-term bridge; refi at stabilization.
Rent comps 7 comps
| Address | Beds | Baths | Sqft | Rent | $/sqft | DOM | Units | Dist |
|---|---|---|---|---|---|---|---|---|
| 308 Plantation St Apt 3 Worcester, MA | 3.0 | 1.0 | 1600 | $2,000 | $1.25 | 23d | 1 | 0.57mi |
| 67 N Quinsigamond Ave #9 Shrewsbury, MA | 3.0 | 2.5 | 1620 | $3,500 | $2.16 | 43d | 1 | 0.96mi |
| 8 Ellsmere St Unit a Worcester, MA | 3.0 | 2.0 | 1600 | $2,400 | $1.50 | 43d | 1 | 1.02mi |
| 21 Creston St Unit A Worcester, MA | 3.0 | 1.5 | 2030 | $2,800 | $1.38 | 14d | 1 | 1.04mi |
| 80 Delmont Ave Unit 2 Worcester, MA | 5.0 | 2.0 | 2000 | $3,000 | $1.50 | 43d | 1 | 1.05mi |
| 59 Olympia Ave Unit 4A Shrewsbury, MA | 3.0 | 2.5 | 1823 | $4,000 | $2.19 | 14d | 1 | 1.09mi |
| 249 Shrewsbury St Unit 3 Worcester, MA | 3.0 | 1.0 | 1700 | $1,975 | $1.16 | 23d | 1 | 1.11mi |
Listing history 17 events
-
2026-06-18days on market $594,000 Active 22 DOM
-
2026-06-17days on market $594,000 Active 21 DOM
-
2026-06-16days on market $594,000 Active 20 DOM
-
2026-06-15statusdays on market $594,000 Active 19 DOM
-
2026-06-14pricestatusdays on market $594,000 Price Changed 17 DOM
-
2026-06-10days on market $599,000 Active 14 DOM
-
2026-06-09days on market $599,000 Active 13 DOM
-
2026-06-08days on market $599,000 Active 12 DOM
-
2026-06-07days on market $599,000 Active 11 DOM
-
2026-06-05days on market $599,000 Active 8 DOM
-
2026-06-03days on market $599,000 Active 7 DOM
-
2026-06-02days on market $599,000 Active 6 DOM
-
2026-06-01days on market $599,000 Active 5 DOM
-
2026-05-31statusdays on market $599,000 Active 4 DOM
-
2026-05-31days on market $599,000 New 3 DOM
-
2026-05-27$599,000 New
-
2010-03-29soldstatus $152,025
ⓘ Source: listings_history table (triggers on properties + properties_extension) + one-shot
backfill from property_details.listing_events for pre-trigger history.
Tax reassessment forecast MA · Partial reset (capped growth)
- Current annual tax
- $5,380 · $448/mo
- Projected year-2 tax
- $6,343 · $529/mo
- Expected delta
- +$963/yr (+$80/mo · 17.9%)
ⓘ Screening estimate from a state-policy table — verify with the county assessor before closing.
Climate risk First Street
- Flood 1/10 Low FEMA zone X (unshaded) · 0% chance over 30 yrs
- Wildfire 1/10 Low
- Heat 4/10 Moderate 7 d/yr ≥94°F today · 16 d/yr by 30 yrs out
- Wind 6/10 Major 27% chance of damaging wind over 30 yrs
- Air quality 2/10 Low 1 unhealthy d/yr today · 2 by 30 yrs out
Nearby sold comps map
Loading sold comps map…
Walkable amenities ~0.75 mi
Loading nearby amenities…
Taxation est. · year 1
- Rental income
- $99,756
- − Mortgage interest
- −$33,273
- − Property taxes
- −$5,380
- − Insurance
- −$2,970
- − Repairs & maintenance
- −$7,980
- − Management
- −$7,980
- − Depreciation
- −$17,280
- Taxable income
- $24,892
- Est. tax owed @ 24.0%
- −$5,974
- After-tax cash flow
- $27,103/yr
For passive investors: Depreciation is non-cash, so a rental often shows a tax loss while cash-flowing — sheltering income. Rental losses are passive: they offset passive income freely, and up to $25,000/yr can offset ordinary (W-2) income if you actively participate and your MAGI is under $100k (phasing out to $0 by $150k); unused losses carry forward. On sale, claimed depreciation is recaptured at up to 25%, and gains may owe capital-gains tax (a 1031 exchange can defer both). Figures are a year-1 estimate at your 24.0% rate — not tax advice; consult a CPA.
Schools (NCES district)
- District
- Worcester
- NCES district ID
- 2513230
- Math proficiency
- 17% ▼ -15.00%
- Reading proficiency
- 30% ▼ -8.00%
- Median HH income
- $45,063
- Composite
- 20.3/100
- National rank
- #8615
- State rank
- #280 of 302 in MA
Livability — Worcester
- Score
- 87/100
- State rank
- #9
- US rank
- #312
Category grades
Schools grade is shown separately in the Schools card above.
Census & demographics
- Census place
- Worcester, MA
- County
- Worcester County · 487,911 people
- City population
- 207,324
- Metro
- Worcester, MA-CT
- Population (ZIP)
- 22,844
- Household income
- $92,105
- Rent vs Own
- Severe rent burden
- 634.0
Population outlook (Worcester County) Hauer SSP2
- Today (2025)
- 850,858 people
- By 2030
- 860,403 · +1.1%
- By 2040
- 869,902 · +2.2%
- By 2050
- 869,110 · +2.1%
- By 2075
- 870,120 · +2.3%
- By 2100
- 829,703 · -2.5%
Race, ethnicity, and origin ACS 2023
- Neighborhood character
- Diverse neighborhood (Simpson 0.56)
- Race & ethnicity
- White 64% Hispanic / Latino 14% Two or more races 12% Black 9% Asian 5%
- Hispanic origin (detail)
- Puerto Rican 6% Dominican 2%
- Common ancestry
- Romanian 7% Lithuanian 6% Estonian 2%
- Foreign-born
- 14% · Canada, Vietnam, China
- Languages at home
- 76% English-only · Spanish 10% Other Indo-European 4% Vietnamese 3%
Political lean MEDSL · Worcester
- 2024 margin
- D (+10.0) · D 53.9% · R 43.9% · Other 2.2%
- 2008→2024 swing
- -3.8pp toward R · 2008: 13.8pp · 2024: 10.0pp
- All cycles
- 2024: D+10.0 2020: D+17.8 2016: D+10.5 2012: D+9.2 2008: D+13.8
Not yet ingested
- Civics
- —
Market trends
- HPI YoY
- ▼ -240.84%
- Current HPI
- 295.2937
- Rent YoY
- ▲ 4.46%
- Metro
- Worcester, MA-CT
- State GDP YoY
- ▲ 2.28%
- F500 in state
- 38
Industry mix (Fortune 500 HQ in MA)
| Industry | F500 HQs | Revenue |
|---|---|---|
| Technology | 3 | $17B |
|
||
| Insurance | 2 | $84B |
|
||
| Retail | 2 | $76B |
|
||
| Life Sciences | 1 | $43B |
|
||
| Energy Technology | 1 | $31B |
|
||
| Aerospace / Defense | 1 | $18B |
|
||
Price history
+294.0% since first listed2 events — show timeline
- 2026-05-27 Listed $599,000 MLS PIN
- 2010-03-29 Sold (Public Records) $152,025 Public Records
Property tax history
+3.9%/yrLatest (2023): $5,380 · +2.8% YoY. Source: county tax records.
Cash-flow waterfall
monthlySold comps — $/sqft
last 12 mo · ≤1 miLoading sold comps…