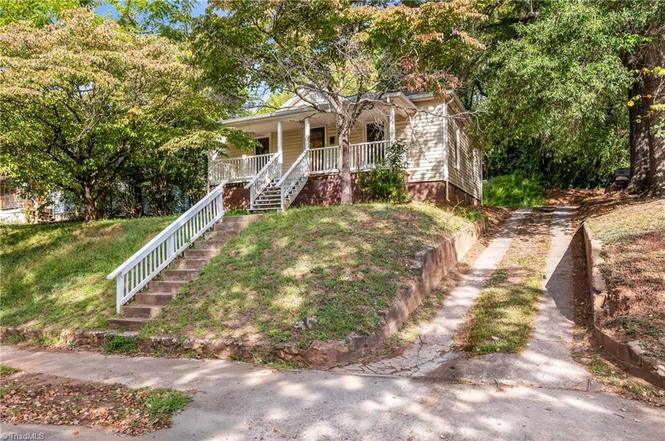
925 Harris St · Eden, NC
Flood risk 1/10 · Minimal
- FEMA flood zone
- X (unshaded)
- Chance of flooding over 30 yrs
- 0.0%
- Est. flood insurance / yr
- $507 – $1,088
Fire risk 2/10 · Minimal
- Est. fire insurance / yr
- $906 – $1,684
Heat risk 6/10 · Moderate
- Hot days now (above 104°F)
- 7 days/yr
- Hot days in 30 yrs
- 18 days/yr
Wind risk 3/10 · Minor
- Chance of severe wind over 30 yrs
- 6.0%
Air-quality risk 2/10 · Minimal
- Unhealthy air days now
- 2 days/yr
- Unhealthy air days in 30 yrs
- 2 days/yr
Risk factors via First Street. Map © Google.
Why this score? — see what drove the C- grade
The composite is a weighted blend of 9 inputs, each scored 0–100. Each bar is that input's sub-score; the figure is the points it added to the 100-point composite (weight × sub-score).
- Cash flow +16.6/30.0
- ARV discount +15.0/15.0
- DSCR +5.1/10.0
- 1% rule +3.6/10.0
- Livability +3.4/5.0
- Schools +3.3/10.0
- Rent growth +2.5/5.0
- Condition / age +2.5/5.0
- Appreciation +0.0/10.0
$123,500
🖨 Deal sheet 📄 Offer letter ✓ Due diligence
Listing remarks
Great opportunity to own this charming 1926 one story 3-bedroom cottage on nearly . 7 acres. The driveway allows access to private parking on the main level behind the home. With the large lot size, which already includes a large shed and your own private woodland behind the home, you’ll have room to grow. There is enough room to subdivide the lot and build additional housing for investment purposes. For more details on that possibility, a March 2026 survey is available upon request. The home has a large eat-in kitchen, spacious rooms and a lovely front porch we all love to enjoy in our beautiful state. Needs some TLC and is being sold “as is. ” Enjoy the small town, peac
Key facts
- Private woodland
- Private parking
- Eat-in kitchen
Tags
Property features AI
Finance
- HOA & community: No homeowners association
Exterior
- Parking: Driveway (see remarks)
- Security: Smoke detector(s)
- Utilities: Public water; Public sewer; Electric water heater; Natural gas for heating
- Home design: Residential stick/site-built house; One story; Built in 1926; Living room fireplace
- Construction: Vinyl siding; Crawl space foundation
- Exterior features: Sloped lot; Sloping land description; Storage structure; No pool; No fencing
Interior
- Kitchen: Free-standing range; Range hood
- Bedrooms: Bedrooms located on main level (primary on main)
- Flooring: Laminate; Tile; Vinyl
- Bathrooms: 1 full bathroom
- Heating & cooling: Forced air heating (natural gas); Central air conditioning
- Interior features: Primary bedroom on main level; Attic access only; Storm door(s); Insulated windows; Built-in features; Deadbolt locks; Smoke detector(s)
- Laundry & utility: Washer hookup; Dryer connection; Electric water heater
Neighborhood map
What this means for you Summary
Snapshot
- This is a 3-bed/1.0-bath single-family listed at $124k.
Deal economics
- At list price, monthly cash flow is $74 ($883/yr) — positive.
- The deal already cash-flows at list — no discount required.
- To meet the 1% rule (rent ≥ 1% of price), the offer needs to be $106k (14.1% below list).
- Recommended offer: $106k (14.1% below list) — sets the bar for 1% rule.
- Cap rate 7.0% vs local median 4.3% in Eden — top-decile yield for the area; either an underpriced asset or a hidden risk that comps aren't pricing in. Stress-test before assuming the spread holds.
Location & tenants
- Location reads 67/100 on livability (#224 in NC) — a middle-class / working-renter tenant base. Strengths: cost of living A+, housing A+, health & safety A+; Watch: crime D-, amenities F, commute F.
- Rockingham County Schools (rural): math 38% / reading 40% proficiency, ranked #120 of 178 in NC (top 67%) — families likely to look elsewhere, expect single-tenant / working-renter base with shorter leases.
- Zoned schools: Leaksville-Spray Elementary (math 26% / reading 27%, grade F, #1,073 of 1,410 statewide, top 77%, 404 students, 99% FRL); J E Holmes Middle (math 31% / reading 37%, grade F, #294 of 475 statewide, top 63%, 627 students, 99% FRL); John M Morehead High (math 22% / reading 47%, grade F, #427 of 535 statewide, top 81%, 814 students, 64% FRL) — zoned schools average 87% FRL vs 52% district-wide (35 pts higher); higher-poverty schools than district average — tighter screening recommended.
- Market conditions: 208 active listings in the ZIP; 2 comparable units currently listed for rent nearby; 344 units permitted in Rockingham County in 2024 (0 in 5+ unit buildings).
Forward outlook
- Local home prices are declining (-3.0%/yr); year-one equity from $854 of loan paydown is wiped out by about $4k of value loss. Plan a longer hold.
- Rockingham County population projected at -22% by 2050 — secular population decline; favor cash flow + early exit over multi-decade hold.
Negotiation context
- It's been on market 274 days — a 12% lower offer ($109k) is reasonable based on typical stale-listing flexibility.
- 2 sale attempts; this cycle's ask is 5% above the opening price — seller raised mid-cycle; expect resistance to lowballs.
Risks & watch-outs
- Watch-outs: built in 1926 — expect roof / HVAC / electrical / plumbing capex.
- Climate carrying-cost: extreme-heat days projected 7→18/yr by 2055 (HVAC capex compounding) — expect insurance premiums to compound above CPI over the hold.
Questions for the listing agent
- It's been on market 274 days. Have you received any prior offers? Is the seller open to a 14% concession, seller financing, or rate buy-down credit?
- Built in 1926 — when were the roof, HVAC, electrical panel, plumbing, and water heater last replaced?
- Why hasn't it sold? Are there any deal-killer items the seller is aware of (foundation, flood, title, zoning, code violations)?
- Is there a deadline driving the sale (1031 exchange, divorce, estate, relocation)? That informs how much negotiation room exists.
- Schools are F-rated, which usually means shorter tenancies and higher turnover. Who's the typical renter profile here, and what's been the actual vacancy rate?
- Crime grade is D in this area — have there been break-ins, vandalism, or insurance claims at this property in the last 3 years? What carrier currently insures it and at what premium?
- What's the average days-on-market for RENTAL listings here right now (not sales)? A rising rental-DOM trend means longer vacancies and softer asking-rent achievability than the comps imply.
- What's the recent tenant-quality profile in this submarket — average credit score on applications, eviction rate, late-payment / NSF rate, and stable-employment percentage? A property-management company in the area should have these aggregated.
- How much new for-sale + rental construction is in the pipeline within 1–3 miles? Heavy new supply typically softens prices + rents 12–24 months out; constrained supply supports both.
Investment metrics
- 1% rule
- 0.86% ✗
- Cap rate
- 7.01%
- Cash-on-cash
- 2.55%
- DSCR
- 1.11
- GRM
- 9.7
CMA / ARV
- ARV (on-the-fly)
- $169,332
- Comps found
- 12
Show comp detail 12 sales within ~0.75 mi
| Address | Dist | Beds/Ba | Sqft | Sold | Price | $/sf | Match |
|---|---|---|---|---|---|---|---|
| 912 Burton St | 0.09mi | 3/2.0 | 1,178 (-5%) | 8mo | $187,500 | $159 | 77 |
| 910 Branch St | 0.11mi | 2/1.0 (-1) | 1,050 (-15%) | 6mo | $149,900 | $143 | 60 |
| 1101 Lawson St | 0.65mi | 3/2.0 | 1,202 (-3%) | 4mo | $165,000 | $137 | 58 |
| 610 Forbes St | 0.70mi | 3/1.0 | 1,267 (+2%) | 9mo | $163,000 | $129 | 56 |
| 963 Harris St | 0.18mi | 2/1.5 (-1) | 1,066 (-14%) | 10mo | $140,000 | $131 | 54 |
| 509 College St | 0.74mi | 3/2.0 | 1,228 (-1%) | 10mo | $149,900 | $122 | 52 |
| 521 Dumaine St | 0.71mi | 3/2.0 | 1,232 (-0%) | 13mo | $240,000 | $195 | 52 |
| 1028 Galloway St | 0.43mi | 2/1.0 (-1) | 1,385 (+12%) | 6mo | $40,000 | $29 | 50 |
| 1120 Manning St | 0.64mi | 2/1.0 (-1) | 1,167 (-6%) | 10mo | $175,000 | $150 | 48 |
| 513 Greenwood St | 0.72mi | 3/1.0 | 1,340 (+8%) | 12mo | $108,000 | $81 | 42 |
| 1123 Manning St | 0.67mi | 3/1.0 | 1,080 (-13%) | 8mo | $171,000 | $158 | 41 |
| 608 Elm St | 0.65mi | 2/1.0 (-1) | 1,113 (-10%) | 14mo | $146,000 | $131 | 37 |
Match score weights: distance 35% · size 25% · config 20% · recency 20%. Top-matched comps best support the ARV.
Projected returns pro-forma
-3.0% appreciation · 3.0% rent growth · sell at horizon
- IRR
- -12.3%
- Equity multiple
- 0.56×
- Total profit
- $-15,367
- Equity at exit
- $18,414
- IRR
- -3.3%
- Equity multiple
- 0.78×
- Total profit
- $-7,508
- Equity at exit
- $10,678
Cash invested: $34,580 (down + closing). Projections, not guarantees.
Landlord ↔ Tenant lean methodology
- Overall (STATE)
- 85 Strongly Landlord-Friendly
- State North Carolina
- 85 Strongly Landlord-Friendly · R+3
- County
- — inherits STATE
- City
- — inherits STATE
ZIP-level market 27288
- Home prices YoY
- -26.5%
- Active inventory
- 208
- Price-to-rent
- 9.7×
Monthly cashflow live
- Estimated rent
- $1,060 medium interval (Pro) →
- Mortgage (P&I)
- −$648
- Tax from tax record
- −$65 /mo · $781/yr
- Insurance
- −$51
- HOA
- −$0
- Vacancy / Maint / Mgmt
- −$223
- Net cashflow
- $74
Break-even live
UW: 25.0% down · 7.5% · 30yr · 1.5% tax · 5.0% vac · 8.0% maint · 8.0% mgmt
Financing live
Cash to close
- Down payment
- $30,875
- Closing costs
- $3,705
- Reserves months
- —
- Total cash needed
- —
Loan-product check · same deal, 3 products live
Conventional
25% down · 7.5% · 30yr
- Down + closing
- —
- Monthly P&I
- —
- Monthly cashflow
- —
- DSCR
- —
- Eligible?
- —
Personal DTI + credit; lowest rate.
DSCR
20% down · 8.5% · 30yr
- Down + closing
- —
- Monthly P&I
- —
- Monthly cashflow
- —
- DSCR
- —
- Eligible?
- —
No personal income docs; deal must DSCR.
Hard money
10% down · 12.0% · 12mo
- Down + closing
- —
- Monthly P&I
- —
- Monthly cashflow
- —
- DSCR
- —
- Eligible?
- —
Short-term bridge; refi at stabilization.
Rent comps 2 comps
| Address | Beds | Baths | Sqft | Rent | $/sqft | DOM | Units | Dist |
|---|---|---|---|---|---|---|---|---|
| 326 Cedar St Unit H Eden, NC | 2.0 | 1.0 | 780 | $975 | $1.25 | 23d | 1 | 0.80mi |
| 704 Irving Ave Unit A Eden, NC | 2.0 | 1.0 | 900 | $900 | $1.00 | 23d | 1 | 0.93mi |
Listing history 24 events
-
2026-06-18days on market $123,500 Active 274 DOM
-
2026-06-17days on market $123,500 Active 273 DOM
-
2026-06-16days on market $123,500 Active 272 DOM
-
2026-06-15days on market $123,500 Active 271 DOM
-
2026-06-14days on market $123,500 Active 269 DOM
-
2026-06-13days on market $123,500 Active 268 DOM
-
2026-06-10days on market $123,500 Active 266 DOM
-
2026-06-09days on market $123,500 Active 265 DOM
-
2026-06-08days on market $123,500 Active 264 DOM
-
2026-06-07days on market $123,500 Active 263 DOM
-
2026-06-03days on market $123,500 Active 259 DOM
-
2026-06-02days on market $123,500 Active 258 DOM
-
2026-06-01days on market $123,500 Active 257 DOM
-
2026-05-31days on market $123,500 Active 256 DOM
-
2026-05-31days on market $123,500 Active 255 DOM
-
2026-05-04price $123,500
-
2026-03-31price $127,500
-
2026-01-20status Active
-
2026-01-16status Pending
-
2026-01-07historical Due Diligence Period
-
2025-09-12$118,000 Active
-
2024-07-31price $105,900
-
2023-12-27price $113,900
-
2023-10-05price $114,900
ⓘ Source: listings_history table (triggers on properties + properties_extension) + one-shot
backfill from property_details.listing_events for pre-trigger history.
Tax reassessment forecast NC · Resets to sale price
- Current annual tax
- $781 · $65/mo
- Projected year-2 tax
- $1,013 · $84/mo
- Expected delta
- +$232/yr (+$19/mo · 29.7%)
ⓘ Screening estimate from a state-policy table — verify with the county assessor before closing.
Climate risk First Street
- Flood 1/10 Low FEMA zone X (unshaded) · 0% chance over 30 yrs
- Wildfire 2/10 Low
- Heat 6/10 Major 7 d/yr ≥104°F today · 18 d/yr by 30 yrs out
- Wind 3/10 Moderate 6% chance of damaging wind over 30 yrs
- Air quality 2/10 Low 2 unhealthy d/yr today · 2 by 30 yrs out
Nearby sold comps map
Loading sold comps map…
Walkable amenities ~0.75 mi
Loading nearby amenities…
Taxation est. · year 1
- Rental income
- $12,725
- − Mortgage interest
- −$6,918
- − Property taxes
- −$781
- − Insurance
- −$618
- − Repairs & maintenance
- −$1,018
- − Management
- −$1,018
- − Depreciation
- −$3,593
- Taxable loss
- −$1,220
- Est. tax savings @ 24.0%
- +$293
- After-tax cash flow
- $1,175/yr
For passive investors: Depreciation is non-cash, so a rental often shows a tax loss while cash-flowing — sheltering income. Rental losses are passive: they offset passive income freely, and up to $25,000/yr can offset ordinary (W-2) income if you actively participate and your MAGI is under $100k (phasing out to $0 by $150k); unused losses carry forward. On sale, claimed depreciation is recaptured at up to 25%, and gains may owe capital-gains tax (a 1031 exchange can defer both). Figures are a year-1 estimate at your 24.0% rate — not tax advice; consult a CPA.
Schools (NCES district)
- District
- Rockingham County Schools
- NCES district ID
- 3703990
- Math proficiency
- 38% ▼ -2.00%
- Reading proficiency
- 40% ▲ 1.00%
- Median HH income
- $38,914
- Composite
- 32.6/100
- National rank
- #5673
- State rank
- #120 of 178 in NC
Livability — Eden
- Score
- 67/100
- State rank
- #224
- US rank
- #10535
Category grades
Schools grade is shown separately in the Schools card above.
Census & demographics
- Census place
- Eden, NC
- County
- Rockingham County · 22,926 people
- City population
- 22,926
- Metro
- Greensboro-High Point, NC
- Population (ZIP)
- 22,926
- Household income
- $52,594
- Rent vs Own
- Severe rent burden
- 860.0
Population outlook (Rockingham County) Hauer SSP2
- Today (2025)
- 87,103 people
- By 2030
- 83,763 · -3.8%
- By 2040
- 76,082 · -12.7%
- By 2050
- 68,106 · -21.8%
- By 2075
- 52,531 · -39.7%
- By 2100
- 39,871 · -54.2%
Race, ethnicity, and origin ACS 2023
- Neighborhood character
- Predominantly White (67%)
- Race & ethnicity
- White 67% Black 23% Hispanic / Latino 6% Two or more races 5% Native American 1%
- Hispanic origin (detail)
- Mexican 4%
- Common ancestry
- Serbian 2% Slovak 2% Lithuanian 1%
- Foreign-born
- 3% · Canada
- Languages at home
- 94% English-only · Spanish 5% German/W. Germanic 1%
Political lean MEDSL · Rockingham
- 2024 margin
- Solid R (+35.9) · D 31.7% · R 67.6%
- 2008→2024 swing
- -19.9pp toward R · 2008: -16.0pp · 2024: -35.9pp
- All cycles
- 2024: R+35.9 2020: R+32.0 2016: R+30.0 2012: R+21.3 2008: R+16.0
Not yet ingested
- Civics
- —
Market trends
- HPI YoY
- ▼ -66.28%
- Current HPI
- 183.5709
- Rent YoY
- —
- Metro
- Greensboro-High Point, NC
- State GDP YoY
- ▲ 3.28%
- F500 in state
- 26
Industry mix (Fortune 500 HQ in NC)
| Industry | F500 HQs | Revenue |
|---|---|---|
| Financial Services | 2 | $213B |
|
||
| Retail | 2 | $95B |
|
||
| Industrial Conglomerate | 1 | $38B |
|
||
| Metals / Steel | 1 | $35B |
|
||
| Utilities | 1 | $30B |
|
||
| Industrial Machinery | 1 | $19B |
|
||
Price history
+7.5% since first listed9 events — show timeline
- 2026-05-04 Price Changed $123,500 Triad MLS
- 2026-03-31 Price Changed $127,500 Triad MLS
- 2026-01-20 Relisted — Triad MLS
- 2026-01-16 Pending — Triad MLS
- 2026-01-07 Contingent — Triad MLS
- 2025-09-12 Listed $118,000 Triad MLS
- 2024-07-31 Price Changed $105,900 Triad MLS
- 2023-12-27 Price Changed $113,900 Triad MLS
- 2023-10-05 Price Changed $114,900 Triad MLS
Property tax history
+4.1%/yrLatest (2025): $781 · +0.0% YoY. Source: county tax records.
Cash-flow waterfall
monthlySold comps — $/sqft
last 12 mo · ≤1 miLoading sold comps…