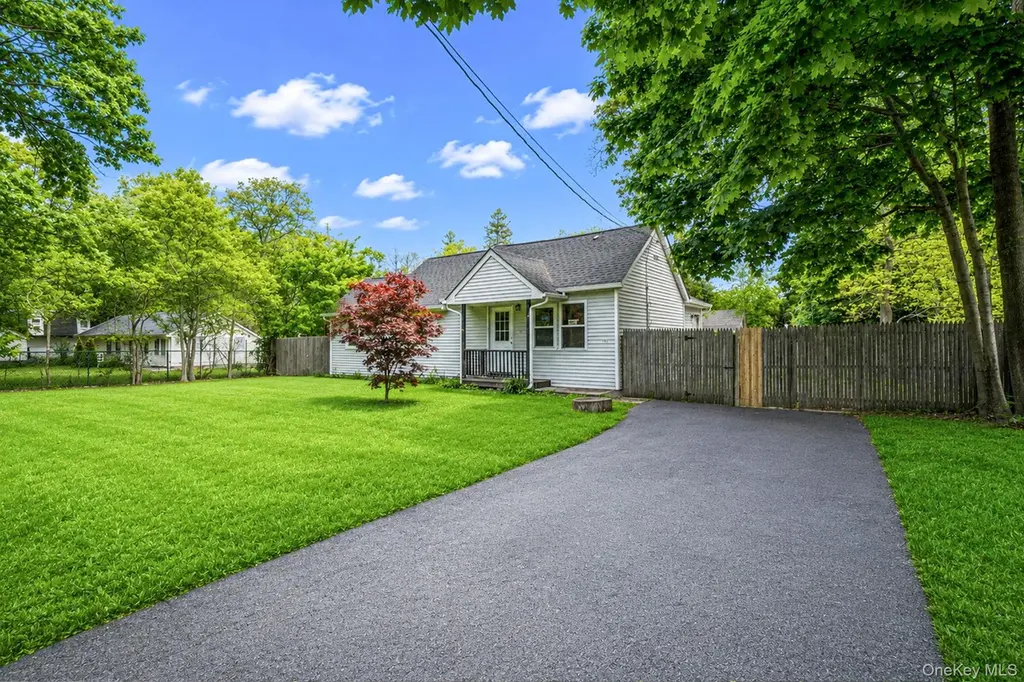
113 Huguenot Dr · Mastic Beach, NY
Flood risk 4/10 · Minor
- FEMA flood zone
- X (unshaded)
- Chance of flooding over 30 yrs
- 0.13%
- Est. flood insurance / yr
- $473 – $860
Fire risk 1/10 · Minimal
- Est. fire insurance / yr
- $691 – $1,283
Heat risk 4/10 · Minor
- Hot days now (above 92°F)
- 7 days/yr
- Hot days in 30 yrs
- 20 days/yr
Wind risk 8/10 · Major
- Chance of severe wind over 30 yrs
- 80.0%
Air-quality risk 4/10 · Minor
- Unhealthy air days now
- 3 days/yr
- Unhealthy air days in 30 yrs
- 5 days/yr
Risk factors via First Street. Map © Google.
Why this score? — see what drove the D- grade
The composite is a weighted blend of 9 inputs, each scored 0–100. Each bar is that input's sub-score; the figure is the points it added to the 100-point composite (weight × sub-score).
- Appreciation +10.0/10.0
- Cash flow +7.6/30.0
- Schools +4.7/10.0
- Livability +3.1/5.0
- ARV discount +2.7/15.0
- Rent growth +2.5/5.0
- Condition / age +2.5/5.0
- 1% rule +2.2/10.0
- DSCR +1.7/10.0
$385,000
🖨 Deal sheet 📄 Offer letter ✓ Due diligence
Listing remarks MLS
This Is A Fannie Mae Homepath Property. Three Bedroom Ranch With Eat In Kitchen, Living Room And One Full Bath. Full Unfinished Basement. Low Taxes! Close To Shopping, Restaurants And Smith Point Fire Island Ocean Beach.
Key facts
- Near dining
- Near shopping
- Eat in kitchen
Tags
Property features AI
Exterior
- Parking: Driveway parking; No carport
- Utilities: Cesspool sewer; Electricity connected
- Home design: Single-family residence; Living area reported from public records
- Construction: Vinyl siding
- Exterior features: Fenced yard; Not waterfront
Interior
- Kitchen: Oven; Refrigerator
- Bedrooms: Rooms total: 5 (includes bedrooms and living spaces)
- Bathrooms: 1 full bathroom
- Heating & cooling: Electric heating; No central cooling
- Interior features: First-floor bedroom; Eat-in kitchen; Basement with Bilco door(s)
- Laundry & utility: Basement access for utilities
Neighborhood map
What this means for you Summary
Snapshot
- This is a 3-bed/1.0-bath single-family listed at $385k.
Deal economics
- At list price, monthly cash flow is $-457 ($-5k/yr) — negative.
- To cash-flow at today's rent, offer at most $304k (21.0% below list).
- To meet the 1% rule (rent ≥ 1% of price), the offer needs to be $277k (27.9% below list).
- Recommended offer: $277k (27.9% below list) — sets the bar for 1% rule.
Location & tenants
- Location reads 61/100 on livability (#936 in NY) — a middle-class / working-renter tenant base. Strengths: employment A+, housing A+; Watch: crime D, amenities F, commute F.
- William Floyd Union Free School District (suburban): math 48% / reading 57% proficiency, ranked #309 of 590 in NY (top 52%) — acceptable for families but not a draw, mixed tenant base, ~2y average lease.
- Zoned schools: Tangier Smith Elementary School (math 43% / reading 54%, grade D, #1,181 of 2,108 statewide, top 56%, 755 students, 61% FRL); William Floyd Middle School (math 36% / reading 47%, grade F, #394 of 729 statewide, top 55%, 1,053 students, 54% FRL); William Floyd High School (math 65% / reading 87%, grade A-, #616 of 1,100 statewide, top 57%, 3,013 students, 54% FRL).
- Market conditions: 133 active listings in the ZIP; 2 comparable units currently listed for rent nearby; 1,366 units permitted in Suffolk County in 2024 (216 in 5+ unit buildings).
Forward outlook
- In year one you build about $41k of equity ($3k loan paydown + $38k appreciation (10.0% local appreciation)).
- Suffolk County population projected to shrink 5% by 2050 — rents likely to lag national; underwrite the cash flow, not the appreciation.
- By year 2, paydown + projected appreciation supports a ~$66k cash-out refi (75% LTV) — recoverable capital for the next deal without selling this one.
Negotiation context
- It's been on market 22 days — a 2% lower offer ($379k) is reasonable based on typical stale-listing flexibility.
- 3 sale attempts since 10y ago with the ask held roughly flat each time — persistent listings suggest the price (not the market) is what's stuck; bring a comps-based counter.
- Current owner paid $62k; list at $385k implies a 526% gain — meaningful room to come down on a strong offer.
Risks & watch-outs
- Watch-outs: built in 1954 — expect roof / HVAC / electrical / plumbing capex.
- Climate carrying-cost: severe wind risk, 80% chance of damaging wind over 30y — expect insurance premiums to compound above CPI over the hold.
Questions for the listing agent
- What do current leases actually rent for vs. the listed asking? Can we see a recent rent roll and the last 12 months of T-12 income?
- Built in 1954 — when were the roof, HVAC, electrical panel, plumbing, and water heater last replaced?
- Is there a deadline driving the sale (1031 exchange, divorce, estate, relocation)? That informs how much negotiation room exists.
- Schools are D-rated, which usually means shorter tenancies and higher turnover. Who's the typical renter profile here, and what's been the actual vacancy rate?
- Crime grade is D in this area — have there been break-ins, vandalism, or insurance claims at this property in the last 3 years? What carrier currently insures it and at what premium?
- The area grade is low — what's the realistic commute time and amenity access for the typical tenant pool here? Any planned neighborhood developments (good or bad) we should know about?
- What's the average days-on-market for RENTAL listings here right now (not sales)? A rising rental-DOM trend means longer vacancies and softer asking-rent achievability than the comps imply.
- What's the recent tenant-quality profile in this submarket — average credit score on applications, eviction rate, late-payment / NSF rate, and stable-employment percentage? A property-management company in the area should have these aggregated.
- How much new for-sale + rental construction is in the pipeline within 1–3 miles? Heavy new supply typically softens prices + rents 12–24 months out; constrained supply supports both.
Investment metrics
- 1% rule
- 0.72% ✗
- Cap rate
- 4.87%
- Cash-on-cash
- -5.09%
- DSCR
- 0.77
- GRM
- 11.6
CMA / ARV
- ARV (on-the-fly)
- $347,598
- Comps found
- 10
Show comp detail 10 sales within ~0.75 mi
| Address | Dist | Beds/Ba | Sqft | Sold | Price | $/sf | Match |
|---|---|---|---|---|---|---|---|
| 128 Maywood Dr | 0.18mi | 3/1.0 | 756 (+2%) | 14mo | $420,000 | $556 | 76 |
| 123 Lynbrook Dr | 0.10mi | 2/1.0 (-1) | 795 (+8%) | 3mo | $370,000 | $465 | 75 |
| 32 Bogota Rd | 0.26mi | 3/1.0 | 748 (+1%) | 16mo | $360,000 | $481 | 73 |
| 88 Woodside Rd | 0.17mi | 3/1.0 | 800 (+8%) | 10mo | $369,000 | $461 | 70 |
| 192 E Parkview Dr | 0.33mi | 3/1.0 | 800 (+8%) | 6mo | $377,000 | $471 | 65 |
| 80 Bayview Dr | 0.50mi | 3/1.0 | 720 (-2%) | 11mo | $309,000 | $429 | 63 |
| 116 Elder Dr | 0.25mi | 2/1.0 (-1) | 682 (-8%) | 15mo | $215,000 | $315 | 58 |
| 180 Woodside Rd | 0.32mi | 2/1.0 (-1) | 694 (-6%) | 22mo | $380,000 | $548 | 52 |
| 21 Sherwood Dr | 0.65mi | 3/1.0 | 800 (+8%) | 9mo | $350,000 | $438 | 48 |
| 706 Riviera Dr | 0.57mi | 2/1.0 (-1) | 810 (+10%) | 13mo | $395,000 | $488 | 41 |
Match score weights: distance 35% · size 25% · config 20% · recency 20%. Top-matched comps best support the ARV.
Projected returns pro-forma
10.0% appreciation · 3.0% rent growth · sell at horizon
- IRR
- 20.7%
- Equity multiple
- 2.68×
- Total profit
- $180,608
- Equity at exit
- $346,839
- IRR
- 18.8%
- Equity multiple
- 6.15×
- Total profit
- $554,820
- Equity at exit
- $747,970
Cash invested: $107,800 (down + closing). Projections, not guarantees.
Landlord ↔ Tenant lean methodology
- Overall (STATE)
- 15 Strongly Tenant-Friendly
- State New York
- 15 Strongly Tenant-Friendly · D+10
- County
- — inherits STATE
- City
- — inherits STATE
ZIP-level market 11951
- Home prices YoY
- 4.3%
- Active inventory
- 133
- Price-to-rent
- 11.6×
Monthly cashflow live
- Estimated rent
- $2,774 medium interval (Pro) →
- Mortgage (P&I)
- −$2,019
- Tax from tax record
- −$469 /mo · $5,629/yr
- Insurance
- −$160
- HOA
- −$0
- Vacancy / Maint / Mgmt
- −$583
- Net cashflow
- $-457
Break-even live
UW: 25.0% down · 7.5% · 30yr · 1.5% tax · 5.0% vac · 8.0% maint · 8.0% mgmt
Financing live
Cash to close
- Down payment
- $96,250
- Closing costs
- $11,550
- Reserves months
- —
- Total cash needed
- —
Loan-product check · same deal, 3 products live
Conventional
25% down · 7.5% · 30yr
- Down + closing
- —
- Monthly P&I
- —
- Monthly cashflow
- —
- DSCR
- —
- Eligible?
- —
Personal DTI + credit; lowest rate.
DSCR
20% down · 8.5% · 30yr
- Down + closing
- —
- Monthly P&I
- —
- Monthly cashflow
- —
- DSCR
- —
- Eligible?
- —
No personal income docs; deal must DSCR.
Hard money
10% down · 12.0% · 12mo
- Down + closing
- —
- Monthly P&I
- —
- Monthly cashflow
- —
- DSCR
- —
- Eligible?
- —
Short-term bridge; refi at stabilization.
Rent comps 2 comps
| Address | Beds | Baths | Sqft | Rent | $/sqft | DOM | Units | Dist |
|---|---|---|---|---|---|---|---|---|
| 79 Manor Dr Shirley, NY | 2.0 | 1.0 | 600 | $2,800 | $4.67 | 1d | 1 | 0.94mi |
| 67 Saint George Dr Shirley, NY | 2.0 | 1.0 | 714 | $2,750 | $3.85 | 44d | 1 | 1.03mi |
Listing history 21 events
-
2026-06-18days on market $385,000 Active 22 DOM
-
2026-06-17days on market $385,000 Active 21 DOM
-
2026-06-16days on market $385,000 Active 20 DOM
-
2026-06-15days on market $385,000 Active 19 DOM
-
2026-06-13days on market $385,000 Active 17 DOM
-
2026-06-13days on market $385,000 Active 16 DOM
-
2026-06-09days on market $385,000 Active 13 DOM
-
2026-06-08days on market $385,000 Active 12 DOM
-
2026-06-07days on market $385,000 Active 11 DOM
-
2026-06-04days on market $385,000 Active 8 DOM
-
2026-06-03days on market $385,000 Active 7 DOM
-
2026-06-02days on market $385,000 Active 6 DOM
-
2026-06-01days on market $385,000 Active 5 DOM
-
2026-05-31days on market $385,000 Active 4 DOM
-
2026-05-27$385,000 Active
-
2016-06-14soldstatus $61,500 220-char remark
Show marketing remark (220 chars)
This Is A Fannie Mae Homepath Property. Three Bedroom Ranch With Eat In Kitchen, Living Room And One Full Bath. Full Unfinished Basement. Low Taxes! Close To Shopping, Restaurants And Smith Point Fire Island Ocean Beach.
-
2016-06-14soldstatus $61,500 Closed 220-char remark
Show marketing remark (220 chars)
This Is A Fannie Mae Homepath Property. Three Bedroom Ranch With Eat In Kitchen, Living Room And One Full Bath. Full Unfinished Basement. Low Taxes! Close To Shopping, Restaurants And Smith Point Fire Island Ocean Beach.
-
2016-05-25status Under Contract 220-char remark
Show marketing remark (220 chars)
This Is A Fannie Mae Homepath Property. Three Bedroom Ranch With Eat In Kitchen, Living Room And One Full Bath. Full Unfinished Basement. Low Taxes! Close To Shopping, Restaurants And Smith Point Fire Island Ocean Beach.
-
2016-04-22$56,000 New 220-char remark
Show marketing remark (220 chars)
This Is A Fannie Mae Homepath Property. Three Bedroom Ranch With Eat In Kitchen, Living Room And One Full Bath. Full Unfinished Basement. Low Taxes! Close To Shopping, Restaurants And Smith Point Fire Island Ocean Beach.
-
2016-04-21$56,000 220-char remark
Show marketing remark (220 chars)
This Is A Fannie Mae Homepath Property. Three Bedroom Ranch With Eat In Kitchen, Living Room And One Full Bath. Full Unfinished Basement. Low Taxes! Close To Shopping, Restaurants And Smith Point Fire Island Ocean Beach.
-
1986-11-18soldstatus $45,000
ⓘ Source: listings_history table (triggers on properties + properties_extension) + one-shot
backfill from property_details.listing_events for pre-trigger history.
Tax reassessment forecast NY · Partial reset (capped growth)
- Current annual tax
- $5,629 · $469/mo
- Projected year-2 tax
- $6,068 · $506/mo
- Expected delta
- +$439/yr (+$37/mo · 7.8%)
ⓘ Screening estimate from a state-policy table — verify with the county assessor before closing.
Climate risk First Street
- Flood 4/10 Moderate FEMA zone X (unshaded) · 13% chance over 30 yrs
- Wildfire 1/10 Low
- Heat 4/10 Moderate 7 d/yr ≥92°F today · 20 d/yr by 30 yrs out
- Wind 8/10 Severe 80% chance of damaging wind over 30 yrs
- Air quality 4/10 Moderate 3 unhealthy d/yr today · 5 by 30 yrs out
Nearby sold comps map
Loading sold comps map…
Walkable amenities ~0.75 mi
Loading nearby amenities…
Taxation est. · year 1
- Rental income
- $33,288
- − Mortgage interest
- −$21,566
- − Property taxes
- −$5,629
- − Insurance
- −$1,925
- − Repairs & maintenance
- −$2,663
- − Management
- −$2,663
- − Depreciation
- −$11,200
- Taxable loss
- −$12,358
- Est. tax savings @ 24.0%
- +$2,966
- After-tax cash flow
- $-2,518/yr
For passive investors: Depreciation is non-cash, so a rental often shows a tax loss while cash-flowing — sheltering income. Rental losses are passive: they offset passive income freely, and up to $25,000/yr can offset ordinary (W-2) income if you actively participate and your MAGI is under $100k (phasing out to $0 by $150k); unused losses carry forward. On sale, claimed depreciation is recaptured at up to 25%, and gains may owe capital-gains tax (a 1031 exchange can defer both). Figures are a year-1 estimate at your 24.0% rate — not tax advice; consult a CPA.
Schools (NCES district)
- District
- William Floyd Union Free School District
- NCES district ID
- 3618690
- Math proficiency
- 48% ▲ 3.00%
- Reading proficiency
- 57% ▲ 11.00%
- Median HH income
- $70,564
- Composite
- 46.79/100
- National rank
- #2383
- State rank
- #309 of 590 in NY
Livability — Mastic Beach
- Score
- 61/100
- State rank
- #936
- US rank
- #18216
Category grades
Schools grade is shown separately in the Schools card above.
Census & demographics
- Census place
- Mastic Beach, NY
- City population
- 15,830
- Population (ZIP)
- 15,830
Population outlook (Suffolk County) Hauer SSP2
- Today (2025)
- 1,505,262 people
- By 2030
- 1,498,318 · -0.5%
- By 2040
- 1,471,101 · -2.3%
- By 2050
- 1,424,848 · -5.3%
- By 2075
- 1,337,157 · -11.2%
- By 2100
- 1,217,720 · -19.1%
Race, ethnicity, and origin ACS 2023
- Neighborhood character
- Predominantly White (68%)
- Race & ethnicity
- White 68% Hispanic / Latino 17% Two or more races 9% Black 6% Asian 2%
- Hispanic origin (detail)
- Mexican 1% Puerto Rican 6% Cuban 2%
- Common ancestry
- Lithuanian 3% Romanian 2% Italian 2%
- Foreign-born
- 7% · Canada, Vietnam
- Languages at home
- 84% English-only · Spanish 10% Other Indo-European 3% Chinese 1%
Political lean MEDSL · Suffolk
- 2024 margin
- Lean R (+10.0) · D 45.0% · R 55.0%
- 2008→2024 swing
- -16.0pp toward R · 2008: 6.0pp · 2024: -10.0pp
- All cycles
- 2024: R+10.0 2020: R+0.0 2016: R+8.2 2012: D+2.9 2008: D+6.0
Not yet ingested
- Civics
- —
Market trends
- HPI YoY
- ▲ 34.46%
- Current HPI
- 829.86
- Rent YoY
- —
- Metro
- —
- State GDP YoY
- ▲ 2.60%
- F500 in state
- 92
Industry mix (Fortune 500 HQ in NY)
| Industry | F500 HQs | Revenue |
|---|---|---|
| Financial Services | 10 | $950B |
|
||
| Consumer Goods | 9 | $162B |
|
||
| Insurance | 4 | $225B |
|
||
| Telecommunications | 2 | $144B |
|
||
| Pharmaceuticals | 2 | $112B |
|
||
| Media / Entertainment | 2 | $69B |
|
||
Price history
+755.6% since first listed7 events — show timeline
- 2026-05-27 Listed $385,000 OneKey® MLS as Distributed by MLS Grid
- 2016-06-14 Sold (MLS) $61,500 OneKey® MLS as Distributed by MLS Grid
- 2016-06-14 Sold (MLS) $61,500 MLSLI
- 2016-05-25 Pending — MLSLI
- 2016-04-22 Listed $56,000 MLSLI
- 2016-04-21 Listed $56,000 OneKey® MLS as Distributed by MLS Grid
- 1986-11-18 Sold (Public Records) $45,000 Public Records
Property tax history
+1.7%/yrLatest (2025): $5,629 · +0.0% YoY. Source: county tax records.
Cash-flow waterfall
monthlySold comps — $/sqft
last 12 mo · ≤1 miLoading sold comps…