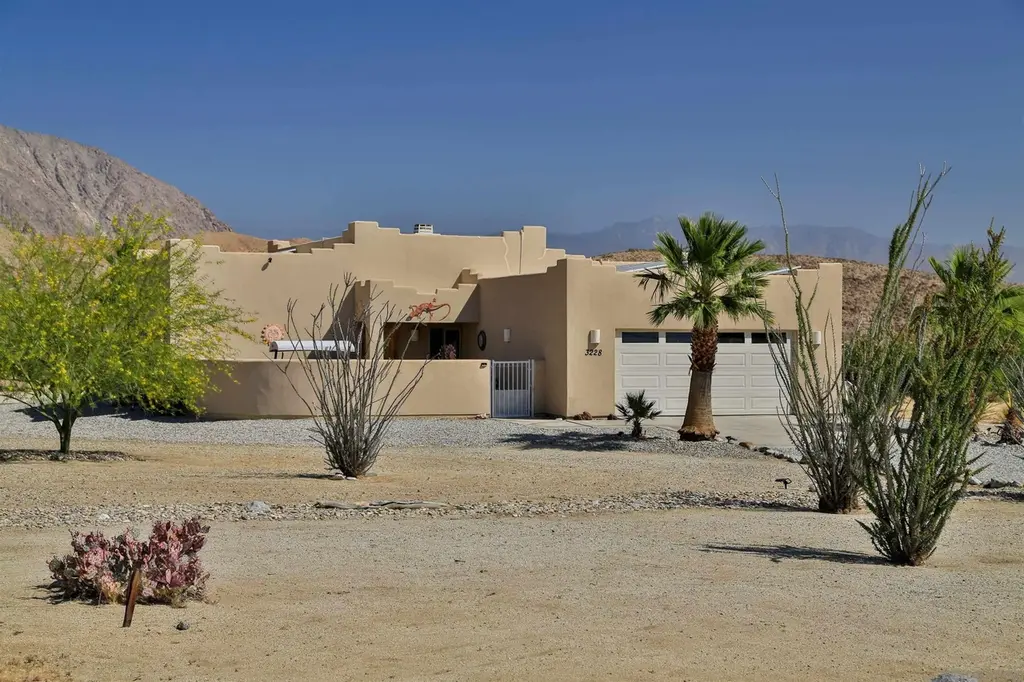
3228 Broken Arrow Rd · Borrego Springs, CA
Flood risk 4/10 · Minor
- FEMA flood zone
- AO
- Chance of flooding over 30 yrs
- 0.22%
- Est. flood insurance / yr
- $848 – $2,087
Fire risk 2/10 · Minimal
- Est. fire insurance / yr
- $659 – $1,223
Heat risk 9/10 · Severe
- Hot days now (above 111°F)
- 11 days/yr
- Hot days in 30 yrs
- 33 days/yr
Wind risk 1/10 · Minimal
- Chance of severe wind over 30 yrs
- —
Air-quality risk 4/10 · Minor
- Unhealthy air days now
- 4 days/yr
- Unhealthy air days in 30 yrs
- 5 days/yr
Risk factors via First Street. Map © Google.
Why this score? — see what drove the D+ grade
The composite is a weighted blend of 9 inputs, each scored 0–100. Each bar is that input's sub-score; the figure is the points it added to the 100-point composite (weight × sub-score).
- Cash flow +25.1/30.0
- DSCR +8.2/10.0
- 1% rule +5.5/10.0
- Livability +2.9/5.0
- Schools +2.6/10.0
- Rent growth +2.5/5.0
- Condition / age +2.5/5.0
- ARV discount +0.0/15.0
- Appreciation +0.0/10.0
$475,000
🖨 Deal sheet 📄 Offer letter ✓ Due diligence
Listing remarks MLS
Single owner custom home on .89 acres. This turn key home features an open floor plan, 2 outdoor patio areas, a sparkling pool with views of Indian Head Mountain, an enclosed sun room, dual master bedrooms, rock fireplace in the living room, bar seating in the kitchen, and lots of tile. The entire home is outfitted in high end bronze hardware and includes an evaporative cooler and an on demand water heater. Offered mostly furnished!
Key facts
- Open floor plan
- Rock fireplace
- Private walled patio
Tags
Property features AI
Exterior
- Parking: 4 total parking spaces; 2-car attached garage
- Utilities: Electricity available and connected; Cable available; Phone available; Water connected; Septic tank
- Home design: Single family detached residence; One story
- Construction: Stucco construction; Rolled/Hot Mop roof
- Exterior features: Enclosed patio; Patio; Private in-ground pool; Solar panels; Has a view; Automatic irrigation; Publicly maintained road
Interior
- Kitchen: Microwave, Refrigerator, Range, Oven
- Bedrooms: 2 possible bedrooms
- Flooring: Carpet; Tile
- Bathrooms: 2 full bathrooms
- Heating & cooling: Central air conditioning; Forced air heating; Electric heating; Wood-burning fireplace
- Interior features: Fireplace in the living room; Microwave, Refrigerator, Range, Oven, Electric water heater
- Laundry & utility: Electric water heater
Neighborhood map
What this means for you Summary
Snapshot
- This is a 2-bed/2.0-bath single-family listed at $475k.
Deal economics
- At list price, monthly cash flow is $923 ($11k/yr) — positive.
- The deal already cash-flows at list — no discount required.
- Meets the 1% rule at list price ($5k rent vs $475k).
- Cap rate 8.9% vs local median 6.0% in Borrego Springs — top-decile yield for the area; either an underpriced asset or a hidden risk that comps aren't pricing in. Stress-test before assuming the spread holds.
Location & tenants
- Location reads 58/100 on livability (#712 in CA) — a working-class tenant base; expect higher turnover. Strengths: crime A+, employment A+, housing A+; Watch: schools F, amenities F, commute F.
- Borrego Springs Unified (rural): math 20% / reading 35% proficiency, ranked #1,120 of 1,400 in CA (top 80%) — low school quality limits family demand, transient renter base, plan for 1-2y turnover; 72% free/reduced lunch — lower-income household profile, screen leases tightly.
- Market conditions: 174 active listings in the ZIP; 1 comparable units currently listed for rent nearby; 11,759 units permitted in San Diego County in 2024 (7,244 in 5+ unit buildings).
Forward outlook
- Local home prices are declining (-3.0%/yr); year-one equity from $3k of loan paydown is wiped out by about $14k of value loss. Plan a longer hold.
- San Diego County population projected at +20% by 2050 — long-run rental-demand tailwind backs the buy-and-hold thesis.
Negotiation context
- Only 7 days on market — expect competitive offers; lowballing is unlikely to land.
- 9 sale attempts since 19y ago with the ask held roughly flat each time — persistent listings suggest the price (not the market) is what's stuck; bring a comps-based counter.
- Current owner paid $275k; list at $475k implies a 73% gain — meaningful room to come down on a strong offer.
Risks & watch-outs
- Watch-outs: flood insurance adds $122/mo.
- Climate carrying-cost: in FEMA flood zone AO (mandatory federal flood insurance); extreme-heat days projected 11→33/yr by 2055 (HVAC capex compounding) — expect insurance premiums to compound above CPI over the hold.
Questions for the listing agent
- What's the actual annual flood-insurance premium (NFIP or private), and is the property in a SFHA with mandatory coverage?
- Is there a deadline driving the sale (1031 exchange, divorce, estate, relocation)? That informs how much negotiation room exists.
- Schools are F-rated, which usually means shorter tenancies and higher turnover. Who's the typical renter profile here, and what's been the actual vacancy rate?
- The area grade is low — what's the realistic commute time and amenity access for the typical tenant pool here? Any planned neighborhood developments (good or bad) we should know about?
- What's the average days-on-market for RENTAL listings here right now (not sales)? A rising rental-DOM trend means longer vacancies and softer asking-rent achievability than the comps imply.
- What's the recent tenant-quality profile in this submarket — average credit score on applications, eviction rate, late-payment / NSF rate, and stable-employment percentage? A property-management company in the area should have these aggregated.
- How much new for-sale + rental construction is in the pipeline within 1–3 miles? Heavy new supply typically softens prices + rents 12–24 months out; constrained supply supports both.
Investment metrics
- 1% rule
- 1.05% ✓
- Cap rate
- 8.93%
- Cash-on-cash
- 9.43%
- DSCR
- 1.42
- GRM
- 7.9
CMA / ARV
- ARV (on-the-fly)
- $403,854
- Comps found
- 3
Show comp detail 3 sales within ~0.75 mi
| Address | Dist | Beds/Ba | Sqft | Sold | Price | $/sf | Match |
|---|---|---|---|---|---|---|---|
| 3291 Country Club Rd | 0.25mi | 3/2.0 (+1) | 1,188 (-6%) | 12mo | $380,000 | $320 | 63 |
| 3145 Flying H Rd | 0.65mi | 3/2.0 (+1) | 1,446 (+14%) | 12mo | $334,300 | $231 | 31 |
| 3014 Broken Arrow Rd | 0.61mi | 3/2.0 (+1) | 1,412 (+12%) | 22mo | $450,000 | $319 | 29 |
Match score weights: distance 35% · size 25% · config 20% · recency 20%. Top-matched comps best support the ARV.
Projected returns pro-forma
-3.0% appreciation · 3.0% rent growth · sell at horizon
- IRR
- -3.7%
- Equity multiple
- 0.86×
- Total profit
- $-18,262
- Equity at exit
- $70,824
- IRR
- 6.0%
- Equity multiple
- 1.45×
- Total profit
- $59,467
- Equity at exit
- $41,069
Cash invested: $133,000 (down + closing). Projections, not guarantees.
Landlord ↔ Tenant lean methodology
- Overall (STATE)
- 18 Strongly Tenant-Friendly
- State California
- 18 Strongly Tenant-Friendly · D+13
- County
- — inherits STATE
- City
- — inherits STATE
ZIP-level market 92004
- Home prices YoY
- -18.4%
- Active inventory
- 174
- Price-to-rent
- 7.9×
Monthly cashflow live
- Estimated rent
- $5,000 medium interval (Pro) →
- Mortgage (P&I)
- −$2,491
- Tax from tax record
- −$216 /mo · $2,589/yr
- Insurance
- −$198
- Flood insurance flood zone
- −$122 /mo · $1,468/yr
- HOA
- −$0
- Vacancy / Maint / Mgmt
- −$1,050
- Net cashflow
- $923
Break-even live
UW: 25.0% down · 7.5% · 30yr · 1.5% tax · 5.0% vac · 8.0% maint · 8.0% mgmt
Financing live
Cash to close
- Down payment
- $118,750
- Closing costs
- $14,250
- Reserves months
- —
- Total cash needed
- —
Loan-product check · same deal, 3 products live
Conventional
25% down · 7.5% · 30yr
- Down + closing
- —
- Monthly P&I
- —
- Monthly cashflow
- —
- DSCR
- —
- Eligible?
- —
Personal DTI + credit; lowest rate.
DSCR
20% down · 8.5% · 30yr
- Down + closing
- —
- Monthly P&I
- —
- Monthly cashflow
- —
- DSCR
- —
- Eligible?
- —
No personal income docs; deal must DSCR.
Hard money
10% down · 12.0% · 12mo
- Down + closing
- —
- Monthly P&I
- —
- Monthly cashflow
- —
- DSCR
- —
- Eligible?
- —
Short-term bridge; refi at stabilization.
Rent comps 1 comps
| Address | Beds | Baths | Sqft | Rent | $/sqft | DOM | Units | Dist |
|---|---|---|---|---|---|---|---|---|
| 3382 Bar O Dr Borrego Springs, CA | 3.0 | 2.0 | 1720 | $5,000 | $2.91 | 1d | 1 | 0.45mi |
Listing history 26 events
-
2026-06-01status $475,000 Pending 7 DOM
-
2026-06-01days on market $475,000 Active 7 DOM
-
2026-05-31days on market $475,000 Active 6 DOM
-
2026-05-31days on market $475,000 Active 5 DOM
-
2026-05-25$475,000 Active
-
2018-06-29soldstatus $275,000 Sold 439-char remark
Show marketing remark (439 chars)
Single owner custom home on .89 acres. This turn key home features an open floor plan, 2 outdoor patio areas, a sparkling pool with views of Indian Head Mountain, an enclosed sun room, dual master bedrooms, rock fireplace in the living room, bar seating in the kitchen, and lots of tile. The entire home is outfitted in high end bronze hardware and includes an evaporative cooler and an on demand water heater. Offered mostly furnished!
-
2018-06-28soldstatus $275,000
-
2018-06-04status Pending 439-char remark
Show marketing remark (439 chars)
Single owner custom home on .89 acres. This turn key home features an open floor plan, 2 outdoor patio areas, a sparkling pool with views of Indian Head Mountain, an enclosed sun room, dual master bedrooms, rock fireplace in the living room, bar seating in the kitchen, and lots of tile. The entire home is outfitted in high end bronze hardware and includes an evaporative cooler and an on demand water heater. Offered mostly furnished!
-
2018-05-12$299,000 Active 439-char remark
Show marketing remark (439 chars)
Single owner custom home on .89 acres. This turn key home features an open floor plan, 2 outdoor patio areas, a sparkling pool with views of Indian Head Mountain, an enclosed sun room, dual master bedrooms, rock fireplace in the living room, bar seating in the kitchen, and lots of tile. The entire home is outfitted in high end bronze hardware and includes an evaporative cooler and an on demand water heater. Offered mostly furnished!
-
2013-06-01historical
-
2013-05-31historical
-
2012-11-28$275,000 Active
-
2012-11-28$275,000
-
2012-08-30historical
-
2012-08-29historical
-
2012-04-01price $295,000
-
2012-04-01status Active
-
2012-03-01historical
-
2011-11-30$299,000 Active
-
2011-11-29$295,000
-
2008-11-04historical
-
2008-11-04historical
-
2008-03-10price $399,959
-
2007-11-26price $425,000
-
2007-10-29$399,959
-
2007-10-29$399,959
ⓘ Source: listings_history table (triggers on properties + properties_extension) + one-shot
backfill from property_details.listing_events for pre-trigger history.
Tax reassessment forecast CA · Resets to sale price
- Current annual tax
- $2,589 · $216/mo
- Projected year-2 tax
- $3,610 · $301/mo
- Expected delta
- +$1,021/yr (+$85/mo · 39.4%)
ⓘ Screening estimate from a state-policy table — verify with the county assessor before closing.
Climate risk First Street
- Flood 4/10 Moderate FEMA zone AO · 22% chance over 30 yrs
- Wildfire 2/10 Low
- Heat 9/10 Extreme 11 d/yr ≥111°F today · 33 d/yr by 30 yrs out
- Wind 1/10 Low
- Air quality 4/10 Moderate 4 unhealthy d/yr today · 5 by 30 yrs out
Nearby sold comps map
Loading sold comps map…
Walkable amenities ~0.75 mi
Loading nearby amenities…
Taxation est. · year 1
- Rental income
- $60,000
- − Mortgage interest
- −$26,607
- − Property taxes
- −$2,589
- − Insurance
- −$3,842
- − Repairs & maintenance
- −$4,800
- − Management
- −$4,800
- − Depreciation
- −$13,818
- Taxable income
- $3,542
- Est. tax owed @ 24.0%
- −$850
- After-tax cash flow
- $10,226/yr
For passive investors: Depreciation is non-cash, so a rental often shows a tax loss while cash-flowing — sheltering income. Rental losses are passive: they offset passive income freely, and up to $25,000/yr can offset ordinary (W-2) income if you actively participate and your MAGI is under $100k (phasing out to $0 by $150k); unused losses carry forward. On sale, claimed depreciation is recaptured at up to 25%, and gains may owe capital-gains tax (a 1031 exchange can defer both). Figures are a year-1 estimate at your 24.0% rate — not tax advice; consult a CPA.
Schools (NCES district)
- District
- Borrego Springs Unified
- NCES district ID
- 0605700
- Math proficiency
- 20% ▼ -6.00%
- Reading proficiency
- 35% ▼ -6.00%
- Median HH income
- $42,330
- Composite
- 26.31/100
- National rank
- #12684
- State rank
- #1120 of 1400 in CA
Livability — Borrego Springs
- Score
- 58/100
- State rank
- #712
- US rank
- #21334
Category grades
Schools grade is shown separately in the Schools card above.
Census & demographics
- Census place
- Borrego Springs, CA
- Population (ZIP)
- 3,030
Population outlook (San Diego County) Hauer SSP2
- Today (2025)
- 3,678,185 people
- By 2030
- 3,856,546 · +4.8%
- By 2040
- 4,171,407 · +13.4%
- By 2050
- 4,421,607 · +20.2%
- By 2075
- 4,831,599 · +31.4%
- By 2100
- 4,832,502 · +31.4%
Race, ethnicity, and origin ACS 2023
- Neighborhood character
- Predominantly White (66%)
- Race & ethnicity
- White 66% Hispanic / Latino 33% Two or more races 24%
- Hispanic origin (detail)
- Mexican 29%
- Common ancestry
- Lithuanian 10% Slovak 5% Scotch-Irish 1%
- Foreign-born
- 27% · Canada
- Languages at home
- 70% English-only · Spanish 30%
Political lean MEDSL · San Diego
- 2024 margin
- D (+16.8) · D 56.9% · R 40.1% · Other 2.9%
- 2008→2024 swing
- +6.6pp toward D · 2008: 10.2pp · 2024: 16.8pp
- All cycles
- 2024: D+16.8 2020: D+22.8 2016: D+17.8 2012: D+5.1 2008: D+10.2
Not yet ingested
- Civics
- —
Market trends
- HPI YoY
- ▼ -50.39%
- Current HPI
- 222.8196
- Rent YoY
- —
- Metro
- —
- State GDP YoY
- ▲ 3.21%
- F500 in state
- 116
Industry mix (Fortune 500 HQ in CA)
| Industry | F500 HQs | Revenue |
|---|---|---|
| Technology | 27 | $1,492B |
|
||
| Financial Services | 3 | $174B |
|
||
| Retail | 3 | $44B |
|
||
| Insurance | 3 | $26B |
|
||
| Media / Entertainment | 2 | $115B |
|
||
| Pharmaceuticals / Biotech | 2 | $62B |
|
||
Price history
+18.8% since first listed22 events — show timeline
- 2026-05-25 Listed $475,000 SDMLS
- 2018-06-29 Sold (MLS) $275,000 SDMLS
- 2018-06-28 Sold (Public Records) $275,000 Public Records
- 2018-06-04 Pending — SDMLS
- 2018-05-12 Listed $299,000 SDMLS
- 2013-06-01 Listing Removed — SDMLS
- 2013-05-31 Listing Removed — CRMLS
- 2012-11-28 Listed $275,000 SDMLS
- 2012-11-28 Listed $275,000 CRMLS
- 2012-08-30 Listing Removed — SDMLS
- 2012-08-29 Listing Removed — CRMLS
- 2012-04-01 Price Changed $295,000 SDMLS
- 2012-04-01 Relisted — SDMLS
- 2012-03-01 Listing Removed — SDMLS
- 2011-11-30 Listed $299,000 SDMLS
- 2011-11-29 Listed $295,000 CRMLS
- 2008-11-04 Listing Removed — CRMLS
- 2008-11-04 Listing Removed — SDMLS
- 2008-03-10 Price Changed $399,959 SDMLS
- 2007-11-26 Price Changed $425,000 SDMLS
- 2007-10-29 Listed $399,959 CRMLS
- 2007-10-29 Listed $399,959 SDMLS
Property tax history
+0.4%/yrLatest (2025): $2,589 · +2.2% YoY. Source: county tax records.
Cash-flow waterfall
monthlySold comps — $/sqft
last 12 mo · ≤1 miLoading sold comps…