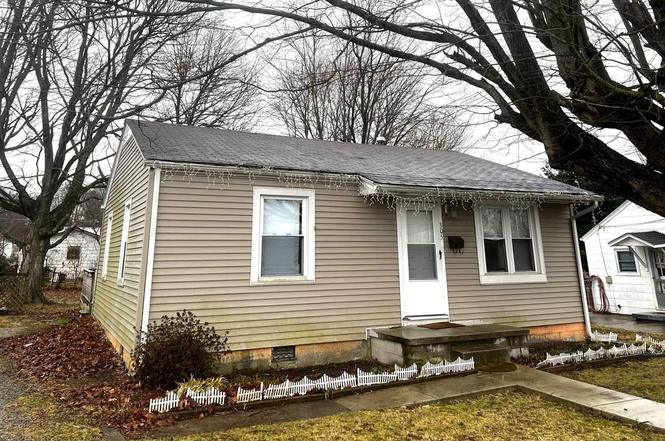
305 Sycamore St · Elizabethtown, KY
Flood risk 1/10 · Minimal
- FEMA flood zone
- X (unshaded)
- Chance of flooding over 30 yrs
- 0.0%
- Est. flood insurance / yr
- $507 – $1,088
Fire risk 3/10 · Minor
- Est. fire insurance / yr
- $839 – $1,559
Heat risk 5/10 · Moderate
- Hot days now (above 104°F)
- 7 days/yr
- Hot days in 30 yrs
- 19 days/yr
Wind risk 2/10 · Minimal
- Chance of severe wind over 30 yrs
- 2.0%
Air-quality risk 1/10 · Minimal
- Unhealthy air days now
- 0 days/yr
- Unhealthy air days in 30 yrs
- 0 days/yr
Risk factors via First Street. Map © Google.
Why this score? — see what drove the D+ grade
The composite is a weighted blend of 9 inputs, each scored 0–100. Each bar is that input's sub-score; the figure is the points it added to the 100-point composite (weight × sub-score).
- ARV discount +15.0/15.0
- Cash flow +13.8/30.0
- DSCR +4.2/10.0
- Livability +3.6/5.0
- Rent growth +3.3/5.0
- 1% rule +3.1/10.0
- Schools +2.9/10.0
- Condition / age +2.5/5.0
- Appreciation +0.0/10.0
$155,500
🖨 Deal sheet 📄 Offer letter ✓ Due diligence
Listing remarks
Location, Location Location!!! Close to shopping, schools and groceries. This 3 bedroom ranch home in Elizabethtown. Nice size living room. Eat in kitchen with lovely cabinets. There is an office, deck and nice level fenced back yard with shade trees to enjoy this spring and summer. Great for a first home or retirement home.
Key facts
- Office
- Beautiful cabinets
- Eat in kitchen
Tags
Property features AI
Exterior
- Utilities: Public sewer
- Home design: Single family residence; Residential property
- Construction: Aluminum siding; Vinyl siding
- Exterior features: Shingle roof; Subdivision: ROSEMONT HIGHLAND; Directions: Dixie 31 W to Sycamore
Interior
- Kitchen: Gas water heater
- Bedrooms: 1 bedroom on the main level
- Flooring: Hardwood flooring; Vinyl flooring
- Bathrooms: 1 full bathroom (main level)
- Heating & cooling: Central heating (natural gas); Central air conditioning
- Interior features: Eat-in kitchen; Accessible full bathroom
Neighborhood map
What this means for you Summary
Snapshot
- This is a 2-bed/1.0-bath single-family listed at $156k.
Deal economics
- At list price, monthly cash flow is $14 ($168/yr) — positive.
- The deal already cash-flows at list — no discount required.
- To meet the 1% rule (rent ≥ 1% of price), the offer needs to be $125k (19.4% below list).
- Recommended offer: $125k (19.4% below list) — sets the bar for 1% rule.
- Cap rate 6.4% vs local median 3.4% in Elizabethtown — top-decile yield for the area; either an underpriced asset or a hidden risk that comps aren't pricing in. Stress-test before assuming the spread holds.
Location & tenants
- Location reads 72/100 on livability (#131 in KY) — a middle-class / working-renter tenant base. Strengths: crime A+, cost of living A+, housing A; Watch: employment D, amenities F, commute F.
- Elizabethtown Independent (urban): math 26% / reading 45% proficiency, ranked #66 of 165 in KY (top 40%) — families likely to look elsewhere, expect single-tenant / working-renter base with shorter leases.
- Zoned schools: Elizabethtown High School (math 35% / reading 45%, grade F, #39 of 254 statewide, top 15%, 824 students, 36% FRL).
- Market conditions: Rents rising (+3.3%/yr); 539 active listings in the ZIP; 2 comparable units currently listed for rent nearby; 946 units permitted in Hardin County in 2024 (464 in 5+ unit buildings).
Forward outlook
- Local home prices are declining (-3.0%/yr); year-one equity from $1k of loan paydown is wiped out by about $5k of value loss. Plan a longer hold.
- Hardin County population projected at -16% by 2050 — secular population decline; favor cash flow + early exit over multi-decade hold.
Negotiation context
- It's been on market 154 days — a 12% lower offer ($137k) is reasonable based on typical stale-listing flexibility.
Risks & watch-outs
- Watch-outs: built in 1951 — expect roof / HVAC / electrical / plumbing capex.
- Climate carrying-cost: extreme-heat days projected 7→19/yr by 2055 (HVAC capex compounding) — expect insurance premiums to compound above CPI over the hold.
Questions for the listing agent
- It's been on market 154 days. Have you received any prior offers? Is the seller open to a 19% concession, seller financing, or rate buy-down credit?
- Built in 1951 — when were the roof, HVAC, electrical panel, plumbing, and water heater last replaced?
- Why hasn't it sold? Are there any deal-killer items the seller is aware of (foundation, flood, title, zoning, code violations)?
- Is there a deadline driving the sale (1031 exchange, divorce, estate, relocation)? That informs how much negotiation room exists.
- The area grade is low — what's the realistic commute time and amenity access for the typical tenant pool here? Any planned neighborhood developments (good or bad) we should know about?
- What's the average days-on-market for RENTAL listings here right now (not sales)? A rising rental-DOM trend means longer vacancies and softer asking-rent achievability than the comps imply.
- What's the recent tenant-quality profile in this submarket — average credit score on applications, eviction rate, late-payment / NSF rate, and stable-employment percentage? A property-management company in the area should have these aggregated.
- How much new for-sale + rental construction is in the pipeline within 1–3 miles? Heavy new supply typically softens prices + rents 12–24 months out; constrained supply supports both.
Investment metrics
- 1% rule
- 0.81% ✗
- Cap rate
- 6.40%
- Cash-on-cash
- 0.38%
- DSCR
- 1.02
- GRM
- 10.3
CMA / ARV
- ARV (on-the-fly)
- $186,660
- Comps found
- 12
Show comp detail 12 sales within ~0.75 mi
| Address | Dist | Beds/Ba | Sqft | Sold | Price | $/sf | Match |
|---|---|---|---|---|---|---|---|
| 403 Village Dr | 0.19mi | 2/1.0 | 1,100 (+8%) | 8mo | $178,000 | $162 | 72 |
| 404 Diecks Dr | 0.32mi | 3/1.0 (+1) | 1,002 (-2%) | 7mo | $165,000 | $165 | 72 |
| 517 Henry St | 0.48mi | 3/1.0 (+1) | 1,000 (-2%) | 2mo | $189,000 | $189 | 68 |
| 508 Sunrise Ln | 0.39mi | 3/1.0 (+1) | 1,040 (+2%) | 9mo | $218,500 | $210 | 66 |
| 101 Mt Vernon Ct | 0.36mi | 2/1.5 | 1,073 (+5%) | 9mo | $217,000 | $202 | 65 |
| 626 N Miles St | 0.46mi | 3/1.0 (+1) | 1,000 (-2%) | 8mo | $182,600 | $183 | 64 |
| 512 N Mantle Ave | 0.39mi | 2/1.0 | 1,100 (+8%) | 6mo | $172,000 | $156 | 63 |
| 417 Moninda Ln | 0.20mi | 2/1.0 | 885 (-13%) | 8mo | $101,064 | $114 | 61 |
| 505 Henry St | 0.47mi | 2/1.0 | 1,144 (+12%) | 2mo | $160,000 | $140 | 56 |
| 521 Monin Rd | 0.54mi | 3/1.0 (+1) | 925 (-9%) | 0mo | $91,300 | $99 | 54 |
| 206 Beech St | 0.59mi | 3/1.0 (+1) | 1,107 (+8%) | 1mo | $225,000 | $203 | 53 |
| 212 Chandler St | 0.69mi | 3/2.0 (+1) | 1,120 (+10%) | 3mo | $207,500 | $185 | 40 |
Match score weights: distance 35% · size 25% · config 20% · recency 20%. Top-matched comps best support the ARV.
Projected returns pro-forma
-3.0% appreciation · 3.32% rent growth · sell at horizon
- IRR
- -15.4%
- Equity multiple
- 0.45×
- Total profit
- $-23,945
- Equity at exit
- $23,186
- IRR
- -6.4%
- Equity multiple
- 0.58×
- Total profit
- $-18,204
- Equity at exit
- $13,445
Cash invested: $43,540 (down + closing). Projections, not guarantees.
Landlord ↔ Tenant lean methodology
- Overall (STATE)
- 83 Strongly Landlord-Friendly
- State Kentucky
- 83 Strongly Landlord-Friendly · R+16
- County
- — inherits STATE
- City
- — inherits STATE
ZIP-level market 42701
- Home prices YoY
- -29.8%
- Rents YoY
- 3.3%
- Active inventory
- 539
- Price-to-rent
- 10.3×
Monthly cashflow live
- Estimated rent
- $1,253 medium interval (Pro) →
- Mortgage (P&I)
- −$815
- Tax from tax record
- −$96 /mo · $1,149/yr
- Insurance
- −$65
- HOA
- −$0
- Vacancy / Maint / Mgmt
- −$263
- Net cashflow
- $14
Break-even live
UW: 25.0% down · 7.5% · 30yr · 1.5% tax · 5.0% vac · 8.0% maint · 8.0% mgmt
Financing live
Cash to close
- Down payment
- $38,875
- Closing costs
- $4,665
- Reserves months
- —
- Total cash needed
- —
Loan-product check · same deal, 3 products live
Conventional
25% down · 7.5% · 30yr
- Down + closing
- —
- Monthly P&I
- —
- Monthly cashflow
- —
- DSCR
- —
- Eligible?
- —
Personal DTI + credit; lowest rate.
DSCR
20% down · 8.5% · 30yr
- Down + closing
- —
- Monthly P&I
- —
- Monthly cashflow
- —
- DSCR
- —
- Eligible?
- —
No personal income docs; deal must DSCR.
Hard money
10% down · 12.0% · 12mo
- Down + closing
- —
- Monthly P&I
- —
- Monthly cashflow
- —
- DSCR
- —
- Eligible?
- —
Short-term bridge; refi at stabilization.
Rent comps 2 comps
| Address | Beds | Baths | Sqft | Rent | $/sqft | DOM | Units | Dist |
|---|---|---|---|---|---|---|---|---|
| 900 David Ct Elizabethtown, KY | 1.0–2.0 | 1.0–1.5 | 780 | $985 | $1.26 | 43d | 15 | 1.09mi |
| 206 Cole Gray Blvd Elizabethtown, KY | 2.0–3.0 | 1.5–2.5 | 1730 | $1,399 | $0.81 | 3d | 1 | 1.35mi |
Listing history 16 events
-
2026-06-19days on market $155,500 Active 154 DOM
-
2026-06-18price $155,500 Active 153 DOM
-
2026-06-18days on market $159,900 Active 153 DOM
-
2026-06-17days on market $159,900 Active 152 DOM
-
2026-06-14days on market $159,900 Active 150 DOM
-
2026-06-13days on market $159,900 Active 149 DOM
-
2026-06-10days on market $159,900 Active 147 DOM
-
2026-06-09days on market $159,900 Active 146 DOM
-
2026-06-08days on market $159,900 Active 145 DOM
-
2026-06-07days on market $159,900 Active 144 DOM
-
2026-06-05days on market $159,900 Active 141 DOM
-
2026-06-02days on market $159,900 Active 139 DOM
-
2026-06-01days on market $159,900 Active 138 DOM
-
2026-05-31days on market $159,900 Active 137 DOM
-
2026-05-30days on market $159,900 Active 136 DOM
-
2026-01-14$159,900 Active
ⓘ Source: listings_history table (triggers on properties + properties_extension) + one-shot
backfill from property_details.listing_events for pre-trigger history.
Tax reassessment forecast KY · Resets to sale price
- Current annual tax
- $1,149 · $96/mo
- Projected year-2 tax
- $1,337 · $111/mo
- Expected delta
- +$188/yr (+$16/mo · 16.4%)
ⓘ Screening estimate from a state-policy table — verify with the county assessor before closing.
Climate risk First Street
- Flood 1/10 Low FEMA zone X (unshaded) · 0% chance over 30 yrs
- Wildfire 3/10 Moderate
- Heat 5/10 Major 7 d/yr ≥104°F today · 19 d/yr by 30 yrs out
- Wind 2/10 Low 2% chance of damaging wind over 30 yrs
- Air quality 1/10 Low 0 unhealthy d/yr today · 0 by 30 yrs out
Nearby sold comps map
Loading sold comps map…
Walkable amenities ~0.75 mi
Loading nearby amenities…
Taxation est. · year 1
- Rental income
- $15,037
- − Mortgage interest
- −$8,710
- − Property taxes
- −$1,149
- − Insurance
- −$778
- − Repairs & maintenance
- −$1,203
- − Management
- −$1,203
- − Depreciation
- −$4,524
- Taxable loss
- −$2,529
- Est. tax savings @ 24.0%
- +$607
- After-tax cash flow
- $775/yr
For passive investors: Depreciation is non-cash, so a rental often shows a tax loss while cash-flowing — sheltering income. Rental losses are passive: they offset passive income freely, and up to $25,000/yr can offset ordinary (W-2) income if you actively participate and your MAGI is under $100k (phasing out to $0 by $150k); unused losses carry forward. On sale, claimed depreciation is recaptured at up to 25%, and gains may owe capital-gains tax (a 1031 exchange can defer both). Figures are a year-1 estimate at your 24.0% rate — not tax advice; consult a CPA.
Schools (NCES district)
- District
- Elizabethtown Independent
- NCES district ID
- 2101650
- Math proficiency
- 26% ▼ -25.00%
- Reading proficiency
- 45% ▼ -17.00%
- Median HH income
- $36,400
- Composite
- 29.39/100
- National rank
- #6526
- State rank
- #66 of 165 in KY
Livability — Elizabethtown
- Score
- 72/100
- State rank
- #131
- US rank
- #6198
Category grades
Schools grade is shown separately in the Schools card above.
Census & demographics
- Census place
- Elizabethtown, KY
- County
- Hardin County · 77,611 people
- City population
- 53,987
- Metro
- Elizabethtown-Fort Knox, KY
- Population (ZIP)
- 53,987
- Household income
- $69,619
- Rent vs Own
- Severe rent burden
- 1663.0
Population outlook (Hardin County) Hauer SSP2
- Today (2025)
- 105,573 people
- By 2030
- 103,563 · -1.9%
- By 2040
- 97,077 · -8.0%
- By 2050
- 88,367 · -16.3%
- By 2075
- 65,405 · -38.0%
- By 2100
- 42,245 · -60.0%
Race, ethnicity, and origin ACS 2023
- Neighborhood character
- Predominantly White (79%)
- Race & ethnicity
- White 79% Black 9% Two or more races 6% Hispanic / Latino 5% Asian 2%
- Hispanic origin (detail)
- Mexican 3% Puerto Rican 1%
- Common ancestry
- Italian 3% Slovak 2% Romanian 2%
- Foreign-born
- 4% · Canada, South Korea
- Languages at home
- 94% English-only · Spanish 3% German/W. Germanic 1% Other Indo-European 1%
Political lean MEDSL · Hardin
- 2024 margin
- Strong R (+29.3) · D 34.5% · R 63.8% · Other 1.7%
- 2008→2024 swing
- -8.7pp toward R · 2008: -20.6pp · 2024: -29.3pp
- All cycles
- 2024: R+29.3 2020: R+24.0 2016: R+30.2 2012: R+20.8 2008: R+20.6
Not yet ingested
- Civics
- —
Market trends
- HPI YoY
- ▼ -96.94%
- Current HPI
- 228.7091
- Rent YoY
- ▲ 3.32%
- Metro
- Elizabethtown-Fort Knox, KY
- State GDP YoY
- ▲ 1.81%
- F500 in state
- 4
Industry mix (Fortune 500 HQ in KY)
| Industry | F500 HQs | Revenue |
|---|---|---|
| Healthcare | 1 | $118B |
|
||
| Food / Beverage | 1 | $7B |
|
||
Price history
1 event — show timeline
- 2026-01-14 Listed $159,900 HKARMLS
Property tax history
+5.0%/yrLatest (2025): $1,149 · +1.6% YoY. Source: county tax records.
Cash-flow waterfall
monthlySold comps — $/sqft
last 12 mo · ≤1 miLoading sold comps…